This study analyzed the frequency and clinical significance of t(4;14)(p16;q32) in multiple myeloma (MM) among 208 patients with MM and 52 patients with monoclonal gammopathy of undetermined significance (MGUS); diagnosed between 1994 and 2001. Patients with the translocation were identified using reverse transcription–polymerase chain reaction (RT-PCR) to detect hybrid immunoglobulin heavy chain (IgH)–MMSET transcripts from the der(4) chromosome. We found 31 (14.9%) t(4;14)+ MM patients and 1 (1.9%) t(4;14)+ MGUS patient. IgH-MMSET hybrid transcripts were detected in bone marrow (BM) and blood. Breakpoint analysis revealed that 67.7% of t(4;14)+ patients expressed hybrid transcripts potentially encoding full-length MMSET, whereas the remainder lacked one or more amino terminal exons. Expression of fibroblast growth factor receptor 3 (FGFR3), presumptively dysregulated on der(14), was detected by RT-PCR in only 23 of 31 (74%) patients with t(4;14)+ MM. Patients lacking FGFR3 expression also lacked detectable der(14) products. Longitudinal analysis of 53 MM patients with multiple BM and blood samples showed that, over time, BM from t(4;14)+ patients remained positive and that t(4;14)− patients did not acquire the translocation. IgH-MMSET hybrid transcripts and FGFR3 transcripts disappeared from blood during response to therapy. No correlation was observed between the occurrence of t(4;14) and known prognostic indicators. However, we find the t(4;14) translocation predicts for poor survival (P = .006; median, 644 days vs 1288 days; hazard ratio [HR], 2.0), even in FGFR3 nonexpressors (P = .003). The presence of t(4;14) is also predictive of poor response to first-line chemotherapy (P = .05). These results indicate a significant clinical impact of the t(4;14) translocation in MM that is independent of FGFR3 expression.
Introduction
Multiple myeloma (MM) is a genetically unstable malignancy of postgerminal center B-lineage cells. The malignant cells of each patient are characterized by their unique rearrangement of the variable, diversity, and joining (VDJ) gene segments of the immunoglobulin heavy chain (IgH) loci at 14q32, termed clonotypic.1 This unique molecular signature has allowed the hierarchy of the MM lineage to be studied.2-7 The clonotypic rearrangement on the functionally rearranged IgH locus gives rise to the monoclonal protein detected in the serum of most MM patients. The nonrearranged or nonfunctionally rearranged IgH locus on the alternative chromosome 14 is hypothesized to be the site of MM-initiating translocations.8 In MM these translocations typically occur in regions of the IgH loci that mediate isotype switching, termed switch (S) regions. Because most MM patients produce a monoclonal protein and most switch translocations occur in the Sμ region, it is predicted that switch translocations must occur on the nonrearranged or nonfunctionally rearranged IgH locus.8
In MM, IgH translocations are observed in 60% to 80% of patients.9-12 Unlike mantle cell lymphoma with its characteristic t(11;14)(q13;q32),13 MM is not characterized by one specific translocation event. A number of recurrent switch translocations have been identified in MM cell lines and patient samples. These include t(11;14)(q13;q32), t(4;14)(p16;q32), t(14;16)(q32;q23), t(6;14)(p25;q32), and t(6;14)(p21;q32), predicted to target PRAD1/cyclin D1, FGFR3 and WHSC1/MMSET/NSD2, c-maf, MUM1/IRF4, and cyclin D3, respectively.14-20 However, the recurrent translocations only encompass approximately 38.5% of patients with IgH translocations.12 The clinical significance of these recurrent events is largely unknown; however, 2 reports on t(11;14), the most common translocation in MM, indicated no adverse correlation with survival.21 22
The t(4;14) translocation is undetectable by conventional cytogenetics (G-banding) or spectral karyotyping (SKY) because of the telomeric localization of both chromosomal partner domains. It was first identified by Southern blotting and has been detected by fluorescence in situ hybridization (FISH) and reverse transcription–polymerase chain reaction (RT-PCR) in MM, monoclonal gammopathy of undetermined significance (MGUS), and primary amyloidosis.15-17,22-26The genomic locations of t(4;14) breakpoints are almost exclusively in or near switch regions of the IgH loci.27 The breakpoints on chromosome 4 occur within an approximately 113-kb region between FGFR3 and MMSET exon 5. This breakpoint region is a small part of a conserved gene cluster including the transforming acidic coiled-coil protein 3 (TACC3), fibroblast growth factor receptor 3 (FGFR3), and multiple myeloma SET domain-containing protein (MMSET), also known as WHSC1 and NSD2. FGFR3 and TACC3 may be dysregulated by the strong 3′ enhancers on der(14), whereas MMSET and RE-IIBP may be dysregulated by the intronic Eu enhancer on der(4). A small subset, approximately 10%, of the t(4;14)+patients have acquired activating mutations of FGFR3 on the allele expressed by the malignant cells.28These mutations induce proliferation, prevent apoptosis, and are transforming in murine fibroblasts and hematopoietic cells.29-31 In a recent analysis no difference in survival was observed between FGFR3 expressors and nonexpressors.32Moreover, 2 contradictory reports regarding the survival of MM patients with t(4;14) have recently been published with the larger study reporting a decrease in overall survival.22 25
The main goals of this study were to determine the frequency and clinical significance of t(4;14). We used a previously described and validated RT-PCR methodology to screen a large cohort of MM and MGUS patients collected over an 8-year period for t(4;14).17 24Bone marrow samples from 208 MM patients and 52 MGUS patients were screened for t(4;14), and IgH-MMSET hybrid transcripts were detected in 14.9% and 1.9%, respectively. Hybrid transcripts were detectable in the peripheral blood (PB) of most t(4;14)+ patients. Based on breakpoint analysis, 67.7% of the positive patients may express hybrid transcripts that could potentially encode full-length MMSET. The remaining 32.3% of the t(4;14)+ patients express hybrid transcripts lacking one or more amino terminal exons, including exon 3, with the putative start codon. FGFR3 expression was detected in 74% of patients with the translocation and none of the patients without the translocation. Patients lacking FGFR3 expression also had no detectable der(14) product by RT-PCR. Longitudinal analysis of patients with multiple BM and PB samples showed no change in t(4;14) status throughout the course of disease. We found no correlation between the occurrence of t(4;14) and known prognostic indicators. However, the translocation predicts for decreased survival (P = .006), which is maintained in FGFR3 nonexpressors (P = .003) and predicts for poor response to first-line chemotherapy (P = .05).
Patients, materials, and methods
Patients and cell lines
Peripheral blood (PB) and bone marrow (BM) samples (total, 480) were collected after informed consent from 260 patients between October 1994 and December 2001. This cohort includes 208 patients with MM and 52 with MGUS, as defined according to standard criteria.33 34 Patients in the MGUS cohort all had IgG or IgA paraproteins. Patients with an IgM monoclonal gammopathy were only included if they also had a second IgG or IgA paraprotein in the blood. BM samples from the time of diagnosis of MM were available for 137 patients. All patient records from the 2 treating institutions were reviewed retrospectively to verify the diagnosis of MGUS and MM. Information on diagnosis, patient demographics, baseline staging and clinical features, treatment, response to therapy, progression, and survival were collected. The investigators involved in caring for the patients (A.R.B., M.J.M., L.M.L.) and abstracting the clinical data (T.R.) were unaware of the t(4;14) status of the patients during charting and data collection.
The MM cell line NCI-H929 was purchased from American Type Culture Collection. RPMI 8226, U266, and S6B45 were generously supplied by S. Treon (Dana-Farber Cancer Institute). KMS-11, KMS-12-BM, KMS-12-PE were generous gifts from T. Otsuki (Kawasaki Medical School). All cell lines were maintained in recommended media at 37°C in 5% CO2.
RNA extraction and cDNA synthesis
Patient bone marrow mononuclear cells (BMMCs) and peripheral blood mononuclear cells (PBMCs) were purified on Ficoll-Hypaque Plus (Amersham Pharmacia Biotech, Uppsala, Sweden) density gradients. Mononuclear cells were suspended in TRIzol Reagent (Invitrogen, Carlsbad, CA) at 2-10 × 106 cells/mL and total RNA was extracted according to the manufacturer's instructions. Poly-A–tailed RNA was reverse transcribed for 1 hour at 42°C followed by enzyme inactivation at 99°C for 3 minutes from 1 μg total RNA with 500 μM dT15, 500 μM each dNTP, 10 mM dithiothreitol (DTT), 50 mM Tris (tris[hydroxymethyl]aminomethane)–HCl, 75 mM KCl, 3 mM MgCl2, and 200 U Superscript RNase H− Reverse Transcriptase (Invitrogen) in a 20-μL reaction.
RT-PCR
All RT-PCRs contained 20 mM Tris-HCl, 50 mM KCl, 2.0 mM MgCl2, 200 μM each dNTP, 1.0 U Platinum Taq DNA polymerase (Invitrogen), and 0.2 μM each PCR primer. All primer sequences are listed in Table 1. One-stage patient screening and der(14) reactions were carried out in 25-μL reactions using 5% of the cDNA as template. Screening reactions consisted of an initial 5-minute denaturation at 94°C, followed by 35 cycles of amplification at an annealing temperature of 60°C and 1-minute extensions at 72°C using JH or Iμ1 in combination with ms6r. The more sensitive 2-stage reaction used 1 μL of the Iμ1-ms6r product as template in a 50-μL reaction, with the Iμ2 and ms5r primers followed by 30 cycles of amplification in conditions described above. The der(14) reactions were the same as the 1-stage screening reactions except extensions lasted only 30 seconds. FGFR3 expression was detected by 1-stage RT-PCR using the 5′ and 3′ FGFR3-C primers, annealing at 65°C, in a 50-μL reaction after 30 cycles of amplification using 5% of the cDNA as template. In all cases, PCR products were visualized by ethidium bromide (EtBr) staining on 2% agarose (Invitrogen) gels. Sequencing of clonotypic VDJ rearrangements was performed as previously described.4
Statistics
This study was designed to look at the prevalence of t(4;14) and its impact on overall survival in MM. Secondary analyses included correlation with baseline clinical features, response to therapy, and progression-free survival. Data were analyzed using SAS version 8 for Windows (SAS, Cary, NC) and GraphPad Prism version 3.02 for Windows (GraphPad software, San Diego CA). Categorical variables were compared between 2 groups using Fisher exact test. Continuous variables were compared using the Student t test or the Wilcoxon rank-sum test as appropriate. Survival distributions were determined using the Kaplan-Meier method and compared using the log-rank test. Statistical significance was set at P = .05 using 2-sided analysis. A Cox regression model was used to adjust for known prognostic factors. Autologous stem cell transplantation was included in the model using landmark analysis.
Results
Patient characteristics
Baseline characteristics of the 208 MM patients are listed in Table 2. Fourteen patients in the cohort have not received systemic therapy either because they were diagnosed in terminal stages (n = 7, including 2 t(4;14)+ patients) or because they have not required it (n = 7, including 2 t(4;14)+ patients). Sixty-three patients were treated initially with cyclical vincristine-Adriamycin-dexamethasone (VAD) chemotherapy followed by high-dose melphalan and autologous stem cell transplantation. One patient has undergone allogeneic transplantation. Of the 126 patients listed in Table 2 as having been treated with chemotherapy, 116 patients were treated principally with conventional chemotherapy regimens (85 with melphalan plus corticosteroids, 31 with VAD). Three of these patients were receiving VAD in preparation for autologous transplantation. The remaining patients were treated with a variety of therapies (dexamethasone alone, n = 6; delayed autologous transplantation, n = 2; single-agent melphalan, n = 1; cyclophosphamide plus dexamethasone, n = 1; unspecified, n = 4).
Screening the patient cohort for the t(4;14) translocation by RT-PCR
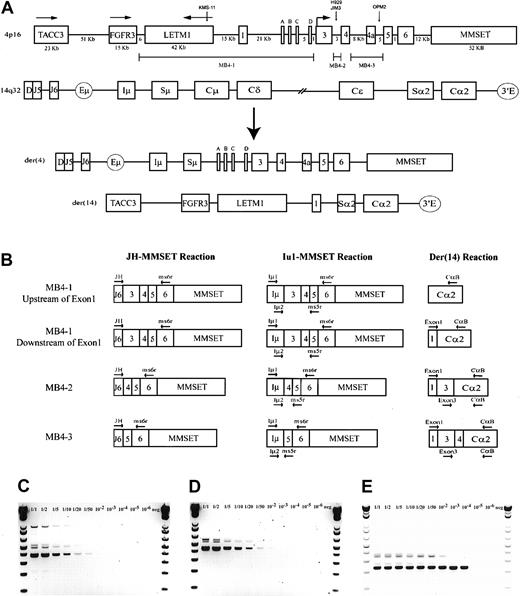
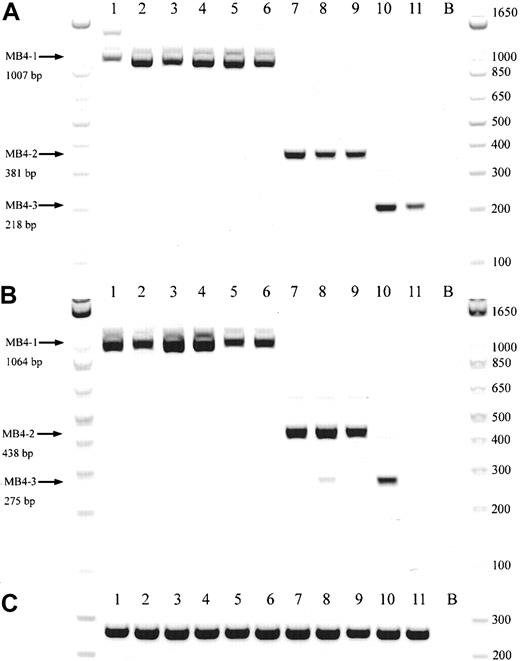
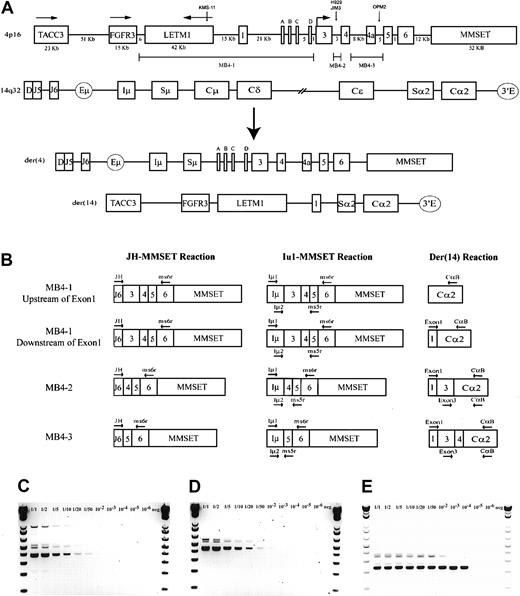
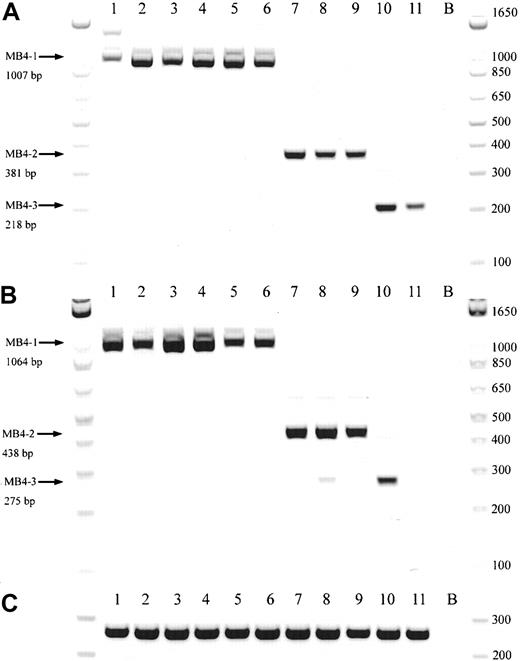
A schematic representation of the most common t(4;14) breakpoint cluster is shown in Figure 1A. To identify patients with the t(4;14) translocation, we used a previously described and validated RT-PCR assay designed to detect IgH-MMSET hybrid transcripts originating from the der(4) chromosome created by the translocation.17,24 We first confirmed the specificity of our assay with a panel of previously characterized MM cell lines, only detecting hybrid transcripts in NCI-H929 and KMS-11 as expected (data not shown). Subsequently, the sensitivity of the assay was tested by cell-mixing experiments with NCI-H929 cells (t(4;14)+cell line) and U266 cells (t(4;14)− cell line). The one-stage assays using JH-ms6r or Iμ1-ms6r primer sets detect 1 in 50 positive cells (Figure 1C-D). Therefore, we used the single-stage assays to screen the MM cohort, presuming the sensitivity to be adequate. BM samples from 208 MM patients were screened of which 137 were the diagnostic sample. A representative gel of each screening reaction indicating the various breakpoints is shown in Figure 2A-B. As shown in Table3, we detected t(4;14)+ cells in 31 of the 208 (14.9%) MM patients. The t(4;14)+patients can be separated further into 3 major breakpoint groups based on the size of the RT-PCR product (Figures 1B, 2A-B).24The 31 t(4;14)+ patients subdivide into 19 with the MB4-1 breakpoint and 5 patients each with the MB4-2 or MB4-3 breakpoint (Table 4). Of interest, we identified 2 patients who expressed JH-MMSET hybrids but not Iμ-MMSET hybrids; one of the patients is shown in Figure 2A-B in lane 11. Each patient had the MB4-3 breakpoint type and had plasma cell counts of 50% and 20% in their BM aspirates, respectively. We hypothesize that the genomic breakpoints in these patients may be upstream of the Iμ1 primer binding region or, alternatively, in a downstream switch region.
The t(4;14) translocation and IgH-MMSET hybrid RT-PCR assays.
(A) Schematic representation of areas of interest from 4p16 and 14q32. Genomic distances of 4p16 are to relative scale, as determined by genomic contig NT_022865.9. Any distance smaller than 1 kb is not indicated. The directions of transcription for TACC3, FGFR3, and LETM1 are indicated by horizontal arrows; for MMSET this also indicates the location of the start codon. MMSET exons 2a, b, c, and d are indicated by A, B, C, and D. The approximate t(4;14) breakpoint locations on chromosome 4 of the MM cell lines KMS-11 (MB4-1), NCI-H929 (MB4-2), JIM3, and OPM2 (MB4-3) are represented by vertical arrows. The breakpoint regions MB4-1, MB4-2, and MB4-3 on 4p16 are represented by marker bars. A representation of der(4) and der(14), created by an MB4-1 translocation with a chromosome 4 breakpoint between MMSET exon 1 and exon 2a, is shown. (B) Representative hybrid transcripts created on der(4) and der(14) by the different breakpoint transcripts and the relative binding locations of PCR primers. Primers are indicated by horizontal arrows. Two different diagrams are shown for MB4-1 to highlight the expected differences in the der(14) reactions, depending on the breakpoint location relative to MMSET exon 1. (C) Sensitivity of the single-stage JH-ms6r assay determined by mixing MB4-2 type t(4;14)+ cell line NCI-H929 with t(4;14)− cell line U266 is 1 of 50 positive cells. Numbers above each lane represent the dilution of t(4;14)+ cells. (D) The sensitivity of single-stage Iμ1-ms6r assay is 1 of 50 positive cells. (E) Sensitivity of the nested 2-stage assay is 1 of 10 000 positive cells.
To screen the MGUS patients, we used a more sensitive 2-stage assay because the number of clonal cells could be below the level of detection of the single-stage assay. The more sensitive 2-stage assay is a nested PCR reaction of the single-stage Iμ1-ms6r product with the Iμ2-ms5r primer set. This assay was shown to readily detect 1 in 10 000 positive cells in the cell mixing experiment (Figure 1E). Using this assay we screened bone marrow samples from 52 MGUS patients. We found one t(4;14)+ patient among the 52 MGUS patients (1.9%) (Table 3). The patient has the MB4-1 breakpoint and has not made the transition to overt MM after 15 months of follow-up (Table 4).
IgH-MMSET hybrid transcripts are detectable in the peripheral blood of MM patients
To determine whether cells harboring the t(4;14) translocation are detectable outside the BM, we screened a random subset of the MM cohort with PB samples taken at the same time as the screened BM samples. Cells with the translocation were detected using the one-stage screening assays. Of the 35 patients screened, 10 were previously identified as t(4;14)+ in the BM screening. Eight patients had t(4;14) detectable in the PB, and all were positive in the BM with the same breakpoint type (Table 3). For 2 of 10 patients, the PBMC samples screened were negative even though the BM samples were positive. Thus, 80% of the t(4;14)+ patients had detectable cells in the PB. For most of these patients, t(4;14)+ cells in total PBMCs must be relatively frequent (more than 2% of PBMCs) because the sensitivity of the single-stage assay is 1 in 50 cells.
Correlation of IgH-MMSET hybrid transcripts with baseline patient factors
In this cohort, the presence of t(4;14) was not associated with statistically significant differences in any of the baseline patient factors examined—age, sex, clinical isotype, Durie-Salmon stage, β2-microglobulin, lactate dehydrogenase (LDH), albumin, serum creatinine, calcium, hemoglobin, serum or urine monoclonal protein level, percentage plasma cells (PCs) in the BM, circulating PCs on PB smears, lytic bone disease, and use of high-dose chemotherapy. A trend toward increased proteinuria in t(4;14)+ patients was suggested by the data (Table 2), but this did not reach statistical significance (P = .06) and was based on small patient numbers.
IgH-MMSET transcript may be associated with poor response to first-line systemic therapy
One hundred thirty-five patients had sufficient data to be analyzed retrospectively for response to first-line therapy. A response was defined according to the National Cancer Institute of Canada Clinical Trials Group criteria.35 The main reasons for exclusion included too few courses of therapy or insufficient data found on the retrospective chart review. Of the 135 patients, 11 of 20 (55%) t(4;14)+ responded compared with 89 of 115 (78%) t(4;14)− patients (P = .05). This trend toward reduced response to therapy in t(4;14)+ patients was seen in all treatment subgroups, but the subgroups were too small to reach statistical significance.
IgH-MMSET transcript is associated with poor overall survival
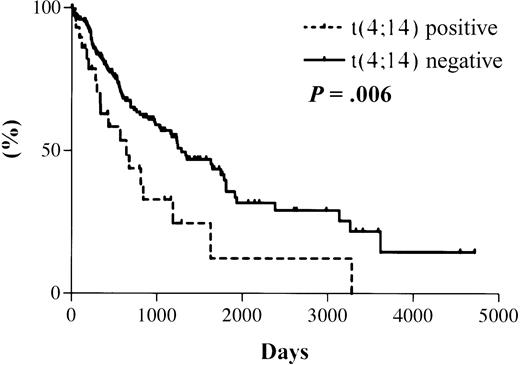
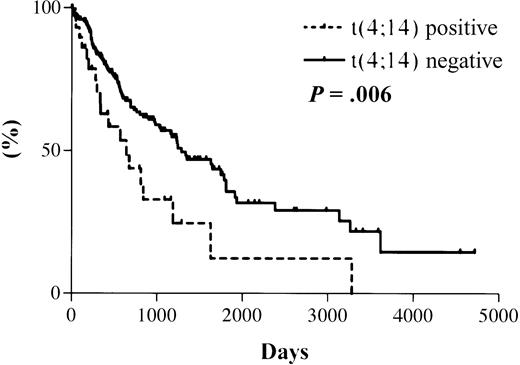
The median survival from the date of diagnosis in the 31 MM patients with t(4;14), as detected by RT-PCR, was 644 days. The median survival for the 177 patients with a negative RT-PCR result is projected to be 1288 days (Figure 3). The actual median survival for this group has not yet been reached. The difference in survival between the 2 groups is statistically significant (hazard ratio [HR], 2.0; 95% confidence interval [CI], 1.4-2.6; P = .006).
Representative gel from 11 t(4;14)+patients.
(A) Representative gel of 11 t(4;14)+ patients, with various breakpoints, detected by a JH-ms6r assay. Lane B, negative control. (B) Representative gel of the same 11 patients detected by an Ιμ1-ms6r assay; lane B, negative control. (C) cDNA integrity tests with β2-M primers on the 11 patient samples; lane B, negative control.
Kaplan-Meier overall survival plot for patient cohort.
Dotted line indicates data for 31 t(4;14)+ patients with a median survival of 644 days; solid line indicates data for 177 t(4;14)− patients with a projected median survival of 1288 days. Log rank test results: HR, 2.0; 95% CI, 1.4-2.6;P = .006.
Kaplan-Meier overall survival plot for patient cohort.
Dotted line indicates data for 31 t(4;14)+ patients with a median survival of 644 days; solid line indicates data for 177 t(4;14)− patients with a projected median survival of 1288 days. Log rank test results: HR, 2.0; 95% CI, 1.4-2.6;P = .006.
We used a Cox model to adjust the relationship between t(4;14) and survival for baseline patient characteristics and for the type of therapy received (eg, standard-dose vs high-dose chemotherapy). Significant predictors of survival in the model included t(4;14) status (P = .002), age (P = .02), β2-microglobulin level (P < .0001), BM plasmacytosis (P = .01), and high-dose chemotherapy (P < .001). The adjusted hazard ratio in t(4;14)+ patients was 2.6 (95% CI, 1.4-4.8).
This study was population based, and was composed of a diverse array of patients treated with a variety of therapies. In addition, not all patients provided samples at the time of diagnosis, and it was assumed, based on our longitudinal analysis below, that t(4;14) status does not change with time. However, the adverse prognostic effect of t(4;14) was significant even in the subset of 137 patients who provided a diagnostic sample (P = .01), even after adjusting for other prognostic factors such as high-dose chemotherapy in a Cox model. Furthermore, the adverse prognostic effect is maintained in the subgroup of 112 patients who received conventional chemotherapy (P = .01).
FGFR3 expression in t(4;14)+ patients
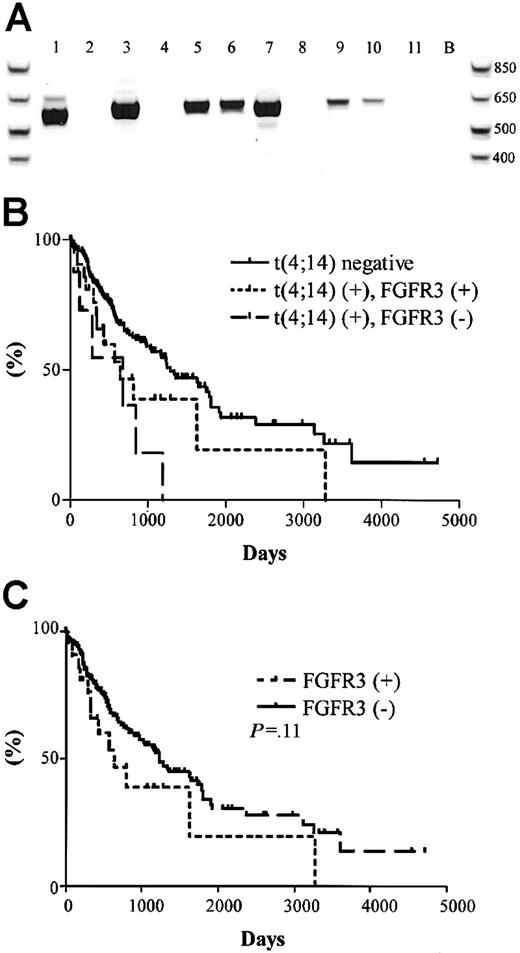
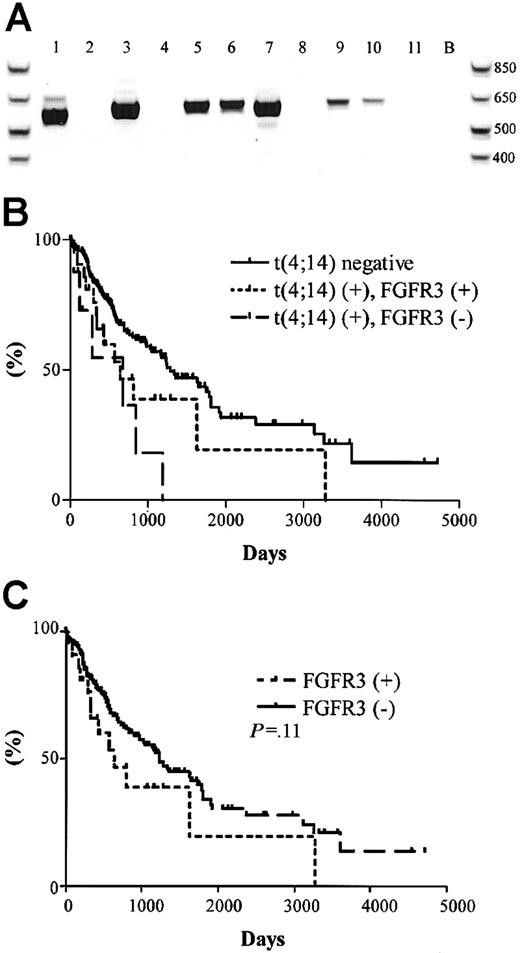
The significance of the t(4;14) translocation is hypothesized to be the dysregulation of FGFR3 expression, a receptor tyrosine kinase not normally expressed in plasma cells or total BM, by the strong 3′ enhancers of the IgH locus (Figure 1A).15 We screened the 31 t(4;14)+ MM patients for the expression of FGFR3 by RT-PCR. A representative gel is shown in Figure4A, which contains the same patient samples analyzed in Figure 2A-B. Unexpectedly, only 23 of the 31 (74%) patients had detectable levels of FGFR3 expression (Table 4). For 2 of the FGFR3 nonexpressors, we were able to verify their lack of FGFR3 expression in 3 independent BM samples taken at various disease stages, primarily diagnosis and relapse.
FGFR3 expression and clinical significance in t(4;14)+ MM patients.
(A) RT-PCR detection of FGFR3 expression in 11 t(4;14)+patients (the same patients and order as represented in Figure 2A-B. Lane B, H2O control. (B) Kaplan-Meier plot of survival for t(4;14) positive patients with respect to FGFR3 expression. Solid line represents the 177 t(4;14)− patients; dotted line represents the 23 t(4;14)+ patients expressing FGFR3; dashed line represents the 8 t(4;14)+ patients who do not express FGFR3. The difference in survival between t(4;14)+FGFR3 nonexpressors and t(4;14)− patients was statistically significant (P = .003). (C) Kaplan-Meier plot of survival for FGFR3-expressing patients versus nonexpressing patients. Solid line represents the 185 FGFR3 nonexpressors; dotted line represents the 23 FGFR3 expressors in the cohort (P = .11).
The unexpected FGFR3 expression profiles prompted us to reanalyze the survival profiles of the patient cohort with respect to t(4;14) status and FGFR3 expression. We found no difference in the median survival between the t(4;14)+ patients when segregated based on their FGFR3 expression—644 days versus 675 days for FGFR3 expressors and nonexpressors, respectively (P = .22) (Figure 4B). In this exploratory analysis, FGFR3 expressors and nonexpressors appeared to have inferior outcomes relative to patients lacking the t(4;14) translocation (P = .07 for FGFR3 expressors andP = .003 for FGFR3 nonexpressors compared with t(4;14)− negative patients).
We screened the 177 t(4;14)−patients and found no patients who expressed FGFR3. No significant difference in survival was observed between the 23 FGFR3 expressors and the 185 nonexpressors (P = .11) (Figure 4C).
Detection of the der(14) chromosome
The lack of FGFR3 expression may reflect a loss of the der(14) chromosome created by the translocation. To investigate whether the der(14) chromosome was detectable in our t(4;14)+population, we used 8 different RT-PCR reactions to detect hybrid MMSET-IgH transcripts. Half the reactions used a 5′ MMSET exon 1 primer in combination with consensus 3′ primers for the CH1 exon of IgM or IgD or IgG or IgA, whereas the other half used a 5′ MMSET exon 3 primer with the same IgH primers. The MMSET exon 1 reactions will detect der(14) only if the chromosome 4 breakpoint is downstream of MMSET exon 1 (Figure 1A-B). Moreover, any reaction using a 5′ MMSET exon 3 primer is predicted to amplify a product only for MB4-2 and MB4-3 patients (Figure 1B). In our patient population we were able to detect der(14) in 11 of 31 t(4;14)+ MM patients and in the 1 t(4;14)+ MGUS patient (Table 4). In the 5 MB4-2 and 5 MB4-3 patients, 4 of 5 FGFR3 expressors had detectable der(14) products in both reactions and 5 of 5 FGFR3 nonexpressors lacked detectable der(14). For the MB4-1 patients, the detection of der(14) was not consistent, likely reflecting a subset of patients with breakpoints upstream of MMSET exon 1, as seen in the KMS-11 cell line. However, none of the 3 MB4-1 FGFR3 nonexpressors had a detectable der(14) product. Interestingly, for 8 of 10 patients, the der(14) products were detected only with CH1 primers to their clinical isotype, suggesting that the switching event that takes place on the functionally rearranged chromosome also occurs on the chromosome involved in the translocation.
Longitudinal analysis of the t(4;14) translocation
We first attempted to determine whether the t(4;14) translocation could be a progression event in MM by screening BM samples from patients at different stages of disease. Multiple BM samples were available from 53 of the MM patients, with a median number of 2 samples each (range, 2-4 samples). The 53 patients included 44 t(4;14)− and 9 t(4;14)+ patients at diagnosis. Median follow-up was 18 months (range, 1-37 months). All the t(4;14)+ patients remained positive for hybrid transcripts over their respective timelines, and the t(4;14)− patients remained negative. Moreover, the expression of FGFR3 did not change in any of these patients over the BM samples analyzed.
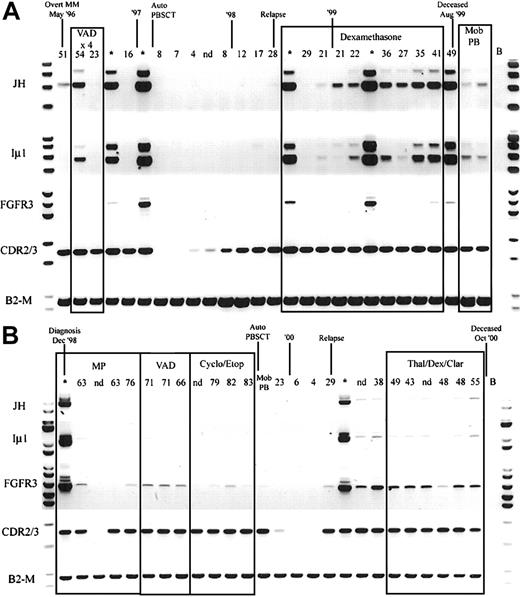
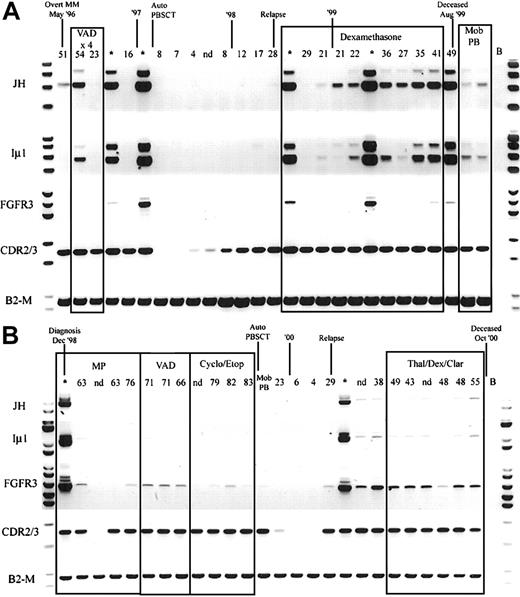
Because hybrid IgH-MMSET transcripts are detectable in the peripheral blood at diagnosis, we determined the relationship between detection of hybrid IgH-MMSET transcripts and disease burden, as measured by M protein levels, over the course of disease. We performed longitudinal analysis on 5 of the t(4;14)+ patients for whom we had sequential BMMC and PBMC samples covering the entire disease course and clonotypic CDR2-CDR3 primers. Hybrid IgH-MMSET transcripts were detectable in the peripheral blood at various points during the course of disease for each patient analyzed. Most often, hybrid transcripts were detectable at diagnosis became undetectable during therapy-related remission and subsequently became detectable at relapse and were maintained during the terminal phase (Figure 5A-B). The expression of FGFR3 was also followed through the time courses. FGFR3 expression often correlated with the detection of hybrid transcripts; however, in some situations only FGFR3 or IgH hybrid transcripts were detected at specific time-points (Figure 5). Both patients shown in Figure 5 are FGFR3 expressors. Two of the 5 patients analyzed were FGFR3 nonexpressors in the diagnosis BM. The lack of FGFR3 expression was maintained in all subsequent BM and PB samples analyzed for each nonexpressor patient (not shown). Finally, we attempted to determine whether the detection of IgH-MMSET hybrid transcripts was equivalent to the detection of clonotypic CDR2/CDR3 transcripts in monitoring minimal residual disease. In all patients analyzed, monitoring of clonotypic CDR2/CDR3 transcripts was a considerably more sensitive means to detect residual or emerging disease than was monitoring for IgH-MMSET or FGFR3 transcripts (Figure 5A-B).
Longitudinal analysis of IgH-MMSET hybrid transcripts and FGFR3.
PB and BM samples collected over the course of disease from 2 t(4;14)+ FGFR3-expressing MM patients are shown. The monoclonal protein values (g/L) at each visit are marked above each PB sample, and BM samples are denoted by an asterisk. Clinical diagnosis and relapse along with therapy are noted. Auto-PBSCT indicates autologous peripheral blood stem cell transplantation following high-dose therapy; Mob PB, apheresis product from mobilized peripheral blood. Representative panels for each reaction are shown. JH, JH-ms6r hybrid transcript assay; Iμ1, Iμ1-ms6r hybrid transcript assay; FGFR3, FGFR3 expression; CDR2/3, CDR2-CDR3 patient-specific transcript assay; B2-M, positive control for integrity of RNA. (A) The patient whose results are shown has the MB4-3 breakpoint type; however, the breakpoint occurs between exon 4 and exon 4a, creating a doublet band. The upper band of the doublet results from alternative splicing to exon 4a, as in Figure 1A. (B) The patient whose results are shown has the MB4-1 breakpoint type.
Discussion
The aims of this study were to determine the frequency and clinical significance of t(4;14)(p16;q32) in MM patients. We used RT-PCR to detect hybrid IgH-MMSET transcripts as an indicator of t(4;14)+ patients.17,24 This allowed the retrospective analysis of 480 BM and PB samples, representing 208 MM patients and 52 MGUS patients, collected over an 8-year period from 1994 to 2001. We have demonstrated the major prognostic significance of t(4;14) as detected by RT-PCR for the IgH/MMSET fusion transcript in MM. This novel result appears to be confirmed with an alternative method by early reports from other groups that have evaluated t(4;14) using FISH.22,36 37 The presence of this translocation is associated with a marked reduction in overall survival. It is intriguing to note that clinically, patients with t(4;14) do not differ greatly from t(4;14)− patients at the time of diagnosis, yet their overall survival is much poorer. Our results suggest a reduced response rate in t(4;14)+ patients treated with conventional chemotherapy regimens. It follows that drug resistance may be one aspect of the t(4;14) phenotype that contributes to poor prognosis. This hypothesis requires confirmation in prospective clinical trials in which t(4;14) status is obtained at baseline.
The detection of IgH-MMSET hybrid transcripts by RT-PCR provides a simple and reliable means to detect t(4;14)(p16;q32) in MM. Here we show in a large cohort of MM patients that the frequency of t(4;14) events is 31 of 208 (14.9%). This frequency is consistent with previous reports from FISH and RT-PCR studies of t(4;14) indicating frequencies of 10% to 20% in MM patient populations.9,12,22-25,38,39 Subsequently, we detected hybrid transcripts in the PB of MM patients at various points of the disease process, though the origin of these hybrid transcripts has not been determined. We have found that t(4;14) is much more prevalent in MM (14.9%) than in MGUS (1.9%). This result is concordant with the findings of Avet-Loiseau et al39 (10% in MM vs 2% in MGUS) and Malgeri et al24 (20% in MM vs 7% in MGUS). The Mayo clinic group has found the prevalence of t(4;14) to be more similar in MM (13.1%) and MGUS (9%); their result is discrepant largely because of a much higher estimate of the prevalence of t(4;14) in MGUS.37,40 The increased prevalence of t(4;14) in MM compared with MGUS in the 4 studies suggests that the translocation is involved in the transition from MGUS to MM. However, most MM patients lack t(4;14), and several cases of t(4;14)+ MGUS have been reported in which transformation to MM has not occurred after several years of follow-up.24 40 Thus, though t(4;14) may be involved in the transformation from MGUS to MM, it is not necessary for transformation nor is it a sign of inevitable or rapid transformation.
Although we found no correlation between t(4;14) and baseline patient features, including β2-microglobin, another group has suggested that t(4;14) detected by FISH correlates with IgA isotype and with a high baseline β2-microglobulin level, suggesting that at least these baseline adverse features may be associated with t(4;14).39 Because data on other chromosomal abnormalities are not yet available for this cohort, we cannot comment on the previously noted associations between t(4;14) and chromosome 13 abnormalities (C13A)22,39 or on the independent prognostic significance of t(4;14) relative to other genetic abnormalities in myeloma. The independent prognostic significance of t(4;14) in a multivariable analysis adjusting for C13A has been noted in one study and suggested in another.22 37
The finding that t(4;14) is associated with poor survival is robust. One strength of our study is that it is population based; hence, the cohort is representative of all patients who sought treatment at the myeloma clinics in our region, lending generalizability to our results. However, our clinical data were collected retrospectively and were, therefore, subject to some limitations. In particular, the availability of data on some baseline clinical features and response to therapy was limited. The prognostic impact of t(4;14) in specific patient subgroups, in particular the impact of t(4;14) on response to therapy, must be confirmed in large prospective studies. We are also limited because the t(4;14) status was not determined at the time of diagnosis for all patients. Thus we have assumed, based on the available evidence, that t(4;14) status does not change from the time of diagnosis. It is reassuring to note that the prognostic significance of t(4;14) remains even when only those patients for whom t(4;14) status is known at diagnosis are considered.
The results are clearly applicable to patients treated with conventional chemotherapy, who comprise most of the cohort studied here. Although our subgroup of patients who underwent transplantation was too small to evaluate separately, we were able to adjust for transplantation status in a Cox model. One group22 has used FISH to demonstrate the adverse prognostic impact of t(4;14) in a group of patients treated with autologous transplantation.
The dysregulation of FGFR3 expression is proposed to be the oncogenic event arising from t(4;14).15 We determined the expression of FGFR3 in the t(4;14)+ patients by RT-PCR and found only 23 of 31 (74%) had detectable levels of FGFR3 expression. Although only 8 t(4;14)+ patients lacked detectable FGFR3 expression, their survival was significantly reduced compared with t(4;14)− patients (P = .003). These results raise questions regarding the status of FGFR3 as the major target gene of t(4;14). This same phenomenon was seen by Nakazawa et al,38 who found 6 of 7 (85%) of their t(4;14)+ patients, as detected by double-color FISH, expressed FGFR3. Furthermore, all FGFR3 nonexpressors lacked a detectable der(14) chromosome, suggesting the lack of FGFR3 expression may be caused by a loss of der(14) or a transcriptional block that inhibits the transcription of FGFR3 and hybrid MMSET-IgH transcripts originating from MMSET exon 1. The fact that a large number of FGFR3-expressing MB4-1 patients do not have detectable der(14) products is likely the result of breakpoints occurring in the approximately 63-kb region between FGFR3 and MMSET exon 1 in which case exon 1 remains on der(4). One FGFR3-expressing MB4-2 patient did not have detectable der(14), possibly because of a looping out of sequence between MMSET exon 1 and exon 4, a switch event involving IgE, or a breakpoint on chromosome 14 within the coding region of a constant region. Similarly, the FGFR3-expressing MB4-2 MM cell line NCI-H929 does not have a detectable der(14) with this assay.17
Longitudinal analysis of BM samples from 53 MM patients, 9 of whom were t(4;14)+, did not reveal any change in t(4;14) status over the course of disease, nor did the FGFR3 expression change. Therefore, t(4;14) does not appear to be a progression event after clinical diagnosis, nor is the translocation lost during clonal evolution in this cohort of patients. IgH-MMSET hybrid transcripts, detected in the PB, appear to fluctuate over the course of disease, as does FGFR3 expression. Unexpectedly, in longitudinal analysis, IgH-MMSET transcripts do not always correlate with FGFR3 transcripts. This suggests that the level of FGFR3 expression varies over time and between patients. Even the t(4;14)+ MM cell lines have obvious differences in FGFR3 expression. For instance, FGFR3 expression is easily detected by Northern blot analysis in KMS-11 and OPM2, whereas it is barely detectable in NCI-H929 and is not detectable in JIM3.15
Neither IgH-MMSET nor FGFR3 transcripts were consistently present in PB at times when CDR2-CDR3 transcripts were readily detectable, suggesting that transcription from the derivative chromosomes is less efficient than transcription of the IgH locus on the functionally rearranged chromosome. IgH-MMSET and FGFR3 transcripts are lost during periods of response to treatment, even though CDR2-CDR3 transcripts often persist. As relapse begins, defined by increasing M protein, CDR2-CDR3 transcripts emerge considerably earlier in disease progression than the translocation-derived transcripts, suggesting that in malignant cells these abnormally regulated putative oncogenes may be more responsive to clinical intervention than the normally regulated, functionally rearranged IgH locus. This raises the possibility that the abnormalities underlying the adverse prognostic significance of the t(4;14) translocation have yet to be identified and that they may be multifactorial.
The region of chromosome 4 involved in t(4;14) is a conserved gene cluster found at 8p11, 10q26, 4p16, and 5q35, marked by FGFR1, FGFR2, FGFR3, and FGFR4, respectively. This gene cluster includesTACC gene family members, which are numerated similarly to the FGFR genes, with TACC1, TACC2, and TACC3 located on 8p11, 10q26, and 4p16, respectively. The other major member of the gene cluster is the NR-binding SET domain-containing (NSD) family of proteins with NSD1, WHSC1/MMSET/NSD2, and NSD3/WHSC1L1 located at 5q35, 4p16, and 8p11, respectively. Both TACC3 and MMSET have been implicated as potential contributors in the pathology of t(4;14).17,41 MMSET is thought to be overexpressed by the Eμ intronic enhancer and by hybrid IgH-MMSET transcripts. A transcript initiating within intron 11 of MMSET, known as response element II binding protein (RE-IIBP), has been described and may also be dysregulated by the intronic enhancer.42 The consequences of MMSET and RE-IIBP dysregulation are unknown. MMSET type 2 transcripts contain the 4 PHD fingers and SET domain that are likely involved in the epigenetic regulation of transcription, whereas the N-terminal truncated RE-IIBP contains the last 2 PHD fingers and SET domain. RE-IIBP has already been shown to be a corepressor of interleukin 5.42 The MMSET homologues NSD1 and NSD3 are involved in t(5;11)(q35;p15) and t(8;11)(p11;p15) in acute myelocytic leukemia, where the N-terminus of NUP98 is fused to the c-terminal PHD fingers and the SET domain of NSD1 and NSD3.43,44 TACC3 belongs to a family of proteins that bind microtubules, concentrate to centrosomes, and play a role in organizing centrosomal microtubules.45-47 The centrosome, or microtubule-organizing center, is vital to the formation and stability of the mitotic spindle and, consequently, chromosomal segregation. Centrosomal dysregulation characterizes all malignancies analyzed to date48; furthermore, overexpression of pericentrin, a centrosomal protein, induces spindle defects, centrosomal abnormalities, genomic instability, and increased growth in soft agar.49 TACC1 overexpression transforms mouse fibroblast, and TACC3 expression is up-regulated in multiple cancer-derived cell lines.41,50 Like pericentrin, dysregulation of TACC3 by the strong 3′ enhancer could influence centrosomal and mitotic spindle dynamics, potentially resulting in genomic instability. Moreover, TACC3 interfaces with p53-regulated apoptosis in hematopoietic stem cells51; thus, the dysregulation of TACC3 expression may modulate myeloma chromosomal instability and survival. Although FGFR3 alone does not impact survival, it may still act in concert with TACC3 and MMSET. Therefore, the combined impact of FGFR3, MMSET, and TACC3 dysregulation by t(4;14) could influence cell-cycle control, epigenetic regulation of transcription, myeloma survival, and mitotic events leading to genomic instability. In some patients this cascade of events may lead to the loss of der(14) once any selective bias is overcome. Alternatively, the true target of t(4;14) may be MMSET, which is supported by the involvement of MLL, NSD1, and NSD3 in various leukemias, or other genes flanking the breakpoints on 4p16 such as LETM1.
In summary, we have shown the frequency of t(4;14) to be 14.9% in our MM cohort. The translocation predicts for poor survival and poor response to chemotherapy. The expression of FGFR3, the proposed target gene, is only detected in 74% of patients and does not appear to influence survival. Future studies will have to address the influence of FGFR3, MMSET, and TACC3 alone and in combination, on the malignant clone of t(4;14)+ MM patients.
We thank Karen Seeberger for her enthusiasm and significant contribution in the preliminary stages of this project. We also thank Jennifer Szydlowski, Darlene Paine, and Samuel Johnson for their skilled assistance in sample preparation and screening.
Prepublished online as Blood First Edition Paper, October 3, 2002; DOI 10.1182/blood-2002- 06-1675.
Supported by a Canadian Institutes of Health Research Doctoral Research Award (J.J.K.), an Alberta Heritage Foundation for Medical Research Studentship (J.J.K., C.A.M.), a Natural Sciences and Engineering Research Council of Canada Studentship (C.A.M.), and a Department of Oncology PhD Endowed Studentship (C.A.M.). Research funding provided by National Institutes of Health grant ROI-CA80963 (L.M.P., A.R.B.).
The publication costs of this article were defrayed in part by page charge payment. Therefore, and solely to indicate this fact, this article is hereby marked “advertisement” in accordance with 18 U.S.C. section 1734.
References
Author notes
Linda M. Pilarski, Department of Oncology, University of Alberta and Cross Cancer Institute, 11560 University Ave, Edmonton, Alberta, T6G 1Z2, Canada; e-mail:lpilarsk@gpu.srv.ualberta.ca.

