Human platelets are anucleate blood cells that retain cytoplasmic mRNA and maintain functionally intact protein translational capabilities. We have adapted complementary techniques of microarray and serial analysis of gene expression (SAGE) for genetic profiling of highly purified human blood platelets. Microarray analysis using the Affymetrix HG-U95Av2 approximately 12 600-probe set maximally identified the expression of 2147 (range, 13%-17%) platelet-expressed transcripts, with approximately 22% collectively involved in metabolism and receptor/signaling, and an overrepresentation of genes with unassigned function (32%). In contrast, a modified SAGE protocol using the Type IIS restriction enzyme MmeI (generating 21–base pair [bp] or 22-bp tags) demonstrated that 89% of tags represented mitochondrial (mt) transcripts (enriched in 16S and 12S ribosomal RNAs), presumably related to persistent mt-transcription in the absence of nuclear-derived transcripts. The frequency of non-mt SAGE tags paralleled average difference values (relative expression) for the most “abundant” transcripts as determined by microarray analysis, establishing the concordance of both techniques for platelet profiling. Quantitative reverse transcription-polymerase chain reaction (PCR) confirmed the highest frequency of mt-derived transcripts, along with the mRNAs for neurogranin (NGN, a protein kinase C substrate) and the complement lysis inhibitor clusterin among the top 5 most abundant transcripts. For confirmatory characterization, immunoblots and flow cytometric analyses were performed, establishing abundant cell-surface expression of clusterin and intracellular expression of NGN. These observations demonstrate a strong correlation between high transcript abundance and protein expression, and they establish the validity of transcript analysis as a tool for identifying novel platelet proteins that may regulate normal and pathologic platelet (and/or megakaryocyte) functions.
Introduction
Human blood platelets play critical roles in normal hemostatic processes and pathologic conditions such as thrombosis, vascular remodeling, inflammation, and wound repair. Generated as cytoplasmic buds from precursor bone marrow megakaryocytes, platelets are anucleate and lack nuclear DNA, although they retain megakaryocyte-derived mRNAs.1,2 Platelets contain rough endoplasmic reticulum and polyribosomes, and they retain the ability for protein biosynthesis from cytoplasmic mRNA.3 Quiescent platelets generally display minimal translational activity, although newly formed platelets such as those found in patients with immune thrombocytopenic purpura (ITP) synthesize various α-granule and membrane glycoproteins (GPs), including GPIb and GPIIb/IIIa (αIIbβ3). Furthermore, stimulation of quiescent platelets by agonists such as α-thrombin increases protein synthesis of various platelet proteins, including Bcl-3.4Like nucleated cells, the rapid translation of preexisting mRNAs may be regulated by integrin ligation to extracellular matrices.5In the case of platelets, the primary integrin involved in this process appears to be αIIbβ3 with cooperative signals mediated by the collagen receptor α2β1.6,7 Integrin-mediated platelet protein synthesis appears to be regulated at the level of translation initiation involving the eukaryotic initiation factor 4E (eIF4E). Instead of directly influencing eIF4E activity via posttranslational modifications (ie, phosphorylation), platelet eIF4E activity best correlates with its spatial redistribution to the mRNA-enriched cytoskeleton.8 Furthermore, because protein translation is partially inhibited by the immunosuppressant rapamycin, it suggests that adhesion- and/or aggregation-induced outside-in-signaling function to regulate protein synthesis through the mTOR (mammalian target of rapamycin) pathway.6,8 9
Despite the biologic importance of platelets and their intact protein synthetic capabilities, remarkably little is known about platelet mRNAs. Younger platelets contain larger amounts of mRNA with a greater capacity for protein synthesis, as determined by using fluorescent nucleic acid dyes such as thiazole orange.10 This assay has been used as a quantitative determinant of younger or “reticulated” platelets (RPs). Indeed increased reticulated platelets are typically found in patients with conditions associated with rapid platelet turnover such as ITP; typically RP percentages in such patients approach 10% to 20% of all platelets, considerably higher than in healthy control subjects.11 Interestingly, high RPs have been associated with enhanced thrombotic risk when identified in patients with thrombocytosis,10 suggesting that quantitatively increased mRNA levels may be associated with the prothrombotic phenotype. Whether this is related to globally altered gene expression profiles or to select changes more evident during situations of rapid platelet turnover remains unknown. Certainly, technical limitations of this assay limit its utility in defining prothrombotic genotypes,10-12 and it cannot identify differentially expressed genes that may be causally implicated in disordered platelet phenotypes.
Toward the goal of defining the molecular anatomy of the platelet genome, we have adapted complementary techniques of microarray and serial analysis of gene expression (SAGE) for genetic profiling of highly purified human blood platelets. Microarray technology represents a “closed” profiling strategy limited by the target genes imprinted onto gene chips. In contrast, SAGE is an “open” architectural system that can be used to identify novel genes and to quantify differentially expressed mRNAs.13-15 The sequence of each tag along with its positional location uniquely identifies the gene from which it is derived, and differentially expressed genes can be identified in a quantitative manner because the tag frequency reflects the mRNA level at the time of cellular harvest and analysis. By using both technologies, we have identified a number of previously uncharacterized genes that appear to be expressed in human platelets, while simultaneously establishing the dominant frequency of mitochondrial-expressed genomes comprising the platelet mRNA pool. These observations provide a panoramic overview of the platelet transcriptome, while additionally providing insights into the molecular pathways regulating platelet (and/or megakaryocyte) function in normal and pathologic conditions.
Materials and methods
Reagents and supplies
Thermus aquaticus (Taq) polymerase was purchased from (Roche, Indianapolis, IN), T4 DNA ligase was purchased from Invitrogen (Carlsbad, CA), and restriction enzymes were from New England Biolabs (Beverly, MA), except for MmeI, which was obtained from the Center for Technology Transfer (Gdansk, Poland). All oligonucleotides were synthesized on an Applied Biosystems (Foster City, CA) 3-channel synthesizer and are listed in Table 1. Monoclonal antibodies used for flow cytometric analysis included the FITC (fluorescein isothiocyanate)–conjugated anti-CD41 (αIIBβ3) immunoglobulin G1 (IgG1; Immunotech, Miami, FL); phycoerythrin (PE)–conjugated antiglycophorin (IgG2; Becton Dickinson Pharmingen, San Diego, CA); and peridinin chlorophyll protein (PERCP)–conjugated anti-CD45 (IgG1; Becton Dickinson Pharmingen).
Platelet isolation, purification, and immunodetection
All human subjects provided informed consent for an IRB (Institutional Review Board)–approved protocol completed in conjunction with the General Clinical Research Center at Stony Brook University Hospital. Peripheral blood (20 mL) from healthy volunteers drawn into 2 mL of 4% sodium citrate (0.4% vol/vol final concentration) was used to isolate erythrocytes by differential centrifugation (1500g) or to isolate pure leukocytes by density-gradient centrifugation as previously described.16Platelets collected from healthy volunteers by apheresis were used within 24 hours of collection. After addition of 2 mM EDTA (ethylenediaminetetraacetic acid), apheresis-derived platelets from a single donor were centrifuged at 140g for 15 minutes at 25°C. To minimize leukocyte contamination, only the upper 9/10 of the platelet-rich plasma (PRP) was used for gel filtration over a BioGel A50M column (1000 mL total volume) equilibrated with HBMT (HEPES-buffered modified Tyrodes buffer: 10 mM HEPES (N-2-hydroxyethylpiperazine-N′-2-ethanesulfonic acid) pH 7.4, 150 mM NaCl, 2.5 mM KCl, 0.3 mM NaH2PO4, 12 mM NaHCO3, 0.2% bovine serum albumen [BSA], 0.1% glucose, 2 mM EDTA). Gel-filtered platelets (GFPs) were subsequently filtered through a 5-μm nonwetting nylon filament filter (BioDesign, Carmel, NY) at 25°C and harvested by centrifugation at 1500g for 10 minutes at 25°C. Platelets were gently and thoroughly resuspended in 10 mL HBMT buffer and incubated with 120 μL murine monoclonal anti-CD45 antibody conjugated to magnetic microbeads (Miltenyi Biotec, Bergisch Gladbach, Germany) on a rotating platform for 45 minutes at 25°C. Magnetic separation columns were used to capture CD45+ cells (leukocyte fraction) by positive selection (MACS II; Miltenyi Biotec). Purified platelets were concentrated by centrifugation at 1500g and immediately used for total RNA isolation.
The efficiency of platelet purification was documented at each step by flow cytometry.17 Briefly, aliquots containing 2 × 10⁶ platelets were incubated with saturating concentrations of FITC-conjugated anti-CD41, PE-conjugated antiglycophorin, and PERCP-conjugated anti-CD45 for 15 minutes in the dark at 25°C, washed with phosphate-buffered saline (PBS), and fixed in PBS/1% formalin. Samples were analyzed using a FACScan (fluorescence-activated cell sorter scan) flow cytometer (Becton Dickinson) using CELLQuest software designed to quantify the number of CD45+ and glycophorin-positive events in the sample (expressed as the number of events per 100 000 CD41+events). For some experiments, fixed platelets were permeabilized with 0.1% Triton-X/PBS for 30 minutes at 25°C prior to the addition of primary antibodies, all as previously described.17
Platelet protein detection was completed by sodium dodecyl sulfate (SDS)–polyacrylamide gel electrophoresis (PAGE) and immunoblot analysis as previously described, using the species-specific horseradish peroxidase-conjugated secondary antibody and enhanced chemiluminescence.16 Antibodies included the anticlusterin monoclonal antibody (Quidel, Santa Clara, CA; 1:1000 primary and 1:10 000 secondary) and the antineurogranin rabbit polyclonal antibody (Chemicon International, Temecula, CA; 1:1000 primary and 1:10 000 secondary).
Molecular analyses and microarray profiling
Purified, individual cell fractions were resuspended in 10 mL Trizol reagent (Invitrogen), transferred into diethylpyrocarbonate (DEPC)–treated Corex (Springfield, MA) tubes, and serially purified and precipitated by using isopropanol essentially as previously described.16 Total cellular RNA was harvested by centrifugation at 12 500g for 20 minutes at 4°C, washed 2 times with 75% ethanol (10 mL/tube), and resuspended in 100 μL DEPC-treated water. Platelet mRNA quantitation was performed by using fluorescence-based real-time PCR (polymerase chain reaction) technology (TaqMan Real-Time PCR; Applied Biosystems, Foster City, CA). Oligonucleotide primer pairs were generated by using Primer3 software (www-genome.wi.mit.edu), designed to generate approximately 200–base pair (bp) PCR products at the same annealing temperature, and are outlined in Table 1. Purified platelet mRNA (4 μg) was used for first-strand cDNA synthesis using oligo(dT) and SuperScript II reverse transcriptase (Invitrogen). For real-time reverse transcription (RT)–PCR analysis, the RT reaction was equally divided among primer pairs and used in a 40-cycle PCR reaction for each target gene by using the following cycle: 94°C for 30 seconds, 55°C for 30 seconds, 72°C for 1 minute, and 71°C for 10 seconds (40 cycles total). mRNA levels were quantified by monitoring real-time fluorometric intensity of SYBR green I. Relative mRNA abundance was determined from triplicate assays performed in parallel for each primer pair and was calculated by using the comparative threshold cycle number (Δ-Ct method) as previously described.18
Gene expression profiles were completed by using the approximately 12 600-probe set HG-U95Av2 gene chip (Affymetrix, Santa Clara, CA). Total cellular RNA (5 μg) was used for cDNA synthesis by using SuperScript Choice system (Life Technologies, Rockville, MD) and an oligo(dT) primer containing the T7 polymerase recognition sequence (Primer S1; Table 1), followed by cDNA purification using GFX spin columns. In vitro transcription was completed in the presence of biotinylated ribonucleotides by using a BioArray HighYield RNA Transcript Labeling Kit (Enzo Diagnostics, Farmingdale, NY), and, after metal-induced fragmentation, 15 μg biotinylated cRNA was hybridized to the HG-U95Av2 oligonucleotide probe array for 16 hours at 45°C. After washing, the cRNA was detected with streptavidin-phycoerythrin (Molecular Probes, Eugene, OR) and analysis was completed by using a Hewlett-Packard Gene Array Scanner (Affymetrix). The average difference value (AD) for each probe set was quantified using MAS 4.01 software (Affymetrix), calculated as an average of fluorescence differences for perfectly matched versus single-nucleotide mismatched 25-mer oligonucleotides (16 to 20 oligonucleotide pairs per probe set). The software is designed to exclude “positive calls” in the presence of high average differences with associated high mismatch intensities.
SAGE profiles
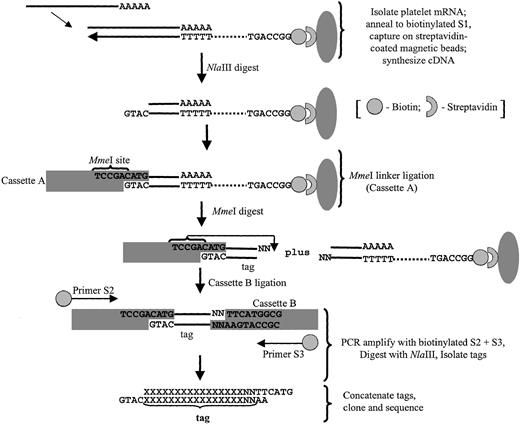
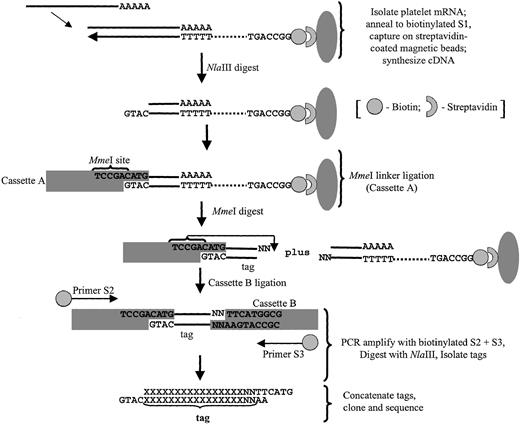
Platelet SAGE libraries were generated essentially as previously described,13 modified as outlined in Figure1 for the use of MmeI as the tagging enzyme.19 This type IIS restriction enzyme cleaves 20 of 18 bp past its nonpalindromic (TCCRAC) recognition sequence, thereby generating longer tags (21- or 22-mer) than those obtained using BsmFI as the standard tagging enzyme (13-14 bp tags). These longer MmeI-generated tags potentially provide for more definitive “tag-to-gene” identification and are particularly useful in characterizing expression patterns in the absence of complete genomic sequence data (comprehensive methods detailed in Dunn et al19). Briefly, poly(A) mRNA was isolated from 10 μg total platelet RNA using the oligo-(dT) S1 primer conjugated to magnetic beads (Dynal Biotech, Lake Success, NY), followed by cDNA synthesis using SuperScript II reverse transcriptase (Invitrogen). The cDNA was then digested with the restriction enzyme NlaIII (anchoring enzyme), ligated to cassette A using T4 DNA ligase, and, after the beads were extensively washed, the cDNA was digested with MmeI to release the tags from the beads. After purification, tags were ligated to degenerate cassette B linkers (specifically designed to anneal to the nonuniform MmeI overhangs), and PCR-amplified using biotinylated primers S2 and S3 for 30 cycles (95°C for 30 seconds; 58°C for 30 seconds; 72°C for 30 seconds) using Platinum Taq DNA polymerase (Gibco BRL). A fraction (20%) of the pooled PCR products were then subjected to one round of linear amplification using primer pair S2/S3, followed by a second round of 25 amplifications using primer S2 alone (95°C for 30 seconds, 58°C for 30 seconds, 72°C for 30 seconds). Primer S3 was subsequently added for one cycle (95°C for 2.5 minutes, 58°C for 30 seconds, 72°C for 5 minutes); the latter steps were collectively adapted to exclude heteroduplex formation.18Unincorporated primers were removed by incubation with 200 UEscherichia coli exonuclease I for 60 minutes at 37°C. PCR products were then pooled and digested with NlaIII to release tags, and biotinylated linker arms were cleared using streptavidin-coated immunoaffinity magnetic beads (Dynal Biotech). Tags were concatamerized using 5 U/μL T4 DNA ligase, and products more than 100 bp were isolated by size-fractionation in low-melting agarose gels. The DNA was purified by GFX spin columns, and the concatamers were cloned into the SphI site of pZero (Invitrogen). After transformation into E coli TOP10 cells, recombinant clones were isolated and sequenced in 96-well microtiter plates using an ABI 377 sequencer and ABI Prism BigDye terminator chemistry (Perkin-Elmer Applied Biosystems, Branchburg, NJ).
Schema outlining the modified SAGE protocol used in platelet analyses.
The final tags are flanked by the NlaIII (anchoring enzyme) CATG sequence, thereby providing tag-to-gene identification when exported to a relational database (refer to “Bioinformatic analyses” and Table 1 for details).
Schema outlining the modified SAGE protocol used in platelet analyses.
The final tags are flanked by the NlaIII (anchoring enzyme) CATG sequence, thereby providing tag-to-gene identification when exported to a relational database (refer to “Bioinformatic analyses” and Table 1 for details).
Bioinformatic analyses
Functional grouping of genes determined to be present by Affymetrix MAS 4.01 software was performed using a dChip program linked to the National Center for Biotechnology LocusLink, which is an annotated reference database for genes and their postulated functions.20 Of the approximately 12 600-probe sets represented on the Affymetrix HG-U95Av2 Gene chip, functional annotations exist for approximately 8100 with the remainder categorized as unknown. Microarray data were visualized and analyzed using BRB-ArrayTools software (Version 2.1), kindly developed and provided by Dr Richard Simon and Amy Peng (linus.nci.nih.gov/BRB-ArrayTools.html). A logarithmic (base 2) transformation was applied to the average difference values for individual data sets for determination of microarray concordancies. Discordancy was defined as a 2-log difference in the maximum log intensities between individual experiments.
SAGE tags were extracted by using in-house SAGE software uniquely modified to identify MmeI tags. The software ensures that only unambiguous 21- to 22-bp tag sequences are extracted for transcript profiling. Tags with ambiguities (Ns), lengths other than 21 or 22 bp, or with ambiguous orientations were extracted to separate files for manual editing or further examination. Finalized data were exported to a relational database for tag quantification and genetic identification.20
Results
Platelet purification
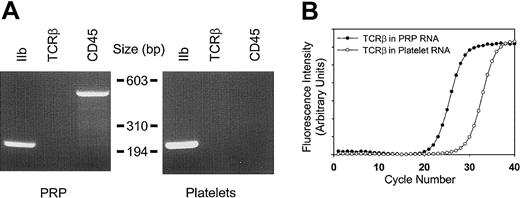
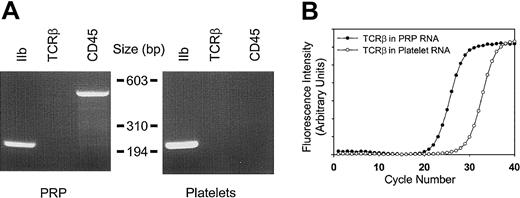
To ensure that the RNA profiles accurately represented those of circulating blood platelets, a number of complementary methods were implemented to remove contaminating nucleated leukocytes. Purification methods incorporating gel filtration, a 5-μm leukocyte reduction filter, and magnetic CD45 immunodepletion allowed for the cumulative enrichment of highly purified platelets. The efficacy of this purification method was initially established by using peripheral blood platelet-rich plasma as the starting material. The final product contained no more than 3 to 5 leukocytes per 1×10⁵ platelets as determined by parallel flow cytometric analysis, representing an approximate 450-fold reduction of nucleated leukocytes. These results correlated well with molecular evidence for leukocyte depletion as determined by RT-PCR using both CD45 and T-cell receptor β-chain (TCRβ) primers (see Figure 2). Because the total RNA yield from peripheral blood platelets was insufficient for microarray studies, we adapted the protocol to platelet apheresis donors with nearly identical final purity (Figure 2). The platelet recovery was nearly 65% of the starting material, yielding approximately 2.3 × 10¹¹ platelets from an initial apheresis pack containing approximately 3.6 × 10¹¹ platelets. The bulk of the losses occurred during the initial centrifugation and filtration steps. The purification protocol was less effective at removing erythrocytes, although there were less than 50 glycophorin-positive cells per 1 × 10⁵ platelets after the final purification step. Nonetheless, these cells represent unlikely sources for contaminating cellular RNA (see “Cellular microarray analysis” below).
Determination of platelet purity.
(A) Total cellular RNA (1.8 μg) from platelet-rich plasma (PRP) or purified platelets from a single apheresis donor were analyzed by RT-PCR (35 cycles) using oligonucleotide primers specific for glycoprotein IIb (GPIIb), T-cell receptor β-chain (TCRβ), or CD45; 10 μL of the 50 μL reactions were analyzed by ethidium-stained agarose gel electrophoresis. Minimal to no TCRβ gene product was visually evident only in PRP. Size markers corresponding toHaeIII-restricted φX174 DNA are shown. (B) Real-time RT-PCR was completed by using 1.8 μg total RNA and TCRβ-specific oligonucleotide primers optimized for quantitative analysis by real-time PCR.18 On the basis of parallel determinations using RNA isolated from known amounts of purified leukocyte standards, the leukocyte-depletion protocol represents an approximate 2.5-log purification from the starting PRP. Results are representative of one complete set of experiments repeated on 2 separate occasions, and data points represent the mean from triplicate wells, with standard errors of the mean (SEM) less than 1% (not shown).
Cellular microarray analysis
The purified platelet RNA was sufficient for microarray studies and was used for cRNA generation and hybridization to the Affymetrix HG-U95Av2 GeneChip. The anatomic profile of platelet RNAs from 3 healthy male donors was determined by using Affymetrix software. Of the 12 599 probe sets imprinted onto the chip, a maximum of 2147 (17%) transcripts were computationally identified as “present” by the Affymetrix software, 152 (1.2%) were equivocal, and nearly 82% were absent. As a fraction of the total genes present on the chip, the percentage of platelet-expressed genes (15%-17%) was generally lower than that obtained from other human cell types in which 30% to 50% of genes are present as determined by Affymetrix software (J. Schwedes, personal communication, May 2002). The “limited number” of platelet-expressed transcripts presumably reflects the lack of ongoing gene transcription in the anucleate platelet. Because less than 1% of circulating red blood cells contain residual RNA, it is unlikely that any of these transcripts are erythrocyte derived, although this was formally addressed by isolating total cellular RNA from 20 mL of whole blood (corresponding to an ∼3-log fold excess of erythrocytes than that identified in our final sample). The total cellular yield of RNA from this starting material was approximately 250 ng, suggesting that less than 1 ng erythrocyte-derived RNA was present in the purified platelet preparations. Despite this, however, both α- and β-globin transcripts—along with both the ferritin heavy and light chains—were identified as abundant transcripts (Table2). Although the most parsimonious explanation would be residual contaminating reticulocytes, this is not supported by our erythrocyte contamination estimates, and their significance remains unresolved.
As a means of better dissecting the molecular anatomy of the platelet, expressed genes were grouped on the basis of assigned gene annotations, and this analysis was used to provide a panoramic definition of the platelet transcriptome. Of the genes that could be cataloged within assigned “clusters,” those involved in metabolism (11%) and receptor/signaling (11%) represented the largest groups. Also evident in these analyses is the relatively large percentage of genes involved in functions unrelated to these key groups (ie, miscellaneous, 25%), and the overrepresentation of genes with unknown function (32%) as annotated by Affymetrix and RefSeq databases.21 These results identify a vast array (nearly one half) of platelet genes (and gene products) that presumably have important, but poorly characterized functions, in platelet and/or megakaryocyte biology.
Although microarray analysis is not truly quantitative, rank-ordering using the mean log-intensities from 3 independent microarray analyses allowed for the categorization of the top platelet transcripts (Table2). Computational analyses demonstrated that only 10 of the top 100 genes were discordant among the 3 platelet microarrays, although 71 of 100 genes were discordant between platelet and leukocyte arrays. An inventory of the top 50 platelet genes is listed in Table 2, which also delineates those found to be highly expressed in peripheral blood leukocytes by parallel microarray experiments with this purified cellular fraction (data not shown). Further analysis of these cell subsets demonstrated that approximately 25% (n = 547) of the total platelet transcripts were platelet restricted. Furthermore, only 10 of the 50 most highly expressed genes were found to overlap, confirming the distinct cellular profiles of each transcriptome. Of the 12 overlap genes, 3 corresponded to globin or ferritin chains (again suggesting the presence of contaminating reticulocytes in both purified fractions), and another 4 were involved in actin cytoskeletal reorganization and human leukocyte antigen (HLA) expression, gene products that regulate critical functions in both cell types. Given the importance of cytoskeletal reorganization in downstream platelet activation events, it is not unexpected that components of the actin machinery system would demonstrate prominent transcript expression. Previous estimates suggest that 20% to 30% of the total platelet proteome is comprised of actin with other components such as actin-binding protein, mysosin, and talin accounting for an additional 2% to 5% of the total protein.1,22 The mRNAs encoding the actin-related machinery are overrepresented in our microarray analysis, with 8 such transcripts found among the 50 highest platelet-expressed genes. Interestingly thymosin β4 demonstrated the highest expression pattern. In unstimulated platelets, 30% to 40% of actin is polymerized as F-actin,22 whereas the balance of actin monomers (G-actin) are polymerization inhibited by sequestering proteins such as profilin (100 μM) and thymosin β4 (600 μM).23 The high thymosin β4 transcript expression not only correlates with its known abundance in platelets but also supports the importance of actin inhibitory proteins in maintaining the nonstimulated state of circulating platelets.
Platelet SAGE analyses
Although these initial studies identified the distribution and relative expression patterns of the genes within the Affymetrix data set, they do not allow for analyses of genes that are unrepresented by these oligonucleotide chips. Unlike closed microarray profiling strategies, SAGE is an open architectural system that is ideally suited for novel gene and pathway identification. Accordingly, the platelet RNA used for microarray studies was used for platelet SAGE. A total of 2033 tags were initially cataloged, of which 1800 (89%) corresponded to mitochondrial-derived genes. These results were quite different from those obtained by microarray analyses, but the discrepancy can be resolved by the nonrepresentation of the mitochondrial genome on the gene chip. The mitochondrial genome is a compact approximately 16.6-kilobase (kb) sequence encoding 13 genes and 2 ribosomal subunits.24 Primary mitochondrial transcripts are polycistronic and typically contain premature termination or unpredictable splice sites, resulting in multiple polyadenylated transcripts from individual genes.24,25 Indeed, the overall distribution of platelet-derived mitochondrial SAGE tags is quite similar to that found in muscle.25 All 13 genes containing NlaIII sites were detected, whereas neither of the non–NlaIII-containing genes were identified (nicotinamide adenine dinucleotide [NADH] dehydrogenase subunit 4L and adenosine triphosphatase [ATPase] 8). Most of the tags were from the 16S and 12S ribosomal RNAs—which collectively accounted for 68% of the total mitochondrial tags—with the fewest tags represented by NADH dehydrogenase subunits 3, 5, 6, and cytochrome c oxidase 1 (Figure 3). The NADH dehydrogenase subunit 6 RNA is the only mRNA encoded by the light (L) strand of mitochondrial DNA and was the least abundantly detected transcript.
Schema of the mitochondrial genome with SAGE tag distributions (only tags with identical matches are displayed).
The abundance of the SAGE tags (n = 1800) at individualNlaIII sites (arrows) within the mitochondrial heavy strand is shown on the bottom, whereas those tags corresponding to the mitochondrial light strand are delineated above the arrows (the presence of an unaccompanied arrow implies no SAGE tags at thatNlaIII site). The gene products of mt-DNA (RefSeq accession no. NC_001807) are delineated by the open rectangles, whereas stippled boxes represent tRNA genes and control regions (the single tag represented by the [*] refers to mitochondrial transfer RNA-serine). Note that NADH6 is encoded by the light strand and that there are noNlaIII sites within the ATPase8 gene segment. CO[n], cytochrome c oxidase subunit; Cyt b, cytochrome b.
The unusually high preponderance of mitochondrial-derived genes is not inconsistent with the known enrichment of these genomes in human platelets,1,24 and presumably reflects persistent transcription from the mitochondrial (mt) genome in the absence of nuclear-derived transcripts. This overrepresentation of mtDNA in platelets is considerably greater than that of its closest cell type (skeletal muscle), in which mt genomes represent approximately 20% to 25% of all SAGE tags.25 Interestingly, the energy metabolism of platelets is not dissimilar from that of skeletal muscle, both cell types actively using glycolysis and large amounts of glycogen for ATP generation.26 Like muscle, platelets are metabolically adapted to rapidly expend large amounts of energy required for aggregation, granule release, and clot retraction. Similar to the situation in all eukaryotic cells, platelet mitochondria represent the primary source of ATP, which is generated from oxidative phosphorylation reactions occurring within these organelles. Mitochondria are also responsible for most of the toxic reactive oxygen species generated as by-products of oxidative phosphorylation and are central regulators of the apoptotic process in other cellular types. The mtDNA encodes polypeptides found within 4 of the 5 multifunctional complexes that regulate oxidative phosphorylation within the platelet mitochondria.27 Whether the continued generation of these polypeptides has a role in platelet energy metabolism and/or the apoptotic mechanisms regulating platelet survival remains speculative, although not inconsistent with our observations.
Comparative analysis of SAGE and microarray transcript abundance
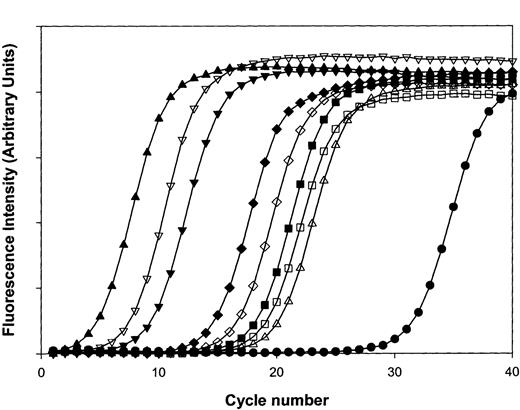
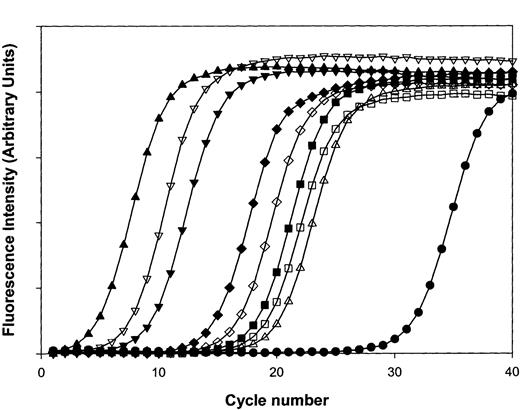
Complete SAGE libraries require the sequencing of up to 30 000 tags for an exhaustive cataloging of individual mRNAs, especially those with limited copy numbers.13,28 Given the preponderance of mt-derived transcripts, comparable sampling would have required sequence analysis of nearly 300 000 SAGE tags, an inordinate number for comprehensive analysis of the platelet transcriptome. For platelets, alternative methodologies incorporating subtractive SAGE will be required for more comprehensive transcript profiling.29 Our initial sampling of nonmitochondrial genes remains informative, however, and entirely consistent with the results of platelet microarray studies. As shown in Table3, SAGE tags for the genes encoding thymosin β4, β2-microglobulin, neurogranin, and the platelet glycoprotein Ibβ polypeptide were among the most frequently identified platelet genes, similar to the rank-ordered results determined by microarray analysis. To formally confirm the results independently obtained by SAGE and microarray analysis, quantitative RT-PCR was completed by using oligonucleotide primers specific for 2 abundant mitochondrial transcripts, 16S rRNA and NADH2 thymosin β4 (high-abundance by microarray and SAGE), 2 incompletely characterized high-abundance transcripts (neurogranin and clusterin; see “Protein immunoanalysis of platelet clusterin and neurogranin”), a low-abundant transcript (T-cell receptor β-polypeptide), and the genes encoding proteins with well-established quantitative determinations (ie, glycoprotein αIIBβ3[∼50 000 receptors/platelet]; protease-activated receptor-1 (PAR1) [∼1800 receptors/platelet]).1 As shown in Figure4, these analyses reveal excellent concordance between SAGE and microarray studies, demonstrating the predominant frequency of the mitochondrial-derived 16S rRNA/NADH2 transcripts, with incrementally lower expression of other transcripts as initially demonstrated by microarray (16S > NADH2 > thymosin β4 > neurogranin > clusterin > αIIBβ3 > PAR1 > TCRβ).
Quantitative real-time RT-PCR analysis of platelet transcripts.
Real-time RT-PCR was completed by using purified platelet RNA and oligonucleotide primer pairs specifically designed using Primer3 software to generate similarly-sized (∼200-bp) PCR products, optimized to the same annealing temperature. In graph, (■) represents IIb, (▪) represents IIIa, (▵) represents PAR1, (▴) represents 16S rRNA, (▿) represents NADH2, (▾) represents thymosin, (⋄) represents clusterin, (♦) represents neurogranin, and (●) represents TCRβ. Curves are representative of one complete set of experiments (repeated twice), and line plots reflect average determinations from 3 wells performed in parallel with SEM less than 1% for all data points.
Given the small number of nonmitochondrial SAGE tags available for analysis (n = 233), limited conclusions can be drawn using traditional (nonsubtraction) platelet SAGE libraries as presented here. Overall, a total of 126 unique tags were identified, the majority of which (94) were represented only once. Of the total unique tags, nearly one half represented novel genes not present on the Affymetrix U95Av2 GeneChip. Of the genes with unique tags identified more than once, there was excellent concordance with microarray expression analysis, with nearly all of the SAGE tags in Table 3 corresponding to platelet top 75 microarray transcripts. The platelet factor (PF) 4 variant represents a single aberration because this was rank-ordered approximately 350 by microarray, although its SAGE tag frequency was identical to that of the predominant PF4 transcript. The lack of extensive nonmitochondrial SAGE sampling precludes any further extrapolations from this apparent aberration. Of note, a subset of these tags had long poly(A) tracts, although they all corresponded to genes identified in the RefSeq database.21 We cannot exclude the possibility of a SAGE artifact for this small subset of tags (∼2%, representing 46 of 2033 tags), although the authenticity of the vast majority of tags (∼98%) clearly validates the methodology. These tags are most likely explained by the unique biology of the platelet (ie, mRNA decay in the absence of de novo transcription) or to mRNA degradation occurring during the extensive purification methods. In summary, even with a remarkably limited sampling, the power of this approach in gene identification of relatively abundant and less abundant transcripts is evident. It is clear, however, given the unique molecular anatomy of the platelet (ie, abundance of mitochondrial transcripts), that SAGE adaptations will be required for more comprehensive genetic profiling.29
Protein immunoanalysis of platelet clusterin and neurogranin
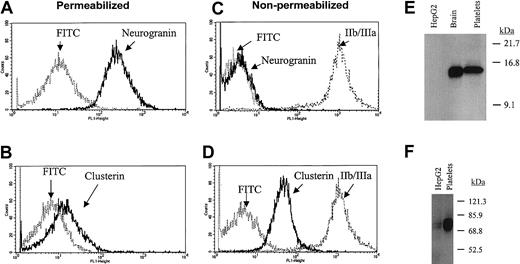
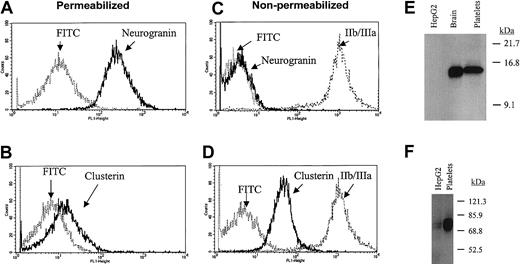
Although most of the “most abundant” transcripts would conform to a priori predictions for platelet-expressed mRNAs, a number of transcripts were identified that had been poorly characterized in human platelets. To further establish the authenticity of highly expressed transcripts such as clusterin and neurogranin, confirmatory protein analyses were completed. As shown in Figure 5, both proteins were clearly detected in purified platelet lysates; furthermore, their cellular platelet distributions conformed to those predicted based on previously proposed functions. Note for example that clusterin—functionally characterized as a complement lysis inhibitor able to block the terminal complement reaction—is primarily expressed on the extracellular platelet membrane.30 Given the importance of complement activation in platelet destruction, the prominent expression of cell-surface clusterin might suggest a role for this protein in normal and pathologic events regulating platelet survival. Interestingly, a clusterin-deficient knockout mouse has been generated that demonstrates enhanced cardiac dysfunction in a model of autoimmune myocarditis.31 Although these mice apparently have normal baseline hemograms (B. Aronow, personal communication, October 2002), it remains unestablished if they would be predisposed to immune-type thrombocytopenia in systemic models of autoimmunity.
Immunoanalysis of platelet neurogranin and clusterin.
(A-D) Gel-filtered platelets were either fixed in 3.7% formaldehyde (nonpermeabilized) or fixed with permeabilization in the presence of 0.1% Triton-X, followed by flow cytometric analysis using anticlusterin, anti-IIb/IIIa, or antineurogranin antibodies and the FITC-conjugated species-specific secondary antibody (in C, the FITC-conjugated antirabbit and antimouse controls are essentially superimposed). (E-F) Ten micrograms of solubilized HepG2 cells (hepatocyte cell line), human brain, or purified platelet lysates were analyzed by SDS-PAGE,17 and immunoblot analysis were completed by using 1:1000 dilutions of either antineurogranin (18% SDS-PAGE) or anticlusterin (8% SDS-PAGE) antibodies. The anticlusterin antibody recognized 2 platelet immunoreactive species under shorter exposure. Although the relative neurogranin and clusterin protein abundances are suboptimally quantified by these analyses, platelet clusterin appears to demonstrate considerable expression when compared with that previously identified in hepatocytes.31
Similarly, the gene encoding an intracellular effector protein that may have key roles in downstream platelet activation events has now been demonstrated to have abundant transcript expression in human platelets. Neurogranin is a highly expressed platelet transcript with its gene product demonstrating a primarily intracellular pattern of distribution. Neurogranin is generally described as a brain-specific, Ca2+-sensitive calmodulin-binding phosphoprotein that is preferentially expressed in neuronal cell bodies and dendrites.32,33 It is a specific protein kinase C (PKC) substrate that can also be modified by nitric oxide and other oxidants to form intramolecular disulfide bonds. Both its phosphorylation and oxidation state attenuate its binding affinity for calmodulin.33 In stimulated platelets, PKC generation is linked to various activation pathways such as calcium-regulated kinases, mitogen-activated protein (MAP) kinases, and receptor tyrosine kinases.1 Thus, these observations suggest that platelet neurogranin may function as a previously unidentified component of a PKC-dependent activation pathway coupled to one (or more) of these effector proteins.
Discussion
These data provide documentation for a unique platelet mRNA profile that may provide a tool for analyzing platelet molecular networks. Nonetheless, the molecular analysis of the platelet transcriptome may be confounded by the constant decay of mRNAs in the absence of new gene transcription, a situation that may, for example, limit the identification of low-abundance transcripts. Similarly, because the circulating platelet pool contains a mixed population of variably aged platelets, a “static” mRNA profile represents an average of this heterogeneous blood pool. Despite these potential limitations, the combination of genomic and proteomic technologies are likely to provide powerful tools for the global analysis of platelet function. Current strategies for cataloging “whole cellular proteomes” are generally accomplished by using 2 developing methodologies: (1) high resolution 2-dimensional polyacrylamide gel electrophoresis (2-DE) with mass spectrometric sequence identification,34 and (2) microcapillary liquid chromatography with tandem mass spectrometry (μLC-MC/MC).35 Further modifications of both procedures have been devised for direct comparative studies between 2 cellular proteomes. The introduction of 2-DE differential gel electrophoresis has now made it possible to detect and quantify differences between experimental sample pairs resolved on the same 2-dimensional gel.36 Likewise, the application of isotope-coded affinity tags to μLC-MC/MC represent a novel means of quantitative analyses between cellular proteomes.37 The success of both approaches relies on the availability of comprehensive genomic databases and mathematical algorithms for optimal protein identification. Indeed, mathematical modeling studies have demonstrated the need to delineate both protein and mRNA expression levels for optimal definition of intracellular networks.38 Our data present an initial framework for delineating platelet function by defining the molecular anatomy of human platelets, information that is likely to provide important clues into the dynamic protein interactions regulating normal and pathologic platelet functions. Furthermore, because the platelet transcriptome mirrors the mRNAs derived from precursor megakaryocytes, these analyses may provide insights into the biochemical and molecular events regulating megakaryocytopoiesis and/or proplatelet formation.
We thank Dr Maureen Krause, Jean Wainer, and Lesley Scudder for assistance with some of the experiments; John Schwedes (University DNA microarray facility) with the microarray analysis; and Ms Shirley Murray for manuscript preparation.
Prepublished online as Blood First Edition Paper, November 14, 2002; DOI 10.1182/blood-2002-09-2797.
Supported by grants HL49141 and HL53665, by a Veteran's Administration REAP award (W.F.B.), and by National Institutes of Health Center grant MO1 10710-5 to the University Hospital General Clinical Research Center. W.B. is an Established Investigator of the American Heart Association. Studies at Brookhaven National Laboratory were supported by a Laboratory Directed Research and Development award (J.J.D.) and by the Offices of Biological and Environmental Research, and of Basic Energy Sciences (Division of Energy Biosciences) of the US Department of Energy.
The publication costs of this article were defrayed in part by page charge payment. Therefore, and solely to indicate this fact, this article is hereby marked “advertisement” in accordance with 18 U.S.C. section 1734.
References
Author notes
Wadie F. Bahou, Division of Hematology, HSCT15-040, State University of New York at Stony Brook, Stony Brook, NY 11794-8151; e-mail: wbahou@notes.cc.sunysb.edu.

![Fig. 3. Schema of the mitochondrial genome with SAGE tag distributions (only tags with identical matches are displayed). / The abundance of the SAGE tags (n = 1800) at individualNlaIII sites (arrows) within the mitochondrial heavy strand is shown on the bottom, whereas those tags corresponding to the mitochondrial light strand are delineated above the arrows (the presence of an unaccompanied arrow implies no SAGE tags at thatNlaIII site). The gene products of mt-DNA (RefSeq accession no. NC_001807) are delineated by the open rectangles, whereas stippled boxes represent tRNA genes and control regions (the single tag represented by the [*] refers to mitochondrial transfer RNA-serine). Note that NADH6 is encoded by the light strand and that there are noNlaIII sites within the ATPase8 gene segment. CO[n], cytochrome c oxidase subunit; Cyt b, cytochrome b.](https://ash.silverchair-cdn.com/ash/content_public/journal/blood/101/6/10.1182_blood-2002-09-2797/4/m_h80633981003.jpeg?Expires=1769829928&Signature=AsnX3sdVKPemhjKNJDyeUQWGQfPfGI2Dr~UoEgKPnQUngHeo3DKjcKORdiLyNrFQLFxOYTzjNzUzsB4KzJPK3Coz6EwdsigyAWFhrTlQgpDivJLOnBAXnypI2iOH7hiN7fq5fT3kYUUGDFF9vZJxmvyxtqmMS2WhDj4N7L9nnoERBNNW-AKGGJKysDIvgzSzwhxHSO8JP5D0ek44j04dww7xFdnV6XTGHte0FhEuqJIatPJR~Nl0kmY3-oNSgJqMfx~ToFnz0zURwUmZ4ym1pI-Nr3L99QvJOKaYDiAQsSl76NoON5lLpTC1zoQVc7ZyT4eWouDRi2AyYOncd9nxOA__&Key-Pair-Id=APKAIE5G5CRDK6RD3PGA)

![Fig. 3. Schema of the mitochondrial genome with SAGE tag distributions (only tags with identical matches are displayed). / The abundance of the SAGE tags (n = 1800) at individualNlaIII sites (arrows) within the mitochondrial heavy strand is shown on the bottom, whereas those tags corresponding to the mitochondrial light strand are delineated above the arrows (the presence of an unaccompanied arrow implies no SAGE tags at thatNlaIII site). The gene products of mt-DNA (RefSeq accession no. NC_001807) are delineated by the open rectangles, whereas stippled boxes represent tRNA genes and control regions (the single tag represented by the [*] refers to mitochondrial transfer RNA-serine). Note that NADH6 is encoded by the light strand and that there are noNlaIII sites within the ATPase8 gene segment. CO[n], cytochrome c oxidase subunit; Cyt b, cytochrome b.](https://ash.silverchair-cdn.com/ash/content_public/journal/blood/101/6/10.1182_blood-2002-09-2797/4/m_h80633981003.jpeg?Expires=1770546740&Signature=kgjC-51mjfQCtwyNocQjNjmOOWO13x202bPbOVIZzShp-q303gJYKs8D8Oj8MFOmcRAIpjxvs~XQt43UypEcoCdIju2aIr5XsFNxyVRAEKvQD0IYCpcEJrWRKzzV9mw3iqJzIxh~6KsVhVS4Q9N9NFNODjGP1cEgjxg1XAUQsCgYtrK4naaV2HJExrcA~PqC2nc74MQStbQE6j3E559skBr7aQwMPUGorbmJWAoIUU3iR5-dOqrHACuE7iCW~nI1W4Nw2-lv-oZVWQynACArjTA6Wlx4oZAlqbeG-~SMijhDIomBMvVT0TuPiByl22DpgRAgy~FOup9sikmhH70ZNQ__&Key-Pair-Id=APKAIE5G5CRDK6RD3PGA)
