The (12;21) translocation resulting in TEL/AML1 gene fusion is present in about 25% of childhood precursor B-lineage acute lymphoblastic leukemia (ALL) and is associated with a good prognosis and a high cellular sensitivity to l-asparaginase (L-Asp). ALL cells are thought to be sensitive tol-Asp due to lower asparagine synthetase (AS) levels. Resistance to l-Asp may be caused by an elevated cellular level of AS or by the ability of resistant cells to rapidly induce the expression of the AS gene on l-Asp exposure.AS may be a target regulated by t(12;21). We studied the relationship between t(12;21) and the mRNA level of AS to investigate a possible mechanism underlying l-Asp sensitivity. Real-time quantitative reverse transcription–polymerase chain reaction (RT-PCR) analysis surprisingly revealed that 30 patients positive for t(12;21) expressed 5-fold more AS mRNA compared with 17 patients negative for t(12;21) (P = .008) and 11 samples from healthy controls (P = .016). The mRNA levels of AS between t(12;21)− ALL and healthy controls did not differ. No difference was found between ALL patients positive or negative for t(12;21) in the capacity to up-regulate AS after in vitrol-Asp exposure, excluding a defective capacity for t(12;21) cells in up-regulating AS on l-Asp exposure. Moreover, no correlation was observed between AS mRNA expression and sensitivity to l-Asp. We conclude that the sensitivity of t(12;21)+ childhood ALL tol-Asp is not associated with the expression level of theAS gene. Furthermore, we contradict the general thought that leukemic cells specifically lack AS compared with normal bone marrow and blood cells.
Introduction
The t(12;21) occurs in about 25% of childhood acute lymphoblastic leukemia (ALL) and is restricted to precursor B cell–lineage leukemia. The t(12;21) involves fusion of theTEL(ETV6) gene at 12p13 with the AML1(RUNX1) gene at 21q22. The TEL gene is a member of the Ets family of transcription factors and functions as a sequence-specific DNA-binding transcription regulator.1 AML1 encodes a transcription factor that binds the enhancer core sequence, TGTGGT.2 The DNA-binding affinity of AML1 is increased through heterodimerization with the core-binding factor (CBF) β protein, forming the CBF. This complex regulates the transcription of numerous genes involved in hematopoiesis.
t(12;21)+ ALL has a relatively favorable outcome,3-9 which might be related to the finding that this type of ALL is significantly more sensitive in vitro tol-asparaginase (l-Asp).10,l-Asp is an enzyme-derived drug widely used in chemotherapeutic protocols for treatment of children with ALL. In vitro resistance to l-Asp is correlated with a relative poor prognosis in vivo.11,12 The proposed mechanism of action of l-Asp is the depletion of asparagine and glutamine in the blood leading to cellular efflux and depletion of these amino acids within cells.13 ALL cells are thought to be particularly sensitive to l-Asp treatment because of a relative low capacity to synthesize sufficient asparagine due to intrinsic lower asparagine synthetase (AS) levels.14,15 Resistance tol-Asp is suggested to be caused by an elevated cellular level of AS or by the ability of resistant cells to rapidly induce the expression of the AS gene on l-Asp exposure.16
The enhancer core sequence of AML1 is required for the transcription of several hematopoietic-specific genes, including the T-cell receptor β (TCRβ) enhancer. Although TEL/AML1 can bind to the enhancer core motif, and interacts with the AML1-binding protein, CBFβ, it fails to activate transcription but rather inhibits the basal activity of this enhancer.17 Because the AS gene contains an enhancer core sequence in the promotor region, this gene may become transcriptionally repressed by TEL/AML1 through a similar mechanism. The resulting inhibition of the basal activity of AS would explain the sensitivity to l-Asp for t(12;21)+ ALL compared with t(12;21)− ALL. In the present study we investigated whether this hypothesis is valid in pediatric ALL. We determined basal AS mRNA expression levels and possible up-regulation of AS levels in cultured blood/bone marrow samples of t(12;21)+ and t(12;21)− children with ALL and a healthy pediatric control group. In the ALL cases these AS expression levels were related to l-Asp sensitivity.
Patients, materials, and methods
Patient samples
Bone marrow or peripheral blood (or both) samples from untreated children with common/pre-B-ALL at initial diagnosis were collected from the Erasmus MC/Sophia Children's Hospital, the Dutch Childhood Leukemia Study Group (DCLSG), and the German COALL study group. After informed consent was obtained, bone marrow or peripheral blood samples from healthy children were included as controls from the Erasmus MC/Sophia Children's Hospital. Within 24 hours after sampling, mononuclear cells were isolated by density gradient centrifugation using Lymphoprep (density 1.077 g/mL; Nycomed Pharma, Oslo, Norway), centrifuged at 480g for 15 minutes at room temperature. The collected mononuclear cells were washed twice and kept in culture medium consisting of RPMI 1640 medium (Dutch modification withoutl-glutamine; Life Technologies, Gaithersburg, MD), 20% fetal calf serum (Integro; Zaandam, The Netherlands), 2 mMl-glutamine (Life Technologies), 5 μg/mL insulin, 5 μg/mL transferrin, 5 ng/mL sodium selenite (ITS media supplement; Sigma, St Louis, MO), 100 IU/mL penicillin, 100 μg/mL streptomycin, 0.125 μg/mL amphotericin B (Life Technologies) and 0.2 mg/mL gentamicin (Life Technologies). Contaminating nonleukemic cells in the ALL samples were removed by immunomagnetic beads as described earlier.18 All resulting samples contained 90% or more leukemic cells, as determined morphologically on May-Grünwald-Giemsa–stained (Merck, Darmstadt, Germany) cytospins. For RNA extraction, a minimum of 5 × 10⁶leukemic cells was lysed in Trizol reagent (Life Technologies) and stored at −80°C. A total of 0.025 × 10⁶ leukemic cells was used for cytospin preparations for fluorescence in situ hybridization (FISH) analysis and stored at −20°C.
FISH analysis
The presence of t(12;21) was determined with dual-colored FISH using a digoxigenin-labeled cosmid from intron 1 to exon 2 ofTEL (50F4) together with a biotinylated cosmid for the first 5 exons of AML1 (CO664). Probe 50F4 was detected with Texas red and probe CO664 with avidin-fluorescein isothiocyanate (FITC). In t(12;21)+ patients a yellow fusion spot will be seen denoting the der(21), one green signal for the normalAML1 on chromosome 21 and one red signal for the normalTEL on chromosome 12. The FISH protocol was based on that described previously.19 In all instances 2 independent observers examined 100 to 300 interphase nuclei.
In vitro l-Asp cytotoxicity assay
In vitro l-Asp cytotoxicity was determined using the 3-[4,5-dimethylthiazol-2-yl]-2,5-diphenyltetrazoliumbromide (MTT) assay as described previously.20 Briefly, 100-μL aliquots of cell suspension (1.6 × 10⁵ cells) were cultured in round-bottomed 96-well microtiter plates in the presence of 6 different concentrations of l-Asp (Paronal, Christiaens BV, Breda, The Netherlands) ranging from 0.0032 to 10 IU/mL in duplicate. Control cells were cultured without l-Asp. After incubating the plates for 4 days at 37°C in humidified air containing 5% CO2, 10 μL MTT (5 mg/mL; Sigma Aldrich, Zwijndrecht, The Netherlands) was added and the plates were incubated for an additional 6 hours under the same conditions. During this final 6-hour incubation, the yellow MTT tetrazolium salt is reduced to purple-blue formazan crystals by viable cells only. The formazan crystals were dissolved by adding 100 μL acidified isopropanol (0.04 N HCl-isopropyl alcohol) and the optical density (OD), which is linearly related to the number of viable cells,21 was measured spectrophotometrically at 562 nm. After subtraction of blank values, the leukemic cell survival (LCS) was calculated by the equation LCS = (ODday4 treated well/mean ODday4control wells) × 100%.
Drug sensitivity was assessed by the LC50, the drug concentration lethal to 50% of the cells. Evaluable assay results were obtained when a minimum of 70% leukemic cells was present in the control wells after 4 days of incubation and when the control OD was 0.050 or higher.20
RNA extraction and cDNA synthesis
Total cellular RNA was extracted from a minimum of 5 × 10⁶ (≥ 90% leukemic) cells using Trizol reagent (Life Technologies) according to the manufacturer's protocol, with minor modifications. An additional phenol-chloroform extraction was performed and the isopropanol precipitation at −20°C was facilitated by adding 1 μL (20 μg/mL) glycogen (Roche, Almere, The Netherlands). After precipitation with isopropanol, RNA pellets were dissolved in 20 μL RNAse-free TE buffer consisting of 10 mM Tris (tris(hydroxymethyl)aminomethane)–HCl and 1 mM EDTA (ethylenediaminetetraacetic acid) at pH 8.0. The concentration of RNA was quantitated spectrophotometrically. Following a denaturation step of 5 minutes at 70°C, 1 μg RNA was reversely transcribed into single-stranded cDNA. The reverse transcription (RT) reaction was performed in a total volume of 25 μL containing 0.2 mM random hexamers and 0.2 mM oligo dT primers (Amersham Pharmacia Biotech, Piscataway, NJ), 200 U Moloney murine leukemia virus reverse transcriptase (Promega, Madison, WI), and 25 U RNAsin (Promega) and was incubated at 37°C for 30 minutes, 42°C for 15 minutes, and 94°C for 5 minutes. The obtained cDNA was diluted to a final concentration of 8 ng/μL and stored at −80°C.
Real-time quantitative PCR
The mRNA expression levels of AS and an endogenous housekeeping gene encoding for glyceraldehyde-3-phosphate dehydrogenase (GAPDH) as a reference were quantified using real-time polymerase chain reaction (PCR) analysis (TaqMan chemistry) on an ABI Prism 7700 sequence detection system (PE Applied Biosystems, Foster City, CA). Amplification of specific PCR products was detected using dual-fluorescent nonextendable probes (hybridizing in between primer pairs) labeled with 6-carboxyfluorescein (FAM) at the 5′ end and 6-carboxytetramethylrhodamine (TAMRA) at the 3′ end. The primers and probe combinations (Table 1) were designed using OLIGO 6.22 software (Molecular Biology Insights, Cascade, CO) and purchased from Eurogentec (Seraing, Belgium). All primers had a melting temperature (Tm; nearest neighbor method) of 65 ± 1°C. Both internal probes had a Tm of 75 ± 1°C. All PCRs performed with comparable efficiencies of 95% or higher. The real-time quantitative PCR was performed in a total reaction volume of 50 μL containing 1 times TaqMan buffer A (Applied Biosystems), 4 mM MgCl2, 200 μM of each deoxyribonucleoside triphosphate (dNTP), 300 nM forward and reverse primer, 50 nM dual-labeled fluorogenic internal probe, 1.25 U AmpliTaq gold DNA polymerase, and 40 ng cDNA template, in a MicroAmp optical 96-well plate covered with optical adhesive covers (Applied Biosystems). Samples were heated for 10 minutes at 95°C and amplified for 40 cycles of 15 seconds at 95°C and 60 seconds at 60°C. A serial dilution of cDNA derived from a cell line RNA pool (CEM, K562, and 2 Epstein-Barr virus [EBV]–transformed lymphoblastoid B-cell lines) in dH2O was amplified in parallel to verify the amplification efficiency within each experiment. Because all PCRs were performed with equal efficiencies, relative mRNA expression levels of AS for each patient can directly be normalized for input RNA using GAPDH expression of the patient. The relative mRNA expression level of the target gene in each patient was calculated using the comparative cycle time (Ct) method.22 Briefly, the target PCR Ct values, that is, the cycle number at which emitted fluorescence exceeds the 10 × SD of baseline emissions as measured from cycles 3 to 12, is normalized by subtracting the GAPDHCt value from the target PCR Ct value, which gives the ΔCt value. From this ΔCt value, the relative expression level to GAPDH for each target PCR can be calculated using the following equation:
Relative mRNA expression = 2−ΔCt × 100%.
Up-regulation of AS expression levels after in vitrol-Asp exposure
Leukemic samples with a purity of at least 90% leukemic cells were exposed to 0 IU/mL (control), 0.4 IU/mL, and 10 IU/mLl-Asp (Paronal, Christiaens BV) for 0, 18, and 42 hours. A total of 10 × 106 cells suspended in a concentration of 2.0 × 10⁶ cells/mL in culture medium for each concentration and time point was placed into culture flasks. After 18 and 42 hours of incubation, the samples still contained at least 90% leukemic cells. For RNA extraction, cells were lysed in Trizol reagent (Life Technologies) and stored at −80°C.
Statistics
Differences in mRNA expression between 2 groups were analyzed using the Mann-Whitney U test. The correlation between mRNA expression of AS and l-Asp sensitivity were calculated using the Spearman rank correlation test. Statistical tests were performed at a 2-tailed significance level of .05.
Results
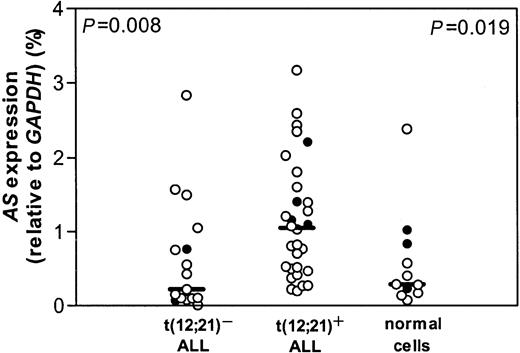
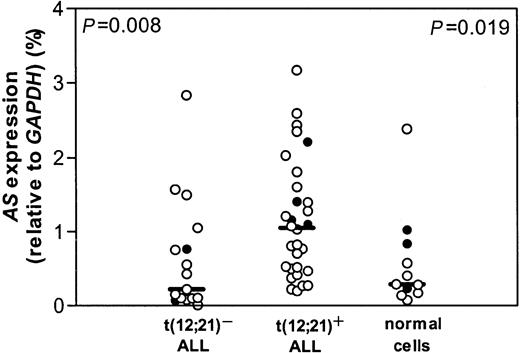
Leukemic cells from a group of 82 children with the t(12;21) were compared with leukemic samples of 40 t(12;21)− pediatric common or pre-B-ALL for l-Asp sensitivity. In this group, we were able to confirm that t(12;21)+ patients are significantly more sensitive to l-Asp than patients with t(12;21)− ALL, as described earlier.6 Using real-time quantitative PCR, the mRNA expression level of AS was measured in 30 t(12;21)+ pediatric ALL samples. For this t(12;21)+ group, a control group of 17 t(12;21)− ALL samples was selected by matching for the following criteria: age 1 to 10 years, immunophenotype, no hyperdiploidy (> 50), no MLL rearrangements, no t(9;22). A significant 5-fold higher expression of AS mRNA was observed in t(12;21)+ ALL compared with t(12;21)− ALL (P = .008; Figure 1).
AS expression and t(12;21) status.
mRNA expression of AS relative to GAPDH in t(12;21)− and t(12;21)+ ALL and in healthy controls. Lines indicate the median value, open circles (○) represent bone marrow of individual patients, and closed circles (●) represent peripheral blood of individual patients.P = .008 relates to the comparison between the t(12;21)− and t(12;21)+ patient groups; P = .019 relates to the comparison between the t(12;21)+ patient group and healthy controls.
Expression of AS mRNA in t(12;21)+ ALL was also significantly greater than in 11 healthy controls (P = .019; Figure 1). No difference in mRNA expression of AS between t(12;21)− ALL and healthy pediatric controls was found (Figure 1). Bone marrow and peripheral blood cells in the leukemic samples as well as in the healthy controls did not differ in AS mRNA expression and therefore were pooled together with the bone marrow samples.
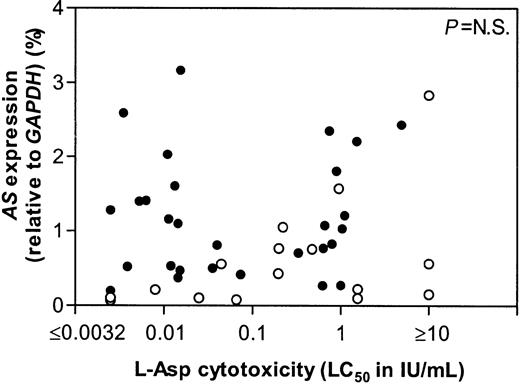
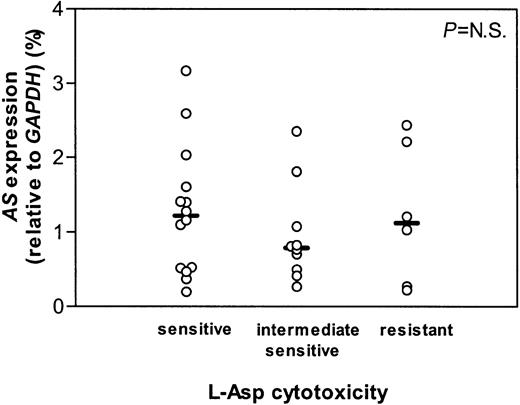
The t(12;21)+ ALL group could be divided into 3 subgroups based on sensitivity to l-Asp using previously reported cutoff points.11 23 From 14 sensitive, 10 intermediate sensitive, and 6 resistant patients the mRNA expression of AS did not differ (Figure 2). Neither the total ALL group, including both t(12;21)+ and t(12;21)− samples, nor both groups separately, showed a correlation between l-Asp sensitivity and the AS mRNA expression (Figure 3).
AS gene expression in t(12;21) ALL.
mRNA expression of AS relative to GAPDH in t(12;21)+ ALL patients who are in vitro sensitive, intermediate sensitive, and resistant to l-Asp. Lines indicate the median values, circles represent individual patients.P indicates the difference between patient groups (NS is not significant).
AS expression versus l-Asp sensitivity in ALL.
Correlation between the mRNA expression of AS and thel-Asp cytotoxicity. Open circles (○) indicate individual t(12;21)− patients, closed circles (●) indicate individual t(12;21)+ patients.
AS expression versus l-Asp sensitivity in ALL.
Correlation between the mRNA expression of AS and thel-Asp cytotoxicity. Open circles (○) indicate individual t(12;21)− patients, closed circles (●) indicate individual t(12;21)+ patients.
Hypothetically, t(12;21)+ ALL cells may be sensitive tol-Asp due to a defective capacity to up-regulate AS afterl-Asp exposure. Therefore, samples from 3 t(12;21)+ and 4 t(12;21)− ALL patients were exposed in vitro to 0.4 IU/mL and 10 IU/mL l-Asp. Within each group one patient did not show increased AS levels on exposure tol-Asp. All other samples showed up-regulation of AS, which was independent from t(12;21) status and cellular sensitivity tol-Asp (Figure 4). Consequently, during in vitro exposure to l-Asp no relationship was observed between the mRNA expression of AS and the presence of t(12;21) or l-Asp sensitivity.
AS up-regulation after l-Asp exposure.
mRNA expression of AS relative to GAPDH in t(12;21)+ versus t(12;21)− ALL afterl-Asp exposure. The open triangles (▵) or circles (○) indicate t(12;21)− patients, the closed triangles (▴) or circles (●) indicate t(12;21)+ patients. All triangles indicate patients exposed to 0.4 IU/mL l-Asp, and all circles indicate patients exposed to 10 IU/mL l-Asp.
Discussion
Based largely on in vitro observations in nonhuman leukemia cell lines, it has been hypothesized that elevated AS activity is a cause of resistance to l-Asp in human leukemia cells.16,24-28 In the present study, we analyzed a potential mechanism of l-Asp sensitivity in t(12;21)+ childhood ALL, speculating thatTEL/AML1 represses the transcription of the ASgene. So far, only one study directly correlated AS expression andl-Asp resistance in primary human leukemia cells. In 1969, Haskell and Canellos reported higher AS enzymatic activity in 5 patients with l-Asp–resistant leukemia compared with 4 drug-sensitive patients during or after treatment.29However, besides the highly limited number of patients, the criteria used to determine whether the patient was resistant or sensitive tol-Asp were not described in the paper. In addition, this study was performed in a heterogeneous group including adult patients with either acute or chronic leukemia. In 2000, Dübbers et al30 reported a lower AS activity in pediatric B-lineage ALL and acute myelogenous leukemia (AML)–M5 compared with T-lineage ALL and other AML subgroups. However, the B-lineage ALL group showed a large heterogeneity in enzyme activity.
In the study presented here, the t(12;21)+ ALL group was matched with a t(12;21)−, age 1 to 10 years, nonhyperdiploid (> 50), t(9;22)−, non-MLL rearranged, common/pre-B-ALL group. We found that t(12;21)+ ALL cells express 5-fold more AS mRNA compared with the matched t(12;21)− ALL. This stands in contrast to our hypothesis that TEL/AML1 might repress theAS gene and it also refutes the hypothesis that an elevated AS level is the most important determinant of l-Asp resistance,17 since the present study and an earlier study10 show that t(12;21)+ patients are significantly more sensitive to l-Asp in vitro. Moreover, we found no correlation between in vitro sensitivity tol-Asp and the mRNA expression of AS suggesting that the basal mRNA level of AS at initial diagnosis is not associated withl-Asp sensitivity in pediatric ALL.
It could be argued that the mRNA expression level of AS does not relate to the protein level and enzyme activity. However, Hutson et al28 showed on human leukemia cell lines that complete amino acid deprivation resulted in a concerted increase in AS mRNA, protein, and enzymatic activity, suggesting that mRNA levels correspond to AS protein levels.
l-Asp is an effective drug for newly diagnosed ALL. The effectiveness of this drug results from a rapid and complete depletion of cellular asparagine.13 It was postulated years ago that leukemic cells depend on the external availability of the amino acid asparagine because of absence of endogenous AS.14 15Asparagine deficiency impairs protein synthesis and leads to a cessation of RNA or DNA synthesis, resulting in cell death. In our study, however, we found no difference in AS mRNA expression between ALL and normal bone marrow or peripheral blood cells. This contradicts the general thought that leukemic cells specifically lack AS compared with normal bone marrow and peripheral blood cells.
In a small sample of patients we showed that leukemic cells from patients with or without the t(12;21) and resistant or sensitive tol-Asp do not differ in their capacity to up-regulate AS on in vitro exposure to l-Asp, suggesting that resistance tol-Asp is not caused by rapid induction of AS expression onl-Asp exposure.17 However, these findings need to be confirmed in a larger series of patients. The only difference we did find is a higher basal expression of AS in t(12;21)+ALL compared with t(12;21)− ALL and healthy cells. We speculated that TEL/AML1 functions as a repressor for the transcription of AS comparable to the TCRβenhancer. However, our data suggest the opposite. Therefore, based on these data, it might be hypothesized that AS is normally repressed by AML1 and that TEL/AML1 cancels the repression ofAS.
The clinical role of l-Asp in t(12;21)+ ALL is a subject of discussion. Although most studies associate t(12;21) with a good prognosis, conflicting results are described.3,4,8,9,31-33 These conflicting data might be due to differences in use of l-Asp in the treatment protocols because t(12;21)+ ALL is highly sensitive tol-Asp10 and l-Asp–sensitive patients have a more favorable outcome.11 The Dana-Farber Cancer Institute (DFCI) group showed a highly favorable outcome of t(12;21)+ ALL.3 In the DFCI protocol, a high-dose l-Asp is used compared with other treatment protocols. However, it is possible that a general intensification of therapy, not only by l-Asp but also by other drugs, might contribute to the fact that in some recent protocols t(12;21) has a favorable outcome. This has, for instance, been shown by a Japanese study, which reported no prognostic value for the presence of t(12;21) in an early study; however, with intensified therapy in a newer protocol the t(12;21)+ patients did exceedingly well.33
Summarizing, t(12;21)+ ALL, which in vitro is significantly more sensitive to l-Asp, has a significantly higher AS mRNA expression level compared with t(12;21)−ALL and normal lymphoid cells. So, the AS mRNA expression level does not explain the high sensitivity to l-Asp of t(12;21)+ ALL. The mechanism that makes t(12;21)+ ALL patients more sensitive to l-Asp remains unclear. An alternative explanation might be that t(12;21)+ ALL cells are not able to provide sufficient amounts of the AS substrates, aspartate and glutamine. In 2001, Aslanian and Kilberg34 illustrated that several adaptive processes occur to provide aspartate and glutamine to support the activity of AS. These substrates could come from an intracellular pool or may be acquired from the extracellular milieu by active transport across the plasma membrane via several amino acid transporters such as systems XC, XA, G, A, ASC, and L. Another study in human leukemia cell lines showed that glutamine deprivation–dependent cell shrinkage induced activation of the CD95-mediated pathway.35 This was also observed whenl-Asp was added to the medium. In 2001, Krishna Narla et al observed a higher expression level of the proapoptotic protein CD95 and lower levels of the antiapoptotic protein Bcl-2 in t(12;21)+ ALL cells compared with t(12;21)−ALL cells in children.36 This suggests thatl-Asp sensitivity in t(12;21)+ ALL cells might be related to expression levels of CD95 or Bcl-2 or both.
In conclusion, the mechanism of l-Asp sensitivity in t(12;21)+ ALL is not related to AS expression and remains still unclear. Moreover, the present data clearly contradict an almost 35-year-old theory that the therapeutic benefit of l-Asp in leukemia is based on the fact that leukemic cells lack sufficient AS compared with normal cells.
We wish to express our gratitude to the members of the DCLSG and the German COALL study group for their support to this study by providing leukemic samples.
Prepublished online as Blood First Edition Paper, November 14, 2002; DOI 10.1182/blood-2002-08-2446.
Supported by a grant from the Sophia Foundation for Medical Research (SSWO grant 309).
The publication costs of this article were defrayed in part by page charge payment. Therefore, and solely to indicate this fact, this article is hereby marked “advertisement” in accordance with 18 U.S.C. section 1734.
References
Author notes
Wendy A.G. Stams, Erasmus MC/University Medical Center Rotterdam/Sophia Children's Hospital, Division of Pediatric Oncology/ Hematology, Dr Molewaterplein 60 3015 GJ Rotterdam, the Netherlands; e-mail:stams@kgk.fgg.eur.nl.


