Abstract
Acute promyelocytic leukemia (APL) is associated with chromosomal translocations involving retinoic acid receptor α (RARα) and its fusion partners including promyelocytic leukemia (PML) and promyelocytic leukemia zinc finger (PLZF). Using oligonucleotide arrays, we examined changes in global gene expression mediated by the ectopic expression of either PML/RARα (retinoid-sensitive) or PLZF/RARα (retinoid-resistant) in U937 cells. Of more than 5000 genes analyzed, 16 genes were commonly up-regulated, and 57 genes were down-regulated by both fusion proteins suggesting their role in the APL phenotype. In our APL model, for example, TNFAIP2, TNFR2, ELF4, RARγ, and HoxA1 were down-regulated by both fusion proteins in the absence of retinoic acid (RA). RA strongly up-regulated these genes in PML/RARα, but not in PLZF/RARα expressing U937 cells. Expression studies in NB4, retinoid-resistant NB4-R2, normal human CD34+ cells, and APL patient samples strongly suggest their role in the regulation of granulocytic differentiation. Furthermore, combined treatment with tumor necrosis factor α (TNFα) and RA synergistically enhanced granulocytic differentiation in NB4 cells but not in NB4-R2 cells. Our data indicate that APL pathogenesis and retinoid-induced granulocytic differentiation of APL cells involve genes in the cell death pathway, and that cooperation between the RA and TNFα signaling pathways exists. Targeting both the retinoid-dependent differentiation and the cell death pathways may improve leukemic therapy, especially in retinoid-resistant acute myeloid leukemia. (Blood. 2003;102:3727-3736)
Introduction
Acute promyelocytic leukemia (APL) is characterized by a unique translocation involving the retinoic acid receptor α (RARα) and one of its fusion partners, promyelocytic leukemia (PML), promyelocytic leukemia zinc finger (PLZF), nucleophosmin (NPM), nuclear matrix associated (NuMA), and signal transducer and activator of transcription 5B (STAT5B).1,2 The majority of APL cases are caused by PML/RARα that retains most of the putative functional domains of PML and the DNA and ligand-binding domains of RARα. PML/RARα can heterodimerize with retinoid X receptor (RXR) and PML, and thus has the potential to interfere with the endogenous signaling pathways of both PML and RARα, thereby promoting cell growth by blocking apoptotic cell death and inhibiting terminal differentiation of hematopoietic precursor cells. Recently, all-trans retinoic acid (ATRA) has become a standard therapy for the induction of remissions in patients with APL caused by PML/RARα.3 APL provides an excellent model in which a specific abnormal gene product is responsible both for the APL phenotype and for the in vitro and in vivo sensitivity to cell differentiation mediated by ATRA.
In contrast, a small subset of patients with APL develop leukemia as a result of t(11;17) causing a PLZF/RARα fusion protein.4,5 This APL is morphologically indistinguishable from that caused by PML/RARα but is usually unresponsive to retinoids. PLZF/RARα has a retinoid-independent corepressor-binding domain in the amino terminus (poxvirus and zinc finger [POZ] domain) of PLZF, which may be the cause for retinoid resistance of these APL cells both in vivo and in vitro.6
The current hypothesis of APL pathogenesis suggests that the aberrant fusion proteins, PML/RARα, PLZF/RARα, and others, recruit corepressors and histone deacetylases (HDACs) to their putative target genes in the absence of pharmacologic levels of retinoic acids (RAs), and these APL fusion proteins share downstream target genes and signaling pathways.7,8 However, what these are remains largely unknown. The above hypothesis suggests that APL fusion proteins will repress the expression of these target genes in the absence of retinoids. Whether these fusion proteins have other mechanisms of action by up-regulating target gene expression is not known. Furthermore, molecular pathways that are involved in RA responsiveness and resistance in APL are poorly understood. Recent developments in DNA microarray technologies enable us to look at the changes in global gene expression that are associated with a single gene abnormality.9,10 In this report, using similar approaches, we show global gene expression profiles of retinoid-sensitive and -resistant APL and retinoid treatment effects in a cell line model. In addition, using this approach, we identified new sets of genes that may be important in APL pathogenesis as well as retinoid responsiveness or resistance in APL. We show that comparative gene expression analysis can be used in identifying potential molecular targets for the development of novel therapeutics.
Materials and methods
Cell lines
U937 cells were obtained from American Type Culture Collection (ATCC, Rockville, MD), and U937PR911 and U937B41212 cells were generously provided by P. G. Pelicci (European Institute of Oncology, Milan, Italy) and M. Ruthardt (University of Frankfurt, Germany), respectively. NB4 and NB4-R213,14 cells were a kind gift from M. Lanotte (St Louis Hospital, Paris, France). Cells were maintained in culture as described previously.15
Patient samples
APL samples either from bone marrow or peripheral blood (> 95% leukemic cells) were obtained from patients with APL at the time of diagnosis after informed consent was given. Approval for these studies was obtained from the Cedars-Sinai Medical Center Institutional Review Board. All samples had a documented cytogenetic abnormality of t(15;17). Of the patients, 3 (nos. 1, 3, 4) had classic M3 subtype, and 1 (no. 2) had M3 variant. Leukemic cells from 3 patients (nos. 1, 2, 4) had PML/RARα bcr1 subtype; the breakpoint subtype was unknown in the other patient (no. 3). There were 3 patients (nos. 1, 2, 3) who responded clinically to ATRA; in 1 patient (no. 4) with a high white blood cell count (75 × 109/L [75 000/μL]) at presentation, clinical responsiveness to ATRA could not be assessed due to early death (day 4 of induction). Viable leukemic cells were either untreated or treated in vitro with ATRA (1 μM) in RPMI 1640 media supplemented with 10% fetal bovine serum for 6 hours or 2 and 5 days. Leukemic cells were then harvested for total RNA using TRIzol (Invitrogen, Carlsbad, CA) according to the manufacturer's protocol.
Oligonucleotide microarray expression analysis
U937, U937PR9, and U937B412 cells were cultured in media containing 100 μM ZnSO4 (Sigma, St Louis, MO) for 16 hours for the induction of either PML/RARα or PLZF/RARα fusion protein expression, and subsequently cells were cultured either with or without ATRA (1 μM; Sigma) for 6 hours to induce retinoid target genes. At different time points, 3 complete independent cultures were carried out for the microarray experiments. Total RNA extracted by TRIzol was purified using RNeasy system (QIAGEN, Valencia, CA) according to the manufacturer's instruction. Purified total RNA (8 μg) from each sample was used to prepare biotinylated cRNA probes, and 15 μg labeled cRNA from each sample was used for hybridization to HuGeneFL Array (Affymetrix, Santa Clara, CA) at the GeneChip Core, University of California, San Diego, as described previously.16 Following the hybridization, arrays were washed and stained with streptavidin-phycoerythrin and scanned on a Hewlett Packard scanner (Houston, TX). The measured fluorescence intensity values were captured using GeneChip software (Affymetrix), and the data were normalized by global scaling to a target value of 2500 and to the average fluorescence intensity for the entire microarray.
Microarray data analysis
Data generated by GeneChip software (Affymetrix) were exported to GeneSpring software version 4.2 (Silicon Genetics, San Carlos, CA) for further analyses. For hierarchic clustering analysis (Figure 1), GeneChip software-generated data sets were entered as 18 independent experiments (6 experimental groups in triplicate) into GeneSpring software, and experiment normalization was used to standardize the microarray data. Following standardization, data sets were subjected to a statistical group comparison filter in order to test for significant differences in expression levels between experimental groups. A nonparametric (Kruskal-Wallis) test with a P value cutoff of .001 was applied to generate a list of genes that can best differentiate various experimental groups. Gene and experiment trees were generated using this gene list; similarities were measured by Spearman correlation (separation ratio 0.5; minimum distance 0.001).
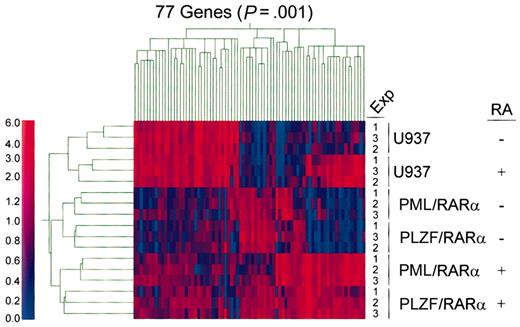
Hierarchic clustering analyses of gene expression profiles in APL models either with or without retinoid treatment. For hierarchic clustering analysis, GeneChip software-generated data sets were entered as 18 independent experiments (6 experimental groups in triplicate) into GeneSpring software, and Experiment Normalization was used to standardize the microarray data. Following standardization, data sets were subjected to a Statistical Group Comparison Filter in order to test for significant differences in expression levels between experimental groups. A nonparametric (Kruskal-Wallis) test with a P value cutoff of .001 was applied to generate a list of genes that can best differentiate various experimental groups. Gene and experiment trees were generated using this gene list; similarities are measured by Spearman correlation (separation ratio 0.5; minimum distance 0.001). The color in each cell of the cluster reflects the mean-centered expression level of the gene. The color scale bar reflects normalized expression levels (0 to 6.0). Red and blue colors denote gene expression levels that are either higher or lower than the mean expression level, respectively.
Hierarchic clustering analyses of gene expression profiles in APL models either with or without retinoid treatment. For hierarchic clustering analysis, GeneChip software-generated data sets were entered as 18 independent experiments (6 experimental groups in triplicate) into GeneSpring software, and Experiment Normalization was used to standardize the microarray data. Following standardization, data sets were subjected to a Statistical Group Comparison Filter in order to test for significant differences in expression levels between experimental groups. A nonparametric (Kruskal-Wallis) test with a P value cutoff of .001 was applied to generate a list of genes that can best differentiate various experimental groups. Gene and experiment trees were generated using this gene list; similarities are measured by Spearman correlation (separation ratio 0.5; minimum distance 0.001). The color in each cell of the cluster reflects the mean-centered expression level of the gene. The color scale bar reflects normalized expression levels (0 to 6.0). Red and blue colors denote gene expression levels that are either higher or lower than the mean expression level, respectively.
Pair-wise comparisons were performed to examine gene effect (PML/RARα and PLZF/RARα) as well as retinoid-treatment effect. For gene effect analysis, data from U937 cells were compared with data from either U937PR9 (for PML/RARα effect) or U937B412 (for PLZF/RARα effect) cells. For retinoid effect analysis, data from retinoid untreated cells were compared with data from retinoid-treated cells (U937 vs RA-treated U937; U937PR9 vs RA-treated U937PR9; U937B412 vs RA-treated U937B412). Triplicate experiments were performed in a paired fashion at 3 different times. Gene lists in pair-wise comparisons were generated by selecting genes with at least 2-fold expression change and the raw intensity value of at least 1000 in the experimental sample in triplicate experiments. These gene lists were then applied for the Venn diagram analyses. For fold expression change calculations, average difference values below the detection limit of 10 including the negative expression values were set at an arbitrary “11” to capture the genes that are not expressed in one sample, but switched on in the other, or vice versa. Mean fold changes were calculated using a simple division of raw expression values between experimental sample and control. P values by Student t test in pair-wise comparisons are also reported (Tables 1, 2).
Northern blot analysis
Microarray data were confirmed by Northern blot analysis using the same total RNA samples that were used in the microarray analysis or total RNA isolated from NB4 or NB4-R2 cells that were treated with ATRA (1 μM). For transcriptional regulation experiments, U937PR9 cells were pretreated either with or without cycloheximide (CHX, 10 μg/mL; Sigma) for 30 minutes to inhibit new protein synthesis, and then the cells were induced with ATRA (1 μM) for 6 hours. Northern blot analyses were carried out using 10 μg total RNA as described previously.15
Reverse transcriptase-polymerase chain reaction (RT-PCR)
CD34+ cells from bone marrow of healthy volunteers were isolated and differentiated as described previously.17 Cells were harvested on days 0, 2, 5, 7, 9, and 12 for total RNA. Semiquantitative RT-PCR for retinoid-regulated genes or CD34, CD11b, and lactoferrin was performed using RNA samples made from 3 independent cultures using standard methods.17 In addition, RT-PCR for 18S was used as an internal control to ensure equal loading of samples.
Real-time RT-PCR was performed to analyze gene expression in clinical samples. Total RNA from APL cells was treated with DNase I (Promega, Madison, MI) to eliminate genomic DNA contamination. Reverse transcription of total RNA was carried out using SuperScript II (Invitrogen) according to the manufacturer's protocol. Concentrations of primers and TaqMan probes (Applied Biosystems, Foster City, CA) (sequences will be provided upon request) were 300 nM and 100 nM, respectively. Real-time RT-PCR was performed for all genes in triplicate using iCycler iQ system (BIO-RAD, Hercules, CA) as described previously.16 Similarly, 18S expression was assessed as an internal control to account for different amounts of cDNA.
Protein expression by immunofluorescence
TNFR2 protein expression in NB4 and NB4-R2 cells either with or without ATRA (1 μM for 24 hours) was assessed by fluorescence-activated cell sorting (FACS) using a phycoerythrin (PE)-labeled monoclonal TNFR2 antibody (R & D Systems, Minneapolis, MN). Experiments were carried out in triplicate, and the mean percentage of cells with positive expression and standard deviations was calculated.
Cell differentiation and apoptosis analysis
NB4 and NB4-R2 cells were cultured in media containing ATRA (0.1 μM) alone, tumor necrosis factor α (TNFα, 10 ng/mL; Sigma) alone, or ATRA plus TNFα for 7 days; cells were then harvested at 0, 2, 4, and 7 days. Differentiation and apoptosis, using markers CD66b and Annexin V, respectively, were assessed by FACS as previously described.15 All analyses were carried out in triplicate, and the mean percentage of cells with positive expression and standard deviations was calculated.
Results
Analysis of gene expression profiles in retinoid-sensitive or retinoid-resistant APL with or without retinoid treatment
PML/RARα and PLZF/RARα fusion genes were introduced into the myelomonocytic AML cell line U937 in order to examine their effect on gene expression. Resulting cell lines U937PR9 and U937B412 were treated with ZnSO4 to induce expression of either PML/RARα or PLZF/RARα fusion protein, respectively. The parental cell line U937 was similarly treated as a control. Gene expression profiles generated from Zn-treated U937, U937PR9, and U937B412 cells, both untreated and treated with RA, were analyzed. Affymetrix Expression report was generated for each sample, and the RNA quality and quality of hybridization were assessed. Percent present calls was 29.1 ± 1.4%, and percent absent calls was 69.9 ± 1.4%. The 3′/5′ ratio for housekeeping controls GAPDH (glyceraldehyde-3-phosphate dehydrogenase) and β-actin were 1.53 ± 0.22 and 0.98 ± 0.2, respectively. Using GeneSpring software, we analyzed all the data sets for hierarchic clustering18 using algorithms as detailed in “Materials and methods.” We identified 77 genes that show statistically significant differences in the mean expression levels across all groups. Hierarchic clustering of 77 genes in 18 experimental groups (6 experimental groups in triplicate) predicted an experiment tree that correctly clusters different experimental groups in triplicate experiments with and without retinoid treatment (Figure 1). Gene expression profiles of RA-treated or control U937 cells were more similar to each other than that of U937 cells expressing either PML/RARα or PLZF/RARα. Interestingly, the expression profiles of non-retinoid treated U937 cells expressing either PML/RARα or PLZF/RARα were also more similar to each other than to the same cells cultured with RA (Figure 1).
Genes that are involved in the pathogenesis of APL
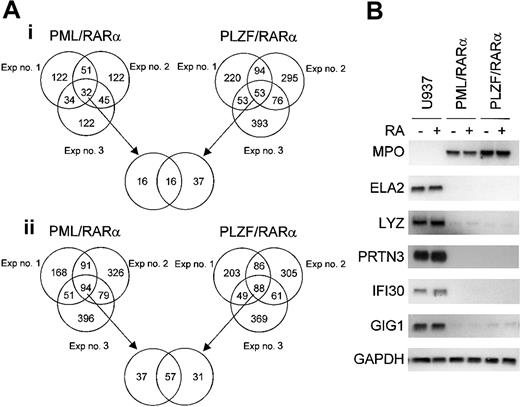
Genes that were commonly regulated by the expression of either PML/RARα or PLZF/RARα fusion proteins were examined in a pair-wise comparison in triplicate experiments (Figure 2A). The number of genes that were either down- or up-regulated at least 2-fold and had a raw intensity value of at least 1000 in the experimental sample in each of the 3 independent experiments are represented in Venn diagrams. From our experience, these restrictions were good at predicting significant gene expression differences on subsequent Northern blot analyses, and triplicate experiments were critical to ensure that variabilities between experiments do not affect our outcome analysis. In all 3 experiments, 57 genes were commonly down-regulated by both fusion proteins, whereas 37 and 31 genes were down-regulated by either PML/RARα or PLZF/RARα alone, respectively. In addition, we found that 16 genes were commonly up-regulated by both fusion proteins in all 3 experiments, whereas 16 and 37 genes were up-regulated by only PML/RARα or PLZF/RARα, respectively. A list of the commonly down- or up-regulated genes is shown in Table 1. The number of commonly down-regulated genes is substantially greater than the number of commonly up-regulated genes; this result affirms the notion that these fusion genes function mainly as transcriptional repressors.
Alterations in gene expression mediated by either PML/RARα or PLZF/RARα in U937 cells. Pair-wise comparisons were performed to examine the gene effect; data from U937 cells were compared with that from either U937PR9 (for PML/RARα effect) or U937B412 (for PLZF/RARα effect) cells. Triplicate experiments were performed in a paired fashion at 3 different times. (A) Venn diagram of genes that are either (i) up-regulated or (ii) down-regulated by conditional expression of APL fusion proteins in each of 3 independent experiments. The criteria for altered gene expression include a 2-fold or more change in the raw value and a raw expression value of at least 1000 in the experimental group. (B) Northern blot confirmation of microarray data concerning genes that are commonly up- or down-regulated by induced expression of either PML/RARα or PLZF/RARα fusion protein. The same samples of total RNA used in the microarray analysis were used (10 μg/lane) in the Northern blot analysis. Each blot was rehybridized for GAPDH to ensure equal loading of RNA.
Alterations in gene expression mediated by either PML/RARα or PLZF/RARα in U937 cells. Pair-wise comparisons were performed to examine the gene effect; data from U937 cells were compared with that from either U937PR9 (for PML/RARα effect) or U937B412 (for PLZF/RARα effect) cells. Triplicate experiments were performed in a paired fashion at 3 different times. (A) Venn diagram of genes that are either (i) up-regulated or (ii) down-regulated by conditional expression of APL fusion proteins in each of 3 independent experiments. The criteria for altered gene expression include a 2-fold or more change in the raw value and a raw expression value of at least 1000 in the experimental group. (B) Northern blot confirmation of microarray data concerning genes that are commonly up- or down-regulated by induced expression of either PML/RARα or PLZF/RARα fusion protein. The same samples of total RNA used in the microarray analysis were used (10 μg/lane) in the Northern blot analysis. Each blot was rehybridized for GAPDH to ensure equal loading of RNA.
Genes that are down-regulated by PML/RARα and PLZF/RARα
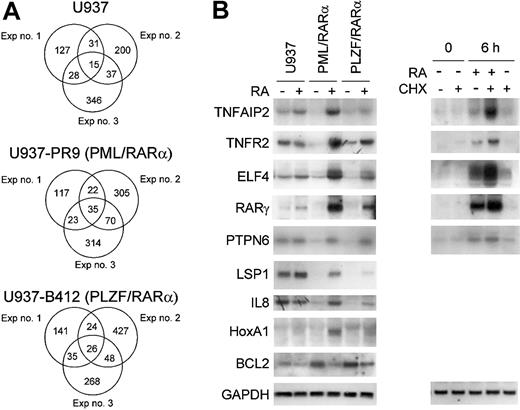
Northern blot analyses of selected genes that were commonly down-regulated by induction of PML/RARα and PLZF/RARα are shown in Figure 2B. APL blast cells typically have a large number of primary granules; therefore primary granule genes should be expressed highly in these cells. On the contrary, we found that 3 of the 4 primary granule genes, neutrophil elastase (ELA2), lysozyme (LYZ), and proteinase 3 (PRTN3), but not myeloperoxidase (MPO), were strongly down-regulated by both PML/RARα and PLZF/RARα (Figure 2B). Expression of these genes was not affected by a short exposure to RA (6 hours). Other down-regulated genes confirmed by Northern blot analysis include interferon γ-inducible protein (IFI30 or GILT), granulocyte colony-stimulating factor (G-CSF)-induced gene 1 (GIG-1), RARγ, elf-1-like factor 4 (ELF4 or myeloid elf-1-like factor [MEF]), protein tyrosine phosphatase, non-receptor type 6 (PTPN6), lymphocyte-specific protein 1 (LSP1), interleukin-8 (IL-8), tumor necrosis factor α-induced protein 2 (TNFAIP2 or B94), and tumor necrosis factor receptor 2 (TNFR2 or TNFRSF1B) (Figures 2B,3B). Similar to primary granule gene expression, IFI30 and GIG-1 are not regulated by ATRA.
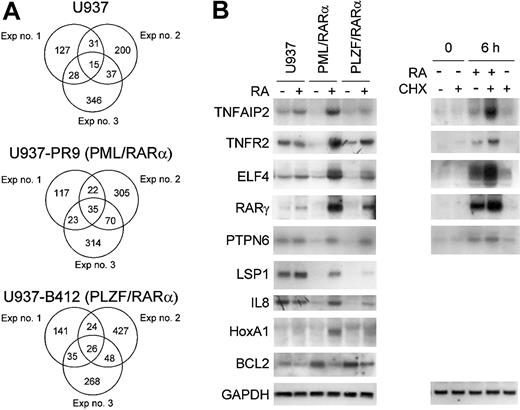
Effect of RA on gene expression of U937PR9 (retinoid-sensitive) and U937B412 (retinoid-resistant) cells. Pair-wise comparisons were performed to examine the retinoid-treatment effect; data from retinoid untreated cells were compared with those from retinoid-treated cells (U937 vs RA-treated U937; U937PR9 vs RA-treated U937PR9; U937B412 vs RA-treated U937B412). Triplicate experiments were performed in a paired fashion at 3 different times. (A) Venn diagrams of genes that are up-regulated by RA in each of 3 independent experiments. The criteria for altered gene expression include 2-fold or more change in the raw values, and raw expression values of at least 1000 in the experimental group. (B) Northern blot analysis of RA-regulated genes. Northern blot analysis using the same samples of total RNA used in the microarray analysis confirmed the RA regulation of genes from microarray data. In addition, effect of protein synthesis inhibitor cycloheximide (CHX) on retinoid-dependent gene expression was examined. U937PR9 cells were incubated with CHX (10 μg/mL) alone, CHX and ATRA (10-6 M), or ATRA alone for 0 and 6 hours. Each blot was rehybridized for GAPDH to ensure equal loading of RNA.
Effect of RA on gene expression of U937PR9 (retinoid-sensitive) and U937B412 (retinoid-resistant) cells. Pair-wise comparisons were performed to examine the retinoid-treatment effect; data from retinoid untreated cells were compared with those from retinoid-treated cells (U937 vs RA-treated U937; U937PR9 vs RA-treated U937PR9; U937B412 vs RA-treated U937B412). Triplicate experiments were performed in a paired fashion at 3 different times. (A) Venn diagrams of genes that are up-regulated by RA in each of 3 independent experiments. The criteria for altered gene expression include 2-fold or more change in the raw values, and raw expression values of at least 1000 in the experimental group. (B) Northern blot analysis of RA-regulated genes. Northern blot analysis using the same samples of total RNA used in the microarray analysis confirmed the RA regulation of genes from microarray data. In addition, effect of protein synthesis inhibitor cycloheximide (CHX) on retinoid-dependent gene expression was examined. U937PR9 cells were incubated with CHX (10 μg/mL) alone, CHX and ATRA (10-6 M), or ATRA alone for 0 and 6 hours. Each blot was rehybridized for GAPDH to ensure equal loading of RNA.
Retinoid regulation of genes in APL
Among the genes regulated by the APL fusion proteins, a small subset clearly responds differently in retinoid-sensitive cells compared with those cells that are retinoid resistant. Genes that have differential responses to retinoids may be crucial in predicting retinoid response in a clinical setting. Figure 3A shows Venn diagrams representing the number of genes that were commonly up-regulated by RA in either the PML/RARα- or PLZF/RARα-expressing U937 cells or their parental wild-type cells. Lists of these genes are shown in Table 2. A subset of genes that were commonly down-regulated by both fusion proteins was uniquely up-regulated by RA only in the PML/RARα- (retinoid sensitive) expressing cells. For example, the expression of the ELF4, TNFR2, TNFAIP2, and RARγ genes was strongly down-regulated by the APL fusion proteins in the absence of RA. However, these genes were specifically up-regulated in the presence of RA in the PML/RARα-expressing cells but not in those expressing either PLZF/RARα or the parental U937 cells (Figure 3B). These genes were direct transcriptional targets of RA since new protein synthesis was not required for the retinoid-induced up-regulation (Figure 3B). LSP1, IL-8, and homeobox A1 (HoxA1) were also up-regulated by RA (Figure 3B). While induction of HoxA1 expression was independent of new protein synthesis, LSP1 and IL-8 were not direct transcriptional targets of RA as indicated by cycloheximide experiments (data not shown). In addition, the expression of the antiapoptotic gene BCL2 was strongly up-regulated by the APL fusion proteins in the absence of RA. However, in response to RA, BCL2 expression was down-regulated in PML/RARα-expressing cells but not in PLZF/RARα-expressing or parental U937 cells (Figure 3B).
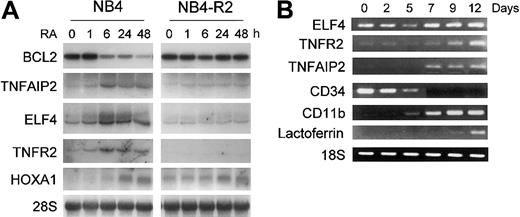
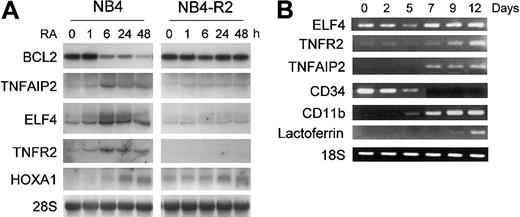
In order to confirm that retinoid regulation of these genes was not specific to U937PR9 cells, the retinoid responsiveness of ELF4, TNFR2, TNFAIP2, RARγ, HoxA1, and BCL2 gene expression was also examined in the APL cell line NB4 and the retinoid-resistant NB4-R2 cells. ELF4, an E74 family member of the Ets-related transcription factors was up-regulated during retinoid-induced granulocytic differentiation of NB4 and HL60 cells but not in retinoid-resistant NB4-R2 cells (Figure 4A and data not shown). Similarly, the expression of TNFAIP2 and TNFR2 was strongly increased by RA in NB4 but not in retinoid-resistant NB4-R2 cells (Figure 4A). Furthermore, their expression paralleled the maturation of normal human CD34+ hematopoietic stem cells that were induced to differentiate toward granulocytes by cytokines (Figure 4B). Differentiation was monitored by loss of CD34 expression and increased levels of CD11b and lactoferrin.
Confirmation of expression of retinoid-regulated genes in NB4, NB4-R2, or CD34+ cells. (A) Northern blot analysis of ELF4, BCL2, TNFR2, TNFAIP2, and HoxA1 expression by RA. NB4 and NB4-R2 cells were treated with ATRA (1 μM) at the indicated time points. Northern blot analysis was carried out using total RNA (10 μg/lane) and hybridized with 32P-labeled RT-PCR-generated probes. The same blot was rehybridized for GAPDH to ensure equal RNA loading. (B) TNFR2, TNFAIP2, and ELF4 expression in CD34+ cells during granulocytic differentiation as measured by semiquantitative RT-PCR. Human CD34+ hematopoietic stem cells were cultured in the presence of cytokines (stem cell factor, IL-3, and GM-CSF) for 12 days to induce granulocytic differentiation. Control RT-PCR reactions were performed for differentiation marker genes, such as CD34, CD11b, and lactoferrin. In addition, RT-PCR for 18S was carried out as an internal control to ensure equal loading of the samples.
Confirmation of expression of retinoid-regulated genes in NB4, NB4-R2, or CD34+ cells. (A) Northern blot analysis of ELF4, BCL2, TNFR2, TNFAIP2, and HoxA1 expression by RA. NB4 and NB4-R2 cells were treated with ATRA (1 μM) at the indicated time points. Northern blot analysis was carried out using total RNA (10 μg/lane) and hybridized with 32P-labeled RT-PCR-generated probes. The same blot was rehybridized for GAPDH to ensure equal RNA loading. (B) TNFR2, TNFAIP2, and ELF4 expression in CD34+ cells during granulocytic differentiation as measured by semiquantitative RT-PCR. Human CD34+ hematopoietic stem cells were cultured in the presence of cytokines (stem cell factor, IL-3, and GM-CSF) for 12 days to induce granulocytic differentiation. Control RT-PCR reactions were performed for differentiation marker genes, such as CD34, CD11b, and lactoferrin. In addition, RT-PCR for 18S was carried out as an internal control to ensure equal loading of the samples.
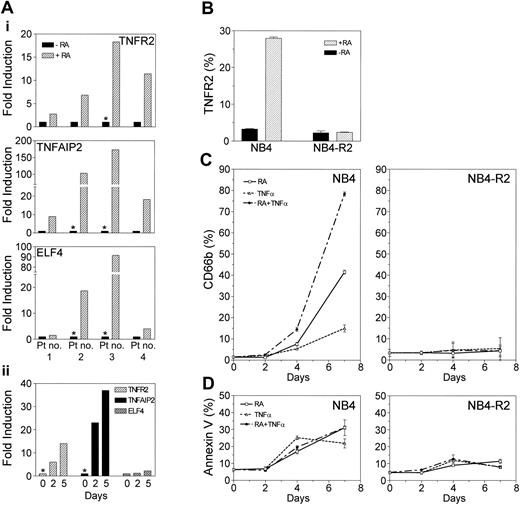
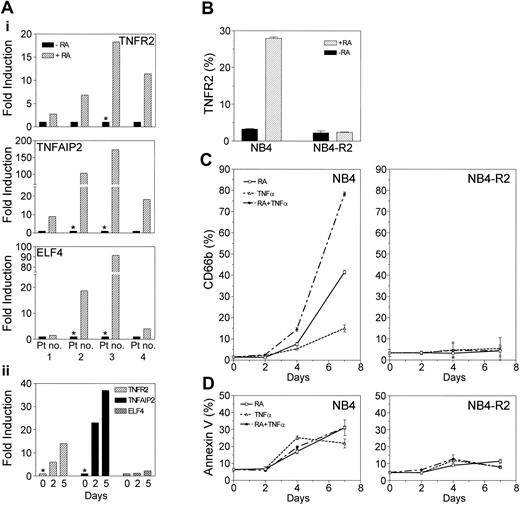
We further confirmed the retinoid-dependent up-regulation of TNFR2, TNFAIP2, and ELF4 gene expression in APL patient samples. Cells from patients with APL were cultured either in the presence or absence of ATRA in vitro for 6 hours, and the RA-dependent induction of gene expression was assessed by real-time RT-PCR. As shown in Figure 5A, RA significantly up-regulated the expression of TNFR2 (range, 2.7- to 18.3-fold), TNFAIP2 (range, 8.9- to 172.8-fold), and ELF4 (range, 1.5- to 91.5-fold) in APL patient samples, thus confirming the relevance of our microarray data using clinical samples.
Retinoid-dependent up-regulation of TNFR2, TNFAIP2, and ELF4 genes in APL. (A) TNFR2, TNFAIP2, and ELF4 gene expression in APL patient samples by real-time RT-PCR. Leukemia samples from APL patients (with t(15;17)) were examined for retinoid-dependent regulation of TNFR2, TNFAIP2, and ELF4 genes by real-time RT-PCR using TaqMan probes. Leukemic cells obtained at diagnosis were either untreated or treated with ATRA (1 μM) in vitro for (i) 6 hours or (ii) 2 and 5 days (patient no. 3). Retinoid-dependent up-regulation of gene expression is shown as fold induction. *Where gene expression (in retinoid untreated) is below detectable level, data point was arbitrarily assigned at the lowest linear expression level in the standard curve to calculate the fold-induction. (B) Retinoid-dependent up-regulation of TNFR2 protein expression. NB4 and NB4-R2 cells were either untreated or treated with ATRA (1 μM) for 24 hours. TNFR2 protein expression was examined by FACS using a PE-labeled monoclonal human TNFR2 antibody. (C) Enhanced granulocytic differentiation with combined treatment of RA and TNFα. (D) Effect of RA and TNFα on apoptosis. NB4 and NB4-R2 cells were cultured in media containing ATRA (0.1 μM) alone, TNFα (10 ng/mL) alone, or ATRA plus TNFα for 7 days. Cells were harvested at 0, 2, 4, and 7 days for the analyses of cell differentiation or apoptosis. Granulocytic differentiation was assessed by measuring CD66b expression using FITC-conjugated CD66b antibody by FACS. Apoptosis was measured by FACS following reactions with FITC-conjugated Annexin V and 7-amino-actinomycin (7-AAD). Annexin V-positive and vital dye-negative cells were counted as apoptotic cells. Means and standard deviations from triplicate experiments are represented.
Retinoid-dependent up-regulation of TNFR2, TNFAIP2, and ELF4 genes in APL. (A) TNFR2, TNFAIP2, and ELF4 gene expression in APL patient samples by real-time RT-PCR. Leukemia samples from APL patients (with t(15;17)) were examined for retinoid-dependent regulation of TNFR2, TNFAIP2, and ELF4 genes by real-time RT-PCR using TaqMan probes. Leukemic cells obtained at diagnosis were either untreated or treated with ATRA (1 μM) in vitro for (i) 6 hours or (ii) 2 and 5 days (patient no. 3). Retinoid-dependent up-regulation of gene expression is shown as fold induction. *Where gene expression (in retinoid untreated) is below detectable level, data point was arbitrarily assigned at the lowest linear expression level in the standard curve to calculate the fold-induction. (B) Retinoid-dependent up-regulation of TNFR2 protein expression. NB4 and NB4-R2 cells were either untreated or treated with ATRA (1 μM) for 24 hours. TNFR2 protein expression was examined by FACS using a PE-labeled monoclonal human TNFR2 antibody. (C) Enhanced granulocytic differentiation with combined treatment of RA and TNFα. (D) Effect of RA and TNFα on apoptosis. NB4 and NB4-R2 cells were cultured in media containing ATRA (0.1 μM) alone, TNFα (10 ng/mL) alone, or ATRA plus TNFα for 7 days. Cells were harvested at 0, 2, 4, and 7 days for the analyses of cell differentiation or apoptosis. Granulocytic differentiation was assessed by measuring CD66b expression using FITC-conjugated CD66b antibody by FACS. Apoptosis was measured by FACS following reactions with FITC-conjugated Annexin V and 7-amino-actinomycin (7-AAD). Annexin V-positive and vital dye-negative cells were counted as apoptotic cells. Means and standard deviations from triplicate experiments are represented.
Cooperation between RA and TNFα signaling in APL
FACS analysis indicated that retinoid-dependent up-regulation of TNFR2 protein expression paralleled its mRNA expression in NB4 cells (8.6-fold increase) and in NB4-R2 cells (Figure 5B). To examine functional significance of RA regulation of TNF pathway genes, we examined the potential cooperative effect of RA and TNFα in the induction of differentiation of the APL cell lines NB4 and NB4-R2. We cultured these cells with ATRA, TNFα, or a combination of ATRA and TNFα for 7 days. CD66b expression was used to measure granulocytic differentiation at days 0, 2, 4, and 7 (Figure 5C). Addition of low-dose TNFα (10 ng/mL) to RA (78.4 ± 1.0%) synergistically enhanced granulocytic differentiation compared with RA (41.6 ± 0.9%) or TNFα (15.0 ± 1.7%) alone at 7 days. In contrast, the level of apoptosis with combined treatment (31.2 ± 1.0%) was not significantly different from RA treatment (31.1 ± 4.7%) alone (Figure 5D). Correlating with RA-dependent TNFα pathway gene (TNFR2 and TNFAIP2) expression data, no significant change in the level of differentiation or apoptosis was seen in RA-resistant NB4-R2 cells.
Discussion
The idea that aberrant fusion proteins such as PML/RARα and PLZF/RARα cause the development of APL is well known. However, the target genes and pathways altered by these fusion proteins have not been examined systematically. In addition, target genes of PML/RARα and PLZF/RARα that determine either retinoid sensitivity or resistance are largely unknown. The development of microarray technology enables us to examine the global gene expression profiles of the APL model system.
Our study was performed in a homogeneous cell population, the AML cell line U937. We were able to examine APL fusion gene effects on the background of AML as well as to examine retinoid effects with and without expression of the fusion genes. This type of analysis would not be possible if we had used the APL cell line NB4 cells. Another advantage of this system is that we were able to replicate 3 independent experiments allowing us to generate reproducible data and to run a quantitative statistical analysis. Using a cell line instead of clinical samples also allowed us to have direct comparisons between 2 experimental groups with only one variable, leading to more straightforward interpretation of the data. A potential disadvantage of this in vitro model system is that we used a genetically altered cell line, and our findings may not apply to the clinical situation. To ensure that our findings are not unique to APL fusion protein-expressing U937 cells, we confirmed our microarray data in APL cell lines, NB4 and the retinoid-resistant NB4-R2. NB4-R2 cells express dominant-negative mutant PML/RARα.19 In addition, retinoid-dependent regulation of TNFR2, TNFAIP2, and ELF4 genes was confirmed in APL patient samples using real-time RT-PCR. Validation of our data in patient samples strongly suggests potential clinical applicability of our microarray data.
Hierarchic clustering analysis of the triplicate sets of data (Figure 1) demonstrates that unique gene expression profiles can be generated according to either the presence or absence of APL fusion gene expression as well as retinoid treatment. This type of analysis can be performed with clinical APL samples especially in relapsed cases to predict their retinoid sensitivity according to their gene expression profile. We have also identified that PML/RARα and PLZF/RARα have a variety of common target genes previously uncharacterized (Table 1). Common molecular targets of the APL fusion proteins are responsible for the phenotype of APL. Interestingly, expression of primary granule genes, such as ELA2, LYZ, PRTN3, and MPO, was similarly regulated by both fusion proteins. The design of our study does not permit us to evaluate whether the fusion proteins transcriptionally regulate these target genes. It is possible that these changes are secondary to expression of the APL fusion proteins.
In our APL model, we have identified several interesting apoptosis-related genes targeted by retinoic acid including TNFAIP2, TNFR2, and BCL2. TNFAIP2 (B94) was originally cloned as a TNFα-induced gene in human endothelial cells,20 but subsequent studies identified its expression in hematopoietic tissues and reported that it was inducible by RA in PML/RARα-expressing TF-1 and NB4 cells.21,22 Our study is consistent with a potential role for TNFAIP2 in APL.
Here we show that TNFR2 is strongly down-regulated by APL fusion proteins and up-regulated by RA only in PML/RARα-expressing cells. This retinoid regulation of TNFR2 in retinoid-sensitive APL cells is unique. In contrast, RA does not modulate the expression level of TNFR1.23,24 Data from several systems suggest that TNFR1 p55 and TNFR2 p75 have distinct biologic roles. Although TNFR1 and TNFR2 share significant homology in their extracellular domain, their intracellular sequences are different, suggesting their distinct signaling function.25 TNFR1 contains a so-called death domain that mediates downstream protein interactions critical for cell death, but TNFR2 lacks this domain. Furthermore, TNFR2 has putative roles in secretion of granulocyte-macrophage CSF (GM-CSF) by T lymphocytes and myeloid differentiation.26,27
Confirmation of our data on APL patient samples further strengthens potential applicability of our results to clinical situations. Interestingly, combined treatment with RA and TNFα synergistically enhanced granulocytic differentiation in NB4 but not in NB4-R2 cells, suggesting cooperation between RA and TNFα signaling pathways (Figure 5C). In contrast, level of apoptosis with combined treatment was not significantly changed between different treatment groups (Figure 5D). These results are consistent with findings from prior studies that TNFα may promote granulocytic differentiation in CD34+ cord blood cells.28 Our study suggests that regulation of differentiation and apoptosis are closely linked and that therapeutically targeting both pathways may be helpful in the treatment of APL.
ELF4 is a member of the E74 family of ETS (E26-specific) proteins also known as myeloid elf-1-like factor (MEF). ELF4 binds to ETS binding sites in the GM-CSF and IL-3 promoters augmenting their transactivation.29,30 Furthermore, ELF4 and AML1b synergistically transactivate the IL-3 promoter, suggesting a role for ELF4 in regulation of myeloid differentiation. AML1/ETO dominantly represses the transactivating activity of ELF4. Repression of ELF4 expression by both APL fusion proteins observed in this study as well as by AML1/ETO suggests the importance of dysregulation of ELF4 expression in both types of AML.
In a “2-hit” model of leukemogenesis,31 development of acute leukemias requires 2 broad classes of mutations: one involves an activating mutation in signaling molecules that provide a survival advantage, and the other involves a loss of function mutation in transcription factors critical for the regulation of differentiation. Traditionally, PML/RARα has been considered to be an oncogenic transcription factor that represses the differentiation of specific genes. However, our data show that APL transformation involves global gene expression changes in many different pathways. In retinoid-sensitive APL, these expression changes are reversed by pharmacologic doses of RA. We show that PML/RARα and PLZF/RARα share many common target genes and pathways in the leukemic transformation of hematopoietic progenitor cells. These APL fusion proteins repress genes that are not only critical in the regulation of granulocytic differentiation such as C/EBPs but genes that are also essential for cell death and survival, such as BCL2 and TNFR2. Temporally coordinated regulation of pro- and antiapoptosis genes is tightly linked to the regulation of cell differentiation. We hypothesize that a retinoid-induced balance between signals supporting cell death and survival allows cells to undergo terminal differentiation followed by their ultimate cell death. Retinoid regulation of some of these genes is clearly disparate in retinoid-sensitive (PML/RARα) compared with retinoid-resistant (PLZF/RARα) cells. Targeting both retinoid-dependent differentiation pathways as well as cell death pathways may improve leukemic therapy, especially in retinoid-resistant acute myeloid leukemia.
Prepublished online as Blood First Edition Paper, July 31, 2003; DOI 10.1182/blood-2003-02-0412.
Supported by grants from the National Institutes of Health, Parker Hughes Trust, and Joseph Troy Fund. H.P.K. is a member of the Jonsson Comprehensive Cancer Center and Molecular Biology Institute at UCLA and holds an endowed Mark Goodson Chair of Oncology Research at Cedars-Sinai Medical Center.
The publication costs of this article were defrayed in part by page charge payment. Therefore, and solely to indicate this fact, this article is hereby marked “advertisement” in accordance with 18 U.S.C. section 1734.


