Abstract
Enterohemorrhagic Escherichia coli (EHEC) is the major cause of hemolyticuremic syndrome (HUS) characterized by microangiopathic hemolytic anemia, thrombocytopenia, and acute renal failure. EHEC produces one or more Shiga toxins (Stx1 and Stx2), and it was assumed that Stx's only relevant biologic activity was cell destruction through inhibition of protein synthesis. However, recent data indicate that in vivo the cytokine milieu may determine whether endothelial cells survive or undergo apoptosis/necrosis when exposed to Stxs. In this study, we analyzed the genome-wide expression patterns of human endothelial cells stimulated with subinhibitory concentrations of Stxs in order to characterize the genomic expression program involved in the vascular pathology of HUS. We found that Stxs elicited few, but reproducible, changes in gene expression. The majority of genes reported in this study encodes for chemokines and cytokines, which might contribute to the multifaceted inflammatory response of host endothelial cells observed in patients suffering from EHEC disease. In addition, our data provide for the first time molecular insights into the epidemiologically well-established higher pathogenicity of Stx2 over Stx1.
Introduction
Enterohemorrhagic Escherichia coli (EHEC) is a major cause of serious outbreaks and sporadic cases of hemorrhagic colitis (HC) and hemolytic-uremic syndrome (HUS).1,2 Shiga toxin 2 (Stx2)–producing EHEC strains are more frequently associated with severe complications, such as HC and HUS.3-6 HUS is a systemic disease characterized by thrombotic microangiopathy (TMA) in affected organs,3,7 including kidneys, brain, and gastrointestinal tract. Because EHEC is a noninvasive pathogen, it is proposed that Stxs gain access to the systemic vasculature from the gut lumen and cause damage to endothelial cells in target organs,8 such as kidneys and central nervous system. Our understanding of these extraintestinal manifestations is still limited, and, for many years, it was assumed that the only relevant biologic activity of Stx was destruction of cells through inhibition of protein synthesis.9 Recently, however, several authors have described that treatment of various cell types with Stxs leads to increased mRNA levels as well as protein expression of chemokines10 and cell adhesion molecules.11 C-X-C chemokines are involved in the chemoattraction and activation of neutrophils, while cell adhesion molecules mediate binding of inflammatory cells to the endothelium.12 These findings indicate the important role of Stxs in inducing a multifaceted host inflammatory response. The inflammatory response of host endothelial cells seems to be a crucial step for developing the vascular damage observed in EHEC infection,3 ultimately resulting in TMA and HUS. Even subinhibitory concentrations of toxins, exerting minimal influence on protein synthesis, were able to increase select mRNA transcript levels in endothelial cells very effectively, shown by Bitzan et al.13 These observations prompted us to investigate the regulatory effects of such concentrations of both Stx1 and Stx2 on human endothelial cells, using gene expression analysis arrays.
Furthermore, our interest was focused on identifying potential differences between the mode of action of Stx1 and Stx2 that could explain the high incidence of Stx2 producing E coli in patients with severe disease. Array data of selected genes were confirmed with real-time reverse-transcriptase polymerase chain reaction (RT-PCR). Whenever possible, expression of the corresponding proteins was assessed using enzyme-linked immunosorbent assay (ELISA), cytometric bead array (CBA),14 or fluorescence-activated cell sorter (FACS) analysis.
The present study surprisingly shows that only a limited subset of genes is regulated. Most of them belong to chemokines and cytokines. Other genes encode for cell adhesion molecules and transcription factors that are involved in immune response or apoptosis. These data indicate that subinhibitory concentrations of Stxs play an important role in inducing inflammatory responses of host endothelial cells. Such response patterns might well contribute to EHEC pathogenesis beyond the cytotoxic effects of Stxs caused by inhibition of protein biosynthesis in affected cells. The data presented also provide an explanation for the augmented pathogenicity of Stx2 over Stx1.
Materials and methods
Stx purification
Stxs were purified on affinity columns according to a protocol described by Donohue-Rolfe et al15 with minor modifications. Liquid cultures of Stx2 producing EHEC strain 86-2416 and Stx1 expressing isolate EDL 97317 were grown in 5 liters of Luria-Bertani medium. After 4 hours of incubation, 0.4 mg/L mitomycin C (Sigma-Aldrich, Taufkirchen, Germany) was added to enhance Stx release from the bacteria, followed by 20 hours of incubation. Each culture was then centrifuged for 15 minutes at 16 000g (4°C), and the supernatant was retained and sterile filtrated. A 70% ammonium sulfate precipitate of the supernatant was made and spun down for 10 minutes at 16 000g (4°C). The precipitate was dissolved in water and dialyzed against 10 mM Tris (tris(hydroxymethyl)aminomethane, pH 7.4) for 48 hours. The protein solution was then applied to an affinity column where a glycoprotein (B1011; Glycorex AB, Lund, Sweden; 200 μg/mL), containing a terminal galabiose bound to bovine serum albumin (BSA), acted as toxin receptor analog and was coupled to cyanogen bromide–activated Sepharose 4B (Pharmacia, Uppsala, Sweden) according to the manufacturer's protocol. The column was washed with 30 mL buffer (10 mM phosphate-buffered saline [PBS] pH 7.4, 1 M NaCl). For elution of toxin, a 4.5 M MgCl2 solution was applied to the column with a gradient mixer. Pure Stx eluates showing 2 distinct bands on silver-stained sodium dodecyl sulfate (SDS) gels were pooled. To concentrate the toxin and remove MgCl2, pooled samples were centrifuged over a Microcon YM-30 Centrifugal Filter Device (Millipore, Schwalbach, Germany) and washed repeatedly with 50 mL double distilled (dd) H2O. A mock toxin preparation for incubation of control cells was made the same way, using liquid cultures of E coli TUV86-2, an isogenic Stx2-negative knock-out mutant of EHEC 86-24.18
SDS polyacrylamide gel electrophoresis and Western blot analysis
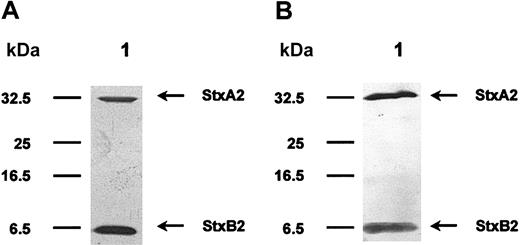
Stxs were separated on 15% SDS polyacrylamide gels (SDS-PAGE) using the Laemmli19 buffer system. For subsequent analysis of protein preparations, gels were stained with silver nitrate20,21 (Figure 1A). Proteins were then electrotransferred onto nitrocellulose membranes using a semidry blotting system from Biometra (Goettingen, Germany) and probed with either rabbit or pig polyclonal sera (diluted 1:2000) against Stx1 or Stx2. Bound primary antibodies were detected with alkaline phosphatase–labeled secondary antibodies and visualized with bromo choloro indolyl phosphate/nitroblue tetrazolium (BCIP/NBT; Roche Diagnostics, Mannheim, Germany) as substrate/color reagent (Figure 1B).
SDS-PAGE and Western blotting of purified Stx2. Stx2 holotoxin was purified by affinity chromatography using a receptor analog. In panel A, a silver-stained SDS gel is shown. The cytotoxic A-subunit has a molecular mass of 32 kDa and monomeric B-subunits are separated at 7 kDa. Panel B pictures a Western blot analysis of this toxin molecule, using polyclonal rabbit anti-Stx2 antibodies. The protein preparation is free of any visible contamination.
SDS-PAGE and Western blotting of purified Stx2. Stx2 holotoxin was purified by affinity chromatography using a receptor analog. In panel A, a silver-stained SDS gel is shown. The cytotoxic A-subunit has a molecular mass of 32 kDa and monomeric B-subunits are separated at 7 kDa. Panel B pictures a Western blot analysis of this toxin molecule, using polyclonal rabbit anti-Stx2 antibodies. The protein preparation is free of any visible contamination.
LPS quantification
Quantification of lipopolysaccharide (LPS) in Stx preparations and the mock toxin was carried out using Endosafe Limulus Amebocyte Lysate (LAL) test, which gives the opportunity to quantify the amount of endotoxin photometrically, from Charles River Laboratories (Sulzfeld, Germany),. End-point method, following the protocol supplied by the manufacturer, was used to determine LPS concentration in each toxin preparation used in subsequent experiments.
Human umbilical vein endothelial cells (HUVECs)
Human endothelial cells were provided by CellSystems (St Katharinen, Germany) and cultured in Endothelial Cell Growth Medium BulletKit-2 (CellSystems), containing all required supplements. Cells were maintained in 95% air/5% CO2 at 37°C. Stxs were added to confluent monolayers of HUVECs at 1/10 median lethal dose (LD50) diluted in dd H2O. Negative controls were incubated with an identical volume of mock toxin, which had been analyzed by SDS-PAGE and tested for cytotoxic activity.
Cytotoxicity assay
Cytotoxic activity of Stx preparations and the mock toxin was measured with the Cytotoxicity Detection Kit from Roche Diagnostics, which is based on detection of lactate dehydrogenase (LDH) activity released from damaged cells. When LDH is present in the culture supernatant, a color reaction is induced by cleavage of a tetrazolium salt. HUVECs were incubated with serial dilutions from 50 μg/mL to 10 pg/mL of the 2 protein toxins for 48 hours in a 96-well micro plate (Greiner Bio-One, Frickenhausen, Germany). After incubation, the plate was centrifuged and from each well 100 μL cell-free culture supernatant was transferred to another micro plate. Substrate mixture was then added and incubated at room temperature for 30 minutes. Absorbance was measured at 492 nm using an ELISA plate reader (Titertek Multiscan Ascent; Dunn Labortechnik, Asbach, Germany). Triton X-100, which induces complete cell lysis, was used as positive control. Supernatants from untreated cells were used as low control. All tests were performed in triplicate and were repeated once.
Immunohistochemistry
Slides with HUVEC cytospins were fixed in ice-cold acetone at –20°C for 10 minutes and air dried. After blocking endogenous biotin by incubation with avidin and biotin (Vector Laboratories, Burlingame, CA), the slides were incubated with a monoclonal rat antihuman CD77 immunoglobulin M (IgM) antibody (Beckman Coulter, Unterschleissheim, Germany; clone 38-13, diluted 1:10), which specifically recognizes the terminal galabiose residue from the Stx receptor Gb3Cer. A biotinylated rabbit antirat IgM (Dianova, Hamburg, Germany; diluted 1:250) served as secondary antibody and was detected with an alkaline phosphatase–conjugated streptavidin complex (DAKO, Hamburg, Germany). Fast red (Sigma-Aldrich) served as substrate and hemalaun as counterstain. Cells were washed thoroughly with buffer (0.1 M Tris-HCl, 0.15 M NaCl, 0.05% Tween 20) after each incubation step. Appropriate negative controls without primary antibody were processed in parallel.
Transmission electron microscopy: preparation of Stx2 protein-coated colloidal gold particles
Adjusted with 25 mM K2CO3 to pH 6.2 was 5 mL of a colloidal gold-particle solution (20 nm in size; BioCell, Cardiff, United Kingdom). Then, 5 μL Stx2 protein (10 mg/mL stock solution) was added to 5 mL of the colloidal gold solution and incubated for 30 minutes at room temperature. Stx2 gold complexes were centrifuged at 20 000 rpm for 15 minutes in a Beckman TLD100 (Beckman Coulter). The resulting red pellet was gently resuspended in PBS buffer containing 2 mg/mL polyethyleneglycol (PEG 20 000; Mallinckrodt Baker, Griesheim, Germany) for stabilization of protein-gold complexes. Negative staining revealed more than 90% single Stx2 gold particles. For incubation of control cells, gold particles were coated with BSA (7 μg BSA/mL gold-particle solution).
Incubation of HUVECs with Stx2 gold particles and embedding
Subconfluent monolayers of HUVECs were grown in 6-cm petri dishes and incubated with Stx2 gold particles (1:20 dilution of the stock solution) or BSA gold particles (1:20 dilution of the stock solution). At different time points the endothelial cells were fixed with a fixation solution containing 2% glutaraldehyde and 3% formaldehyde in cacodylate buffer for one hour on ice. After several washing steps with cacodylate buffer, cells were further fixed and contrasted with 1% aqueous osmium tetroxide for 2 hours at room temperature, and subsequently washed with cacodylate buffer. Cells were scraped off the petri dish and pelleted. Embedding in Spurr resin was done according to described procedures.22
RT-PCR
RNA was extracted using TriFast FL (peqLab, Erlangen, Germany) according to the manufacturer's protocol, and reversely transcribed with 200 U Moloney murine leukemia virus (M-MLV) reverse transcriptase (Gibco, Karlsruhe, Germany) for 45 minutes at 42°C in 20-μL assays containing 1 μL Oligo dT-primers (Gibco) and 10 mM deoxynucleoside triphosphates (dNTPs), following the manufacturer's instructions. The reaction was stopped by adding 40 μL Tris–ethylenediaminetetraacetic acid (EDTA) buffer (pH 8.0) and performing heat inactivation for 10 minutes at 90°C. Table 1 provides all genes with corresponding primers (synthesized by MWG-Biotech, Ebersberg, Germany) used for conventional and realtime PCR. Conventional PCR was performed with 0.5 U BioThermStar Klen Taq polymerase (GENECRAFT, Muenster, Germany) in 20 μL-assays containing 0.25 pmol primers and 0.5 mM dNTP using the following cycling conditions: activation of Taq polymerase for 7 minutes at 95°C, followed by 35 cycles each consisting of a 10-second denaturing interval at 94°C, a 20-second annealing step at 54/58°C (depending on primer Tm), and a primer extension at 72°C for 20 seconds. Amplification was finished with a final extension at 72°C for 5 minutes. PCR products were resolved by electrophoresis on 2.0% agarose gels and visualized by ethidium-bromide staining.
Incubation of HUVECs with Stxs and labeling of RNA
HUVECs were grown to confluence in 75 cm2 flasks. Cell culture medium was replaced prior to adding 1/10 LD50 of Stx1 or Stx2 to 2 flasks each. Another 2 flasks were kept as control. Cells were incubated at 37°C for either 4 hours or 24 hours and immediately used for RNA isolation. Total RNA was extracted using TriFast FL (peqLab) as described by the manufacturer. RNA was converted to double-stranded cDNA using a modified oligo-dT primer with a 5′ T7 RNA polymerase promoter sequence and the Superscript Choice System (Gibco) for cDNA synthesis. Double-stranded cDNA was purified by phenol-chloroform extraction and ethanol precipitation. Then, in vitro biotin-labeled cRNA transcription was performed using T7 RNA polymerase and the cDNA template in the presence of a mixture of unlabeled nucleotides (adenosine triphosphate [ATP], cytidine triphosphate [CTP], guanosine triphosphate [GTP], and uridine triphosphate [UTP]) and biotin-labeled CTP and UTP (BioArray High Yield RNA Transcript Labeling Kit; Enzo Diagnostics, Farmingdale NY). Biotin-labeled cRNA was then purified on microspin columns provided with the RNeasy Mini Kit from QIAGEN (Hilden, Germany) and fragmented according to the Affymetrix (Santa Clara, CA) protocol. The amount of labeled cRNA was determined by measuring absorbance at 260 nm.
Hybridization and scanning of gene expression analysis arrays
To monitor the relative abundance of mRNA for full-length human genes, the Affymetrix GeneChip HuGeneFL (6800 genes) system was used for Stx1 experiments and HG_U95v2 (12 488 genes) for Stx2 experiments. All regulated genes shown in Table 2 were present on both types of Affymetrix GeneChips. Labeled cRNA, fragmented to an average size of 100 to 150 bases, was hybridized to the GeneChips. The cRNA fragments were heated in a hybridization solution to 99°C for 5 minutes and then cooled at 45°C for 5 minutes before being injected into the Affymetrix reaction chamber. Hybridization was carried out at 45°C for 16 hours after which arrays were washed in an automated Affymetrix fluidic station. Hybridized cRNA was fluorescently labeled by adding streptavidin-phycoerythrin (Molecular Probes, Eugene, OR) as previously described by Lockhart et al.23 Unbound streptavidin-phycoerythrin was removed by rinsing the probe arrays at room temperature. Stained arrays were scanned at 488-nm excitation wavelength in a Hewlett-Packard Gene Array Scanner (Agilent Technologies, Palo Alto, CA). A complete list of genes present on HuGeneFL and on HG_U95v2 can be found in the Affymetrix database at http://www.affymetrix.com/analysis/index.affx.
Data analysis
Data were analyzed using Affymetrix Microarray Suite 5.0. Using the Affymetrix Data Mining Tool (DMT), gene expression was evaluated and genes with at least a 2-fold or greater change in signal intensity in 2 independent experiments were considered regulated. In the DMT, P values were set to less than .001 for up-regulated genes and set to more than .999 for down-regulated ones (no down-regulated genes in our experiments).
Quantitative real-time RT-PCR
Quantitative real-time PCR was performed from 2 independent experiments with a GeneAmp 5700 Sequence Detection System (Applied Biosystems, Weiterstadt, Germany) to quantify mRNA levels of selected genes. Amplifications were run in 50-μL assays with the TaqMan Universal Master Mix (Applied Biosystems) containing SYBR-Green and PCR core reagents, according to the manufacturer's protocol. The cycling program was as follows: initial annealing for 2 minutes at 50°C followed by activation of Taq polymerase for 10 minutes at 95°C. Then, 40 amplification cycles of a 15-second denaturing interval at 95°C and a one-minute annealing step at 54/58°C (depending on primer Tm) were run. Standard curves were generated using serially diluted cDNA probes. The RPS9 housekeeping gene24 was used for normalization.
Flow cytometry
Monoclonal antibodies (mAbs) directed against the following molecules were used for staining: CD31 (platelet endothelial cell adhesion molecule, PECAM-1), CD34, CD54 (intercellular adhesion molecule-1), CD62E (E-selectin), CD62P (P-selectin), CD106 (vascular cell adhesion molecule-1, VCAM-1), CLA (cutaneous lymphocyte-associated antigen), and isotype. Antibodies were purchased from BD PharMingen (Heidelberg, Germany) and Immunotech (Unterschleissheim, Germany). Stimulated and unstimulated HUVECs were removed from flasks using Accutase (Innovative Cell Technologies, San Diego, CA) and stained in NUNC round-bottom 96-well plates (Fisher Scientific, Nidderau, Germany) (2 × 10⁵ cells/well) in 20 μL of mAb in PBS/2% fetal calf serum (FCS) for 20 minutes on ice. Single-color immunocytometry was performed with a FACSCalibur flow cytometry system (BD Biosciences, Heidelberg, Germany). Each antibody was tested in 3 independent experiments. Aquired data were analyzed using the WinMDI 2.8 software package (www.facs.scripps.edu/software.html; Scripps Institute, La Jolla, CA).
Cytometric bead array (CBA)
The CBA consists of a series of spectrally discrete particles that can be used to detect soluble analytes by flow cytometry. Microparticles with covalently bound antibodies, as previously described by Chen et al,14 were purchased from Becton Dickinson (Heidelberg, Germany). Briefly, polystyrene beads (7.5-μm diameter) are dyed to 6 different fluorescence intensities, which have an emission wavelength of approximately 650 nm (FL-3). Each group carries antibodies against one of the 6 following cytokines: IL-1β (interleukin 1β), IL-6 (interleukin 6), IL-8 (interleukin 8), IL-10 (interleukin 10), IL-12p70 (interleukin 12p70), TNF-α (tumor necrosis factor α), representing a unique population in FL-3 intensity. The Ab-labeled particles serve as capture for a given cytokine in the immunoassay panel and can be identified simultaneously in a mixture. The captured cytokines are then detected using 6 specific antibodies coupled to phycoerythrin (PE), which emits its fluorescence at approximately 585 nm (FL-2). Predefined mixtures of all 6 cytokines served as calibrators (standards ranging from 0 to 5000 pg/mL) for the assay system. Added to a mixture of each 50-μL capture Ab-bead reagent and detector Ab-PE reagent was 50 μL of sample or cytokine standard. The mixture (150 μL) was incubated for 3 hours at room temperature and washed to remove unbound detector Ab-PE reagent before data acquisition using flow cytometry. Using a FACSCalibur flow cytometer, 2-color flow cytometric analysis was performed. Acquired data obtained from 3 independent experiments were analyzed using Becton Dickinson Cytometric Bead Array software.
GM-CSF, GRO-1, and MCP-1 ELISA
Granulocyte-macrophage colony-stimulating factor (GM-CSF), GRO-1, and MCP-1 proteins in supernatants of control cells and cells treated with Stxs were quantified by enzyme immunoassay using standards ranging from 7.8 to 500 pg/mL (GM-CSF) and from 15.6 to 1000 pg/mL (GROα and MCP-1) according to the manufacturer's protocol (Quantikine Human GM-CSF and Human GROα Immunoassay from R&D Systems, Wiesbaden, Germany; and Human MCP-1 OptEIA Kit from BD Biosciences). Tissue culture supernatants from 3 independent experiments were used for ELISA testing.
Results
Isolation of Stxs and cytotoxicity testing
Using receptor affinity chromatography, we managed to isolate highly pure Stx preparations, with no contaminations as documented by SDS-PAGE and Western blotting. In Figure 1A, purified Stx2 is exemplified, separated on an SDS gel, and visualized with silver stain. The A-subunit has a molecular mass of 32 kDa and monomeric B-subunits are resolved at 7.7 kDa. Identity of Stx2 protein was confirmed with Western blot analysis, as shown in Figure 1B. Purity of Stx1 preparations was comparable. All toxin preparations contained only very low amounts of lipopolysaccharide ranging from 2.0 to 2.4 EU/mL, which equals 0.20 to 0.24 ng LPS/mL of concentrated protein solution. LPS concentration in the mock toxin preparation, used for incubation of control cells, was comparable. Therefore, an influence of bacterial lipopolysaccharide on the regulatory phenomena observed in the following cell culture assays was excluded. Evaluation of cytotoxic activity of the 2 different Stxs resulted in LD50 values of approximately 3 μg/mL for Stx1 and approximately 4 μg/mL for Stx2. The mock toxin was neither cytotoxic nor did it contain any stainable protein.
Distribution of Stx receptors on HUVECs and cellular uptake of Stxs
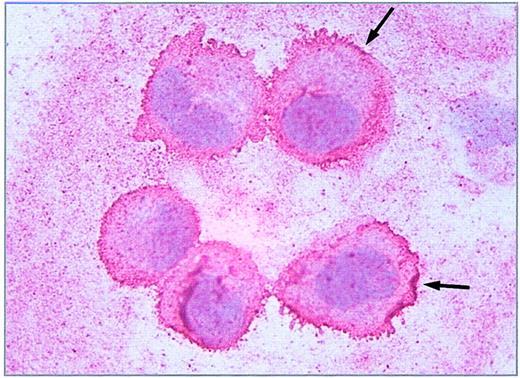
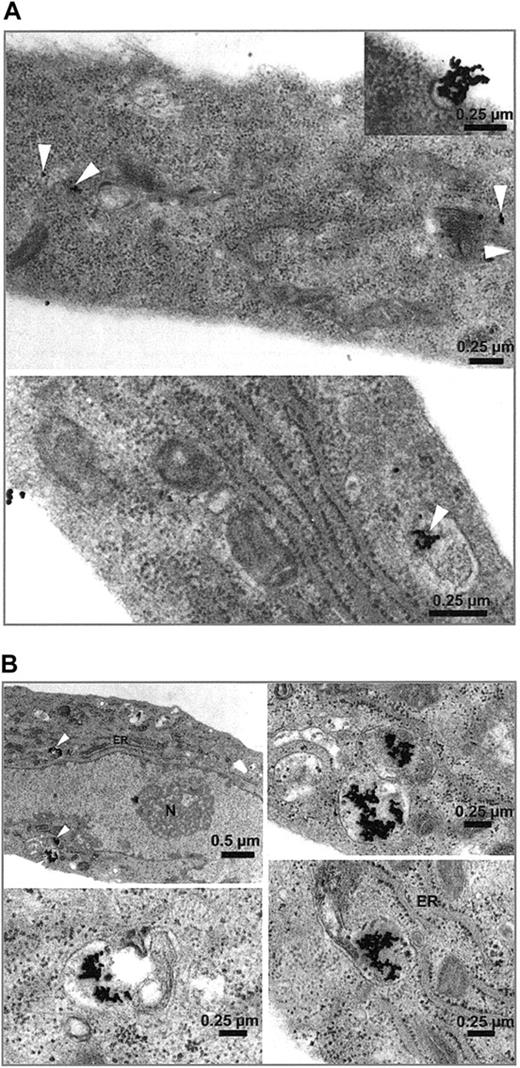
Immunohistochemistry of HUVECs showed a dense seam of Stx receptors at the cell surface, demonstrated by the intense red linear membrane stain shown in Figure 2. Incorporation of gold-labeled Stx was observed in endothelial cells as early as 15 minutes after administration. Differences in toxin uptake between Stx1 and Stx2 could not be determined, with regard to amount of toxin and time kinetic. No uptake of BSA gold particles was observed with the control cells (not shown). In Figure 3, HUVECs are shown after incubation with Stx2 for 1 hour (Figure 3A) and 4 hours (Figure 3B). After 4 hours the toxin has almost entirely been endocytosed by the cells.
Immunostaining of Stx receptors. Immunohistochemical detection of the Stx receptor Gb3/CD77 on 5 single endothelial cells (HUVEC) immobilized onto glass slides by cytocentrifugation was performed with avidin biotin complex technique using a monoclonal rat antihuman CD77 primary antibody. Binding of the antibody is pictured as a red linear membrane stain (arrows, × 630).
Immunostaining of Stx receptors. Immunohistochemical detection of the Stx receptor Gb3/CD77 on 5 single endothelial cells (HUVEC) immobilized onto glass slides by cytocentrifugation was performed with avidin biotin complex technique using a monoclonal rat antihuman CD77 primary antibody. Binding of the antibody is pictured as a red linear membrane stain (arrows, × 630).
Uptake of gold-labeled Stx2. HUVECs treated with gold-labeled Stx2 were fixed after 1 hour (A) and 4 hours (B) and scanned with a transmission electron microscope. Black beads, marked intracellularly with white arrowheads, correspond to gold-labeled Stx2. Uptake of Stx2 and intracellular distribution after one hour is visualized in panel A. At 4 hours most of the toxin is detected intracellularly as shown in panel B. ER indicates endoplasmic reticulum; N, nucleus.
Uptake of gold-labeled Stx2. HUVECs treated with gold-labeled Stx2 were fixed after 1 hour (A) and 4 hours (B) and scanned with a transmission electron microscope. Black beads, marked intracellularly with white arrowheads, correspond to gold-labeled Stx2. Uptake of Stx2 and intracellular distribution after one hour is visualized in panel A. At 4 hours most of the toxin is detected intracellularly as shown in panel B. ER indicates endoplasmic reticulum; N, nucleus.
Array analysis
Gene expression analysis performed on HUVECs after incubation with 1/10 LD50 Stx1 or Stx2 for 4 hours and 24 hours revealed that only a small number of genes was regulated, despite the fact that the microarrays we had used represented 6800 (Stx1 experiments: 9 genes regulated after 4 hours and 20 genes regulated after 24 hours) and 12 488 (Stx2 experiments: 15 genes regulated after 4 hours and 24 hours) human genes. Most of them belonged to chemokines and cytokines. Other genes encoded for cell adhesion molecules and transcription factors that are involved in immune response or apoptosis. Table 2 shows the ratio of gene expression in HUVECs treated with each toxin compared with untreated control cultures. In our experiments, only up-regulation of genes was observed. The highest increase in mRNA levels was found for IL-8, GRO-1, and GRO-2 after treatment with either one of the 2 toxins. A group of genes was exclusively regulated by incubation with Stx2, among these the coding sequences for IL-6, IL-16, MCP-1, and NFκB2. This toxin molecule also had a marked effect on up-regulation of CSF2 and ICAM1 genes after 4 hours and 24 hours, while Stx1 led to only a moderately increased gene expression after 24 hours. In contrast, EGR-1, FOS, and JUNB mRNA were expressed only after Stx1 treatment. Regulation of genes encoding GRO-3, LAMB3, tumor necrosis factor, α-induced protein 3 (TNFαIP-3) and TRAF-1 was first observed after incubation for 24 hours with both toxins, as opposed to zinc finger protein 36 (ZFP36), which was induced at 4 hours but did not reveal any gene expression after 24 hours.
Quantitative real-time RT-PCR
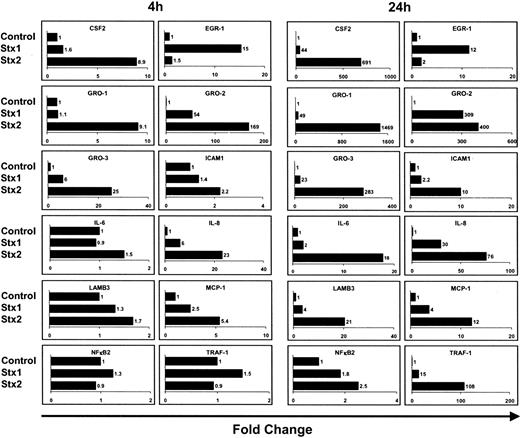
Regulatory effects observed by array analysis were further studied by real-time RT-PCR for 12 selected genes. For these experiments, HUVECs were treated with Stxs the same way as they were for array analyses. Real-time RT-PCR data are presented in Figure 4. As a rule, array data could be confirmed by quantitative real-time RT-PCR for CSF2, EGR-1, ICAM1, IL-6, IL-8, LAMB3, NFκB2, and TRAF-1. However, real-time RT-PCR analysis revealed that MCP-1 was also regulated in cells treated with Stx1, which was in marked contrast to array data. Furthermore, the pattern of regulation between the different members of the GRO family differed from the data obtained by microarray analysis. MCP-1 and GRO-1 were therefore further studied at the protein level.
Quantification of gene expression by real-time RT-PCR. Quantitative real-time RT-PCR of 12 genes was performed after 4 hours and 24 hours of incubation with Stxs. Data shown were obtained from 2 independent experiments. CSF2 indicates colony-stimulating factor 2 (granulocyte-macrophage); EGR-1, early growth response 1; GRO-1, GRO-1 oncogene; GRO-2, GRO-2 oncogene; GRO-3, GRO-3 oncogene; ICAM1, intercellular adhesion molecule-1; IL-6, interleukin 6; IL-8, interleukin 8; LAMB3, laminin beta 3; MCP-1, monocyte chemotactic protein 1; NFκB2, nuclear factor of kappa light polypeptide gene enhancer in B cells 2; and TRAF-1, TNF receptor–associated factor 1.
Quantification of gene expression by real-time RT-PCR. Quantitative real-time RT-PCR of 12 genes was performed after 4 hours and 24 hours of incubation with Stxs. Data shown were obtained from 2 independent experiments. CSF2 indicates colony-stimulating factor 2 (granulocyte-macrophage); EGR-1, early growth response 1; GRO-1, GRO-1 oncogene; GRO-2, GRO-2 oncogene; GRO-3, GRO-3 oncogene; ICAM1, intercellular adhesion molecule-1; IL-6, interleukin 6; IL-8, interleukin 8; LAMB3, laminin beta 3; MCP-1, monocyte chemotactic protein 1; NFκB2, nuclear factor of kappa light polypeptide gene enhancer in B cells 2; and TRAF-1, TNF receptor–associated factor 1.
Flow cytometry and protein assays
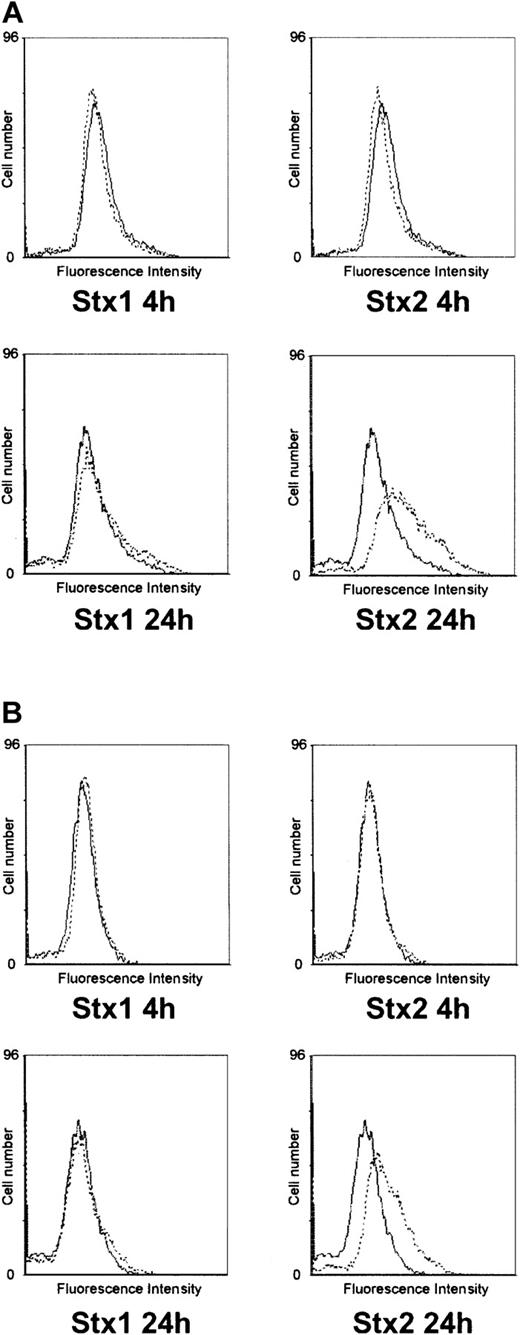
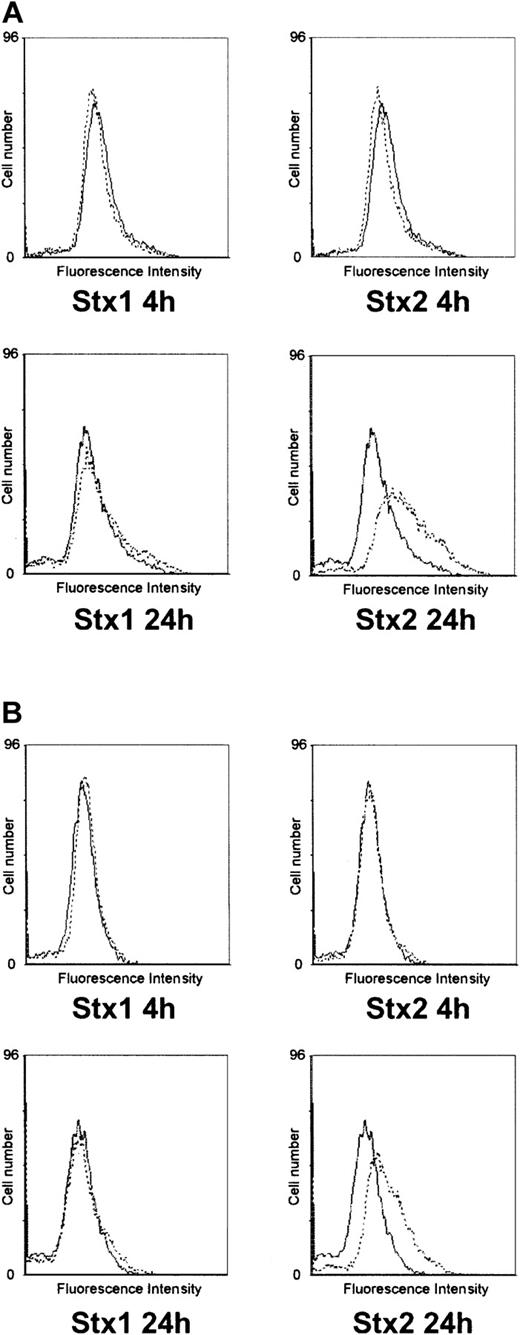
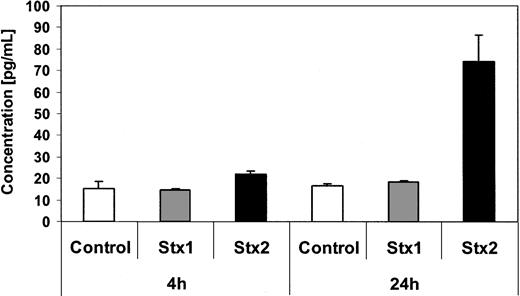
Investigation of HUVECs treated with Stxs by flow cytometry showed expression of ICAM1 and CD62P on the cell surface exclusively after incubation with Stx2 for 24 hours (Figure 5A-B). FACS analysis with antibodies directed against CD31, CD34, CD62E, CD106, and CLA antigens showed no difference between control cells and HUVECs incubated with Stxs (data not shown). CBA analysis revealed increased levels of IL-6 and IL-8 after 24 hours in cell culture supernatants of HUVECs treated with Stx1 as well as with Stx2, as shown in Figure 6A-B. In contrast, IL-1β, IL-10, IL-12p70, or TNF-α could not be detected either in supernatants of control cells or in cell culture media of HUVECs treated with either one of the 2 Stxs (data not shown). GM-CSF expression of HUVECs was elevated only after treatment with Stx2, leading to a slight raise after 4 hours and a 4-fold increase after 24 hours, compared with control cells (Figure 7). Furthermore, both Stxs induced higher expression levels of GRO-1 and MCP-1 protein in cell culture supernatants after 24 hours, with Stx2 having a greater impact than Stx1, as shown in Figure 8A-B.
Flow cytometric analysis of CD54 and CD62P expression on HUVECs. In panel A, surface expression of CD54 (intercellular adhesion molecule-1) upon treatment with Stx1 or Stx2 for 4 hours and 24 hours is illustrated (dashed lines) in comparison with untreated control cells (solid lines). The same layout is used in panel B for presentation of flow cytometric data obtained with a CD62P (P-selectin)–specific antibody. The data shown represent 3 independent experiments.
Flow cytometric analysis of CD54 and CD62P expression on HUVECs. In panel A, surface expression of CD54 (intercellular adhesion molecule-1) upon treatment with Stx1 or Stx2 for 4 hours and 24 hours is illustrated (dashed lines) in comparison with untreated control cells (solid lines). The same layout is used in panel B for presentation of flow cytometric data obtained with a CD62P (P-selectin)–specific antibody. The data shown represent 3 independent experiments.
Quantification of IL-6 and IL-8 secretion by CBA analysis. Interleukin-6 (A) and interleukin-8 (B) concentrations in tissue culture supernatants of control cells and HUVECs incubated with Stx1 or Stx2 for 4 hours and 24 hours, measured by cytometric bead array. Data are presented as mean from 3 independent experiments.
Quantification of IL-6 and IL-8 secretion by CBA analysis. Interleukin-6 (A) and interleukin-8 (B) concentrations in tissue culture supernatants of control cells and HUVECs incubated with Stx1 or Stx2 for 4 hours and 24 hours, measured by cytometric bead array. Data are presented as mean from 3 independent experiments.
Quantification of GM-CSF secretion by ELISA. GM-CSF levels in tissue culture supernatants from endothelial cells with and without Stx treatment for 4 hours and 24 hours were quantified by ELISA. Data are presented as mean from 3 independent experiments.
Quantification of GM-CSF secretion by ELISA. GM-CSF levels in tissue culture supernatants from endothelial cells with and without Stx treatment for 4 hours and 24 hours were quantified by ELISA. Data are presented as mean from 3 independent experiments.
Quantification of GRO-1 and MCP-1 secretion by ELISA. Concentration of GRO-1 oncogene (A) and MCP-1 chemotactic factor (B) are measured by ELISA in culture supernatants of controls and human endothelial cells treated with Stx1 or Stx2 holotoxin for 4 hours and 24 hours. Data are presented as mean from 3 independent experiments.
Quantification of GRO-1 and MCP-1 secretion by ELISA. Concentration of GRO-1 oncogene (A) and MCP-1 chemotactic factor (B) are measured by ELISA in culture supernatants of controls and human endothelial cells treated with Stx1 or Stx2 holotoxin for 4 hours and 24 hours. Data are presented as mean from 3 independent experiments.
Discussion
Enterohemorrhagic E coli, a highly contagious pathogen that has the capacity to cause individual cases of severe illness as well as large outbreaks, carries several pathogenicity factors, among which a family of potent cytotoxins called Stx1 and Stx2 are of key importance.3 Vascular lesions, described as thrombotic microangiopathy, are the morphologic hallmark of HUS,7 the most severe clinical manifestation of EHEC disease. For many years, it was assumed that the only relevant biologic activity of Stx was the destruction of cells through inhibition of protein synthesis.9,11 However, 4 years ago Bitzan et al reported that Stxs potently increased select mRNA transcript levels in endothelial cells at concentrations that had minimal effects on protein synthesis.13 Based on these observations, we incubated human endothelial cells with 1/10 LD50 of Stx1 and Stx2 to investigate genome-wide response patterns using gene expression analysis arrays. Furthermore, such subinhibitory toxin concentrations are also very likely to correspond to the situation in human EHEC disease, since concentrations of Stxs in patient sera are expected to be low25 and antibodies against these proteins are not consistently produced.26,27 To verify a regulatory effect of the chosen toxin concentration, we performed RT-PCR with primers specific for the human IL-8 gene, prior to array analysis. HUVECs exhibited a strong regulation of this gene, comparable with data reported by Thorpe et al for intestinal epithelial cells.28
Another goal of our study was to decipher potential differences between the mode of action of Stx1 and Stx2 that might explain the high incidence of Stx2 producing E coli in patients with severe disease. Much to our surprise, only 25 genes were regulated altogether upon Stx1 incubation and 24 genes by Stx2, despite the fact that we had used arrays representing 6800 and 12 488 human genes, respectively. Most of the regulated genes belonged to chemokines and cytokines. Other ones encoded for cell adhesion molecules and transcription factors that are involved in immune responses or apoptosis, and some genes could not be assigned to a special gene family.
Cytokines are crucial in regulating a variety of molecular and cellular events in inflammation.12 Genes encoding for IL-8 and GRO-1, -2, and -3 were up-regulated in HUVECs by both Stxs. Thorpe et al had reported similar data for intestinal epithelial cells.10 Additionally IL-6 and MCP-1 mRNA levels were more abundant upon Stx2 stimulation, although at protein level both toxins led to an increased expression. IL-8 is a C-X-C chemokine that is expressed by various cell types and is strongly up-regulated in endothelial cells by proinflammatory cytokines29 or histamine.30 It increases the binding strength of leukocytes to endothelial cells, thus facilitating their infiltration into an area of inflammation.31 Elevated IL-6 and IL-8 levels are found in serum and urine of HUS patients.3 MCP-1 belongs to the family of C-C chemokines,12 and gene regulation of MCP-1 was observed by array analysis only in HUVECs stimulated with Stx2. Recently, Zoja et al reported an increased expression of MCP-1 mRNA in HUVECs exposed to Stx2.32 Surprisingly, real time RT-PCR revealed regulation also in human endothelial cells incubated with Stx1. RT-PCR data were confirmed by testing of tissue culture supernatants for MCP-1 protein expression using an enzyme immunoassay. This lack of MCP-1 regulation might be due to a lower sensitivity of array analysis compared with real-time RT-PCR.
GM-CSF is a colony-stimulating factor that stimulates the maturation and differentiation of hematopoetic progenitor cells into granulocytes, macrophages, and erythrocytes, and plays a critical role in the host defense response during infection. GM-CSF is encoded by the CSF2 gene.33 Both Stxs had positive effects on CSF2 gene regulation, but Stx2 acted faster and more efficiently both on mRNA and protein level and was most prominent after 24 hours. In our experimental setup, Stxs did not induce secretion of IL-1β and TNF-α. Similar observations had been reported by Sakiri et al34 for human vascular endothelial cells. The proinflammatory effects of certain cytokines seem to play an important role in the development of EHEC disease and may have a major influence on the outcome of HUS.3
The entry of leukocytes into sites of injury or infection requires molecular mechanisms that enable the cells to recognize and form contact points with the endothelium in order to migrate through the blood vessel wall. The extravasation of leukocytes is a multistep process. Selectins on the vessels capture flowing leukocytes and ICAM1 and VCAM1 firmly attach them to the endothelial cells (ECs). Attachment is then followed by extravasation between EC junctions.12 In the present study we show that only Stx2 induced expression of membrane bound P-Selectin and ICAM1 on HUVECs at subinhibitory concentrations. P-Selectin was expressed at the cell surface with no regulation measurable by array analysis, indicating that this molecule might rather be regulated on translational level. Impact of Stx2 on regulation and expression of cytokine genes and cell adhesion molecules was greater than that of Stx1, delivering potential insights into the epidemiologically well-established fact that systemic complications are more often associated with infections caused by Stx2 producing EHEC strains than with Stx1 producers.35
Furthermore, a number of transcription factors was regulated in HUVECs upon stimulation with Stxs. The transcription factors in most cases belonged to the TNF/stress-related signaling pathway (TRAF-1, TNFαIP-2 and -3) and NFκB (Iκα, Iκϵ, NκB2, FOS, JUNB, and RelB) pathway. These transcription factors play important roles in immune regulation, cell proliferation, regulation of proinflammatory cytokines, and apoptosis.36 The early growth response (EGR-1) gene product is a zinc finger protein transcription factor involved in regulating genes differentially expressed in vascular lesions. It also plays a crucial role in proliferation and activation of smooth muscle cells in the case of endothelial cell damage.37 Increased EGR-1 expression induces transcription of NAB2 (EGR-1 binding protein 2), which plays a major role in hemostasis.38 In our experiments only Stx1 induced EGR-1 gene expression in HUVECs. The lack of EGR-1 expression of human endothelial cells after exposure to Stx2 may lead to dysfunctions in hemostasis and inadequate responses to the endothelial damage caused by this toxin, ultimately resulting in the occlusion of small vessels. The transcription factor NFκB is involved in expression of cytokines and cell adhesion molecules in endothelial cells, and is important for the cellular response to damage or infection of the endothelium.39 In the present study we found regulation of Iκα, Iκϵ, NκB2, and RelB, though no consistent pattern was observed. These transcription factors are directly involved in the regulation of NFκB,36 which further emphasizes the proinflammatory effects of Stxs. In addition, both TRAF-1 and TNFαIP-3 were induced after incubation with Stx1 and Stx2 after 24 hours. These transcription factors are important in controlling apoptosis.40
From our data, it can be concluded that subinhibitory concentrations of Stxs mediate inflammatory responses of human endothelial cells, which might well be the starting point for the endothelial damage seen in HUS. In addition, among many similarities we were able to identify clear differences in gene regulation and expression between Stx1 and Stx2, regarding cell adhesion molecules and proteins involved in hematopoesis, hemostasis, and endothelial repair, which could give an explanation for the varying virulence of the 2 toxins in human EHEC disease.
Prepublished online as Blood First Edition Paper, April 17, 2003; DOI 10.1182/blood-2002-10-3301.
Supported by the Deutsche Forschungsgemeinschaft, SFB 621.
The publication costs of this article were defrayed in part by page charge payment. Therefore, and solely to indicate this fact, this article is hereby marked “advertisement” in accordance with 18 U.S.C. section 1734.
We would like to thank Oliver Fuerst and Tanja Toepfer for excellent technical support and Lars Macke for CBA analysis of IL-6 and IL-8. The authors also gratefully acknowledge Klaus Ebnet for helpful discussions and Christofer Samuelsson for assistance in preparing the manuscript.


