Abstract
Bcl2's antiapoptotic function is regulated by phosphorylation. Bcl2 also regulates cell cycle progression, but the molecular mechanism is unclear. Bcl2 is functionally expressed in mitochondria where it can act as an antioxidant that may regulate intracellular reactive oxygen species (ROS). Since ROS have been reported to act as second messengers in cell signaling, we tested whether Bcl2 phosphorylation regulates ROS and cell cycle progression. G1 → S transition and ROS levels were measured in cells expressing either the gain of function phosphomimetic Bcl2 mutants S70E and T69E/S70E/S87E (EEE) or the nonphosphorylatable and survival-deficient mutants S70A and T69A/S70A/S87A (AAA). Expression of S70E and EEE but not the A-containing Bcl2 mutants retards G1 → S transition by 35% to 50% and significantly slows cell growth in association with reduced levels of intracellular ROS. In addition to expression of the phosphomimetic Bcl2 mutants, either interleukin-3 withdrawal or treatment of cells with the antioxidant pyrrolidine dithiocarbamate (PDTC) also reduces intracellular ROS levels in association with up-regulation of p27 and accumulation of cells in G0/G1. Retardation of G1 → S transition can be overridden by directly adding H2O2 to the cells in a mechanism that involves down-regulation of p27 and activation of Cdk2. Thus, Bcl2 may regulate G1 → S transition by a novel signaling mechanism that couples regulation of intracellular ROS with p27 and Cdk2. Furthermore, phosphorylation of Bcl2 may functionally link its antiapoptotic, cell cycle retardation, and antioxidant properties.
Introduction
Reactive oxygen species (ROS) including superoxide (
We recently discovered that either mono-(S70) or multisite (T69, S70, and S87) phosphorylation of Bcl2 in the flexible loop domain (FLD) is required for Bcl2's potent antiapoptotic function.13,14 Since Bcl2 also can regulate cell cycle progression,10 we tested the functional relationship between these posttranslational modifications, ROS, and cell cycle regulation. Results reported here show that Bcl2 potently retards G1 → S cell cycle transition in association with decreased ROS and increased p27 in a mechanism regulated by Bcl2 phosphorylation. Therefore, these findings functionally link survival and cell cycle transition through Bcl2's antioxidant property. Since most of ROS is generated and thereby must be regulated in the mitochondria, at least in nonphagocytic cells, this may explain the functional significance of mitochondrial localization of Bcl2.
Materials and methods
Materials
Bcl2, ERK1, ERK2, cdk2, p21, p27, SOD1, and phosphospecific ERK antibodies were purchased from Santa Cruz Biotechnology (Santa Cruz, CA). Catalase antibody and pyrrolidine dithiocarbamate (PDTC) were obtained from Sigma (St Louis, MO). Dichlorodihydrofluorescein diacetate (H2DCFDA) was purchased from Molecular Probes (Eugene, OR). The catalase inhibitor 3-amino-1,2,4-triazole (3-AT) and the superoxide dismutase (SOD) inhibitor 2-methoxyestradiol (2-ME) were obtained from Sigma Chemical (St Louis, MO). All other reagents were from commercial sources, unless stated otherwise.
Plasmids, cDNA, cell lines, and stable transfections
Murine Bcl2 cDNA was cloned in pUC19 plasmid. Nucleotides corresponding to each serine (S) or threonine (T) residue were substituted to create a conservative alteration to alanine (A) or glutamic acid (E) with a site-directed mutagenesis kit (Clontech, CA). Each single mutant was confirmed by sequencing the cDNA and then cloned into the pCIneo mammalian expression vector (Promega, WI). The pCIneo plasmid containing each Bcl2 mutant cDNA was transfected into murine IL-3–dependent NSF/N1.H7 cells by electroporation.14 Clones stably expressing wild-type (WT) or mutant Bcl2 were selected in medium containing G418 (0.6 mg/mL). The expression level of exogenous Bcl2 was compared by Western blot analysis. Clones expressing similar amounts of exogenous Bcl2 were selected for further analysis.
Intracellular peroxide assay
Cells were resuspended in fresh RPMI 1640 conditional medium and incubated with 5 μM dichlorodihydrofluorescein diacetate (H2DCFDA) at 37°C for 30 minutes. Samples were placed on ice and analyzed by flow cytometry as described.15
Cdk2 activity assay
Cells were harvested and lysed in ice-cold lysis buffer (50 mM HEPES [N-2-hydroxyethylpiperazine-N′-2-ethanesulfonic acid], 150 mM NaCl, 10% glycerol, 0.1% Tween 20, 1 mM NaF, 0.1 mM sodium vanadate, 50 mM β-glycerophosphate, 10 μg/mL aprotinin, 10 μg/mL pepstatin, and 10 μg/mL lepeptin). The lysates were sonicated, and insoluble material was pelleted by centrifugation at 14 000g. Cdk2/cyclin E immune complexes were coimmunoprecipitated by using cdk2 antibody, then incubated with histone-1 and 0.5 μCi (0.0185 MBq) of [γ-32P] adenosine triphosphate (ATP) for 45 minutes at 30°C as described.16 The reaction was stopped by addition of sodium dodecyl sulfate (SDS) sample buffer and boiling the sample for 5 minutes. The samples were subjected to sodium dodecyl sulfate–polyacrylamide gel electrophoresis (SDS-PAGE) and transferred to a nitrocellulose membrane. Cdk2 activities were determined by autoradiography.
Cell cycle analysis
Cells were washed once with ice-cold phosphate-buffered saline (PBS) and resuspended in 100 μL of ice-cold PBS. Then 900 μL cold methanol was added to the cells, mixed gently, then incubated on ice or in a –20°C freezer for at least 30 minutes. Cells were washed once with PBS and resuspended in 500 μL PBS. RNAse (100 μg/mL) was added and incubated at room temperature for 60 minutes. Next, 500 μL of 0.1 mg/mL propidium iodide (PI) was added to cells and incubated at room temperature for 30 minutes. Cell cycle was analyzed by flow cytometry.
Cell viability
The apoptotic and viable cells were detected using ApoAlert Annexin-V kit (Clontech) according to the manufacturer's instructions. The percentage of annexin-Vlow cells (percent viable cells) or annexin-Vhigh cells (percent apoptotic cells) was determined by using the data obtained by fluorescence-activated cell-sorter scanner (FACS) analysis as described previously.17
Results
Phosphomimetic Bcl2 mutants retard G1 → S cell cycle transition and increase cell survival
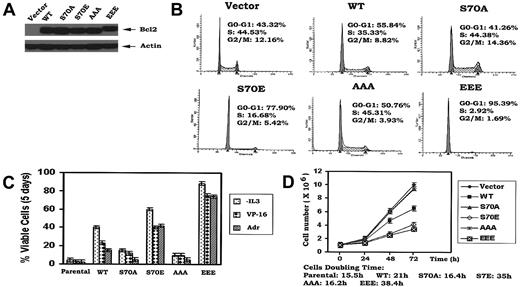
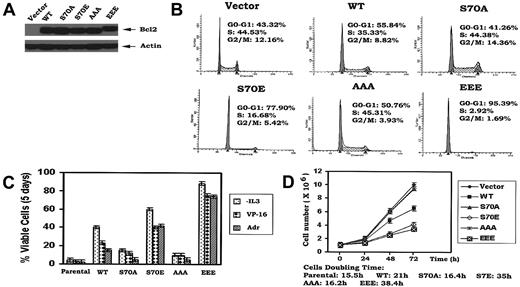
Under physiologic situations, growth factors including IL-3 and erythropoietin (EPO) induce Bcl2 phosphorylation exclusively at S70,14,18 indicating that S70 is a physiologic phosphorylation site. IL-3 or the survival agonist bryostatin-induced Bcl2 phosphorylation is a dynamic process that is regulated by physiologic Bcl2 kinases (ie, PKCα and ERK1/2) and the phosphatase PP2A.19,20 However, phosphorylation may also occur at 3 sites simultaneously (ie, T69, S70, and S87) in the FLD of Bcl2 when cells are exposed to microtubule damaging agents such as paclitaxel.21 Therefore, phosphorylation that occurs on either the single S70 site or simultaneously at 3 sites depends upon the type of signal(s) received by the cell. Interestingly, there is no report and we have not observed that phosphorylation of Bcl2 can occur exclusively at either T69 or S87. Therefore, these studies were designed to test a role for either single-site (S70) or multisite Bcl2 phosphorylation in regulating the cell cycle. Since it has been reported that the replacement of a phosphorylation site with a charged amino acid such as glutamate can functionally mimic continuous phosphorylation (ie, phosphomimetic),22,23 the phosphomimetic S70E and T69E/S70E/S87E (EEE) Bcl2 mutants were compared to the nonphosphorylatable S70A or T69A/S70A/S87A (AAA) Bcl2. The Bcl2 mutants were stably expressed in IL-3–dependent myeloid NSF.N1/H7 cells as described.14 Cells expressing similar levels of Bcl2 were selected and analyzed for cell cycle status by FACS (Figure 1A-B). Three independent clones for each Bcl2 mutant were tested with similar results, and therefore data from a single clone is shown as representative. Results reveal that cells expressing WT Bcl2 under normal growth conditions (ie, in the presence of IL-3) are distributed with 56% in the G0/G1 phase and 35% in the S phase, while cells expressing S70A or AAA display a slightly lower percentage of cells in G0/G1 (ie, 41%-51%) and a slightly higher percentage in S phase (ie, 44%-45%; Figure 1B). By contrast, most growing cells expressing the S70E or EEE Bcl2 accumulate in G0/G1 (78%-95%), with only 3% to 17% of the population in the S phase under growth factor replete conditions (Figure 1B). These results indicate that the phosphorylation status of Bcl2 can influence cell cycle status since expression of either mono- or multisite phosphomimetic Bcl2 mutants significantly retards G1 → S cell cycle transition. Interestingly, the multisite EEE Bcl2 mutant displays the most potent retardant effect, with 95% of cells in G0/G1 (Figure 1B). Therefore, prolongation of the cell division cycle by retarding G1 → S transition may also explain, at least in part, how phosphomimetic Bcl2 mutants are more potent inhibitors of apoptosis following various stresses (Figure 1C). That is, by stalling cells in G0/G1, additional time may be gained to repair any damage to DNA or cellular protein(s) that may occur from ambient stresses. Growth curves confirm that survival-hearty cells expressing the S70E or EEE Bcl2 grow more slowly than cells expressing either WT or the A-containing Bcl2 mutants (Figure 1D). These findings indicate that mono- or multisite phosphorylation of Bcl2 not only positively regulates cell survival but also affects cell proliferation by retarding G1 → S transition.
Ser70- or multisite phosphorylation of Bcl2 retards G1/S transition and cell growth in association with increased cell survival. (A) WT and A- or E-containing Bcl2 mutants were stably transfected in NSF.N1/H7 cells. Bcl2 protein expression levels were determined by Western blotting using Bcl2 antibody. (B) NSF.N1/H7 cells expressing WT or Bcl2 mutants were harvested under normal growth conditions. Cell cycle status was analyzed by flow cytometry following PI staining. (C) Cells expressing WT or A- or E-Bcl2 mutants were deprived of IL-3 or treated with VP-16 or adriamycin in the presence of IL-3 for 5 days. Cell viability was determined by analyzing annexin-V binding on FACS as described previously.17 (D) Growth curves of cells expressing WT and Bcl2 mutants were assessed using Coulter Counter. Similar results were obtained in all these studies using 3 separate clones each expressing similar amounts of exogenous Bcl2. Representative results for one clone are presented. The data represent the mean ± SD of 3 determinations.
Ser70- or multisite phosphorylation of Bcl2 retards G1/S transition and cell growth in association with increased cell survival. (A) WT and A- or E-containing Bcl2 mutants were stably transfected in NSF.N1/H7 cells. Bcl2 protein expression levels were determined by Western blotting using Bcl2 antibody. (B) NSF.N1/H7 cells expressing WT or Bcl2 mutants were harvested under normal growth conditions. Cell cycle status was analyzed by flow cytometry following PI staining. (C) Cells expressing WT or A- or E-Bcl2 mutants were deprived of IL-3 or treated with VP-16 or adriamycin in the presence of IL-3 for 5 days. Cell viability was determined by analyzing annexin-V binding on FACS as described previously.17 (D) Growth curves of cells expressing WT and Bcl2 mutants were assessed using Coulter Counter. Similar results were obtained in all these studies using 3 separate clones each expressing similar amounts of exogenous Bcl2. Representative results for one clone are presented. The data represent the mean ± SD of 3 determinations.
Bcl2 is primarily localized in mitochondria with some minor expression in nuclear and endoplasmic reticulum membrane systems.24,25 Since Bcl2's antiapoptotic function is thought to require mitochondrial localization,26 we tested whether the phosphomimetic or nonphosphorylatable Bcl2 proteins display altered subcellular localization. Subcellular fractionation studies were performed on H7 cells expressing WT, S70A, S70E, AAA, or EEE Bcl2 as described.19,20 Results reveal that all of the Bcl2 proteins display similar localization patterns to the WT (data not shown), indicating that phosphorylation does not alter Bcl2's intracellular localization and cannot explain the differential effect on cell cycle progression.
Mono- or multisite phosphomimetic Bcl2 reduces intracellular ROS levels and more potently inhibits oxidative stress-induced apoptosis
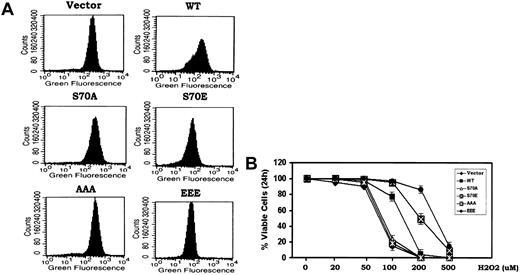
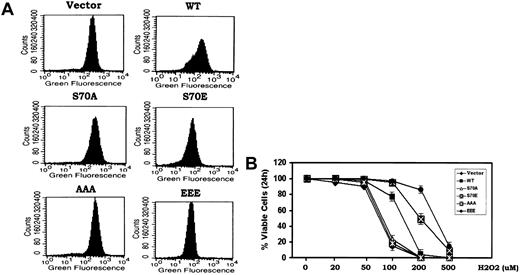
While the cell cycle progression and survival properties of Bcl2 may be functionally linked through phosphorylation, the downstream/secondary messengers responsible were not known. Bcl2 has been reported to act as an antioxidant to inhibit apoptosis induced by oxidative stress.8 Low concentrations of peroxides (ie, superoxide and H2O2) have been shown to promote G1 → S cell cycle transition when added either directly to cells in the absence of growth factors or generated within cells in response to growth factors.3,6,27 Since Bcl2 is functionally localized to mitochondria and mitochondrial respiration leads to the generation of most ROS in nonphagocytic cells,8 we tested whether the phosphorylation status of Bcl2 also may influence its antioxidant function as measured by intracellular ROS levels. To measure intracellular ROS, H7 cells expressing WT or the various Bcl2 mutants under growth factor replete conditions were incubated with the oxidation-sensitive dichlorodihydrofluorescein diacetate (H2DCFDA) dye for 30 minutes at 37°C followed by analysis using flow cytometry as described in “Materials and methods.”8,15 Results indicate that cells expressing either the S70E or EEE contain 2- to 3-fold reduced levels of intracellular ROS compared with cells expressing either the WT or the loss of survival function S70A or AAA Bcl2 mutants (Figure 2A). These data demonstrate that Bcl2 phosphorylation can enhance its antioxidant function. The reduction of intracellular ROS in these cells may result from an enhancement of antioxidant enzyme activity (ie, superoxide dismutase, catalase, glutathione peroxidase, or a combination) and supports a potential role for ROS (ie, H2O2 and superoxide) in stimulating cell cycle progression. This points to the potential importance of Bcl2's antioxidant function with respect to its cell cycle retardation function (Figure 1). To test how phosphorylation of Bcl2 might affect its antioxidative and cell survival activities, cells expressing WT or the A- or E-containing Bcl2 mutants were treated with increasing concentrations of H2O2 (ie, 20-500 μM) for 24 hours. Cell viability was determined by analyzing annexin-V binding as previously described.17 While there is no effect of H2O2 on cell survival at concentrations below 50 μM, concentrations above 100 μM reduce cell viability due to uncompensated oxidative stress (Figure 2B). Cells expressing the nonphosphorylatable S70A or AAA Bcl2 display higher ROS levels compared with WT Bcl2 (Figure 2A) and are also more sensitive to oxidative stress-induced cell death following exposure to the higher concentrations of H2O2 (Figure 2B). By contrast, the phosphomimetic S70E and EEE Bcl2 mutants possess significantly more antioxidant activity and can more potently inhibit oxidative stress-induced cell death (Figure 2B). The IC50 of H2O2 for induction of apoptosis at 24 hours in cells expressing the EEE mutant Bcl2 is approximately 3- to 5-fold increased compared with that for WT, A-containing Bcl2 mutants, or the vector control (ie, IC50: vector control-73 μM; WT-120 μM; S70A-76 μM; S70E-210 μM; AAA-75 μM; EEE-350 μM). Since cells expressing the EEE Bcl2 display maximal resistance to oxidative stress, these data suggest that multisite phosphorylation in the FLD may maximally enhance Bcl2's antioxidant and antiapoptotic functions.
Bcl2 gain of function glutamate but not phosphorylation-deficient alanine mutants potently reduce intracellular ROS and inhibit oxidative stress-induced apoptosis. (A) Cells expressing WT and A- or E-Bcl2 mutants were incubated with the oxidation-sensitive dichlorodihydrofluorescein diacetate (H2DCFDA) at 37°C for 30 minutes, and intracellular ROS levels were analyzed by flow cytometry as described.8,15 (B) Cells expressing WT and A- or E-Bcl2 mutants were treated with various concentrations of H2O2 for 24 hours as indicated. Cell viability was determined by analyzing annexin-V binding on FACS. Data represent the mean ± SD of 3 determinations.
Bcl2 gain of function glutamate but not phosphorylation-deficient alanine mutants potently reduce intracellular ROS and inhibit oxidative stress-induced apoptosis. (A) Cells expressing WT and A- or E-Bcl2 mutants were incubated with the oxidation-sensitive dichlorodihydrofluorescein diacetate (H2DCFDA) at 37°C for 30 minutes, and intracellular ROS levels were analyzed by flow cytometry as described.8,15 (B) Cells expressing WT and A- or E-Bcl2 mutants were treated with various concentrations of H2O2 for 24 hours as indicated. Cell viability was determined by analyzing annexin-V binding on FACS. Data represent the mean ± SD of 3 determinations.
IL-3 addition enhances intracellular ROS levels and promotes G1/S cell cycle progression that is retarded in cells expressing the phosphomimetic Bcl2
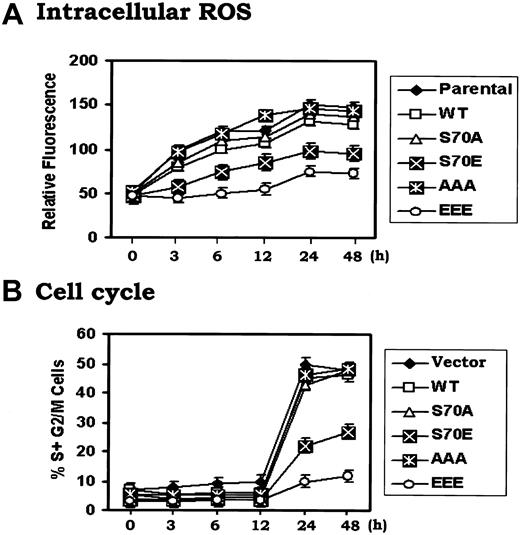
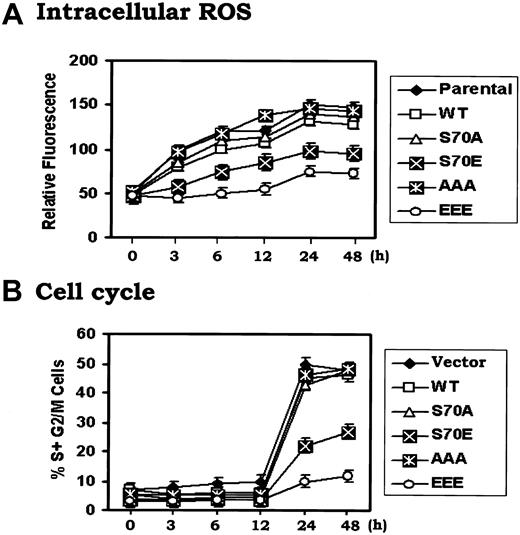
To investigate how Bcl2 might regulate G1 → S transition, cells expressing either WT or the Bcl2 mutants were arrested in G0/G1 by withdrawing IL-3 for 24 hours. Cells were monitored for ROS levels and re-entry into the S-phase following addition of IL-3. Results indicate that IL-3 rapidly enhances intracellular ROS levels in association with G1 → S cell cycle progression (Figure 3). Interestingly, ROS levels increase rapidly by 3 to 6 hours and precede G1 → S transition that occurs after 12 hours in the presence of IL-3. These results clearly indicate that IL-3–induced G1 → S cell cycle progression may occur, at least in part, in a mechanism involving increasing ROS levels. However, the increase in ROS levels observed in cells expressing S70E and EEE is significantly less (ie, by 2- to 3-fold) compared to cells expressing WT or A-Bcl2 mutants, even by 48 hours (Figure 3A). These data correlate with the increased rate of WT or the A-mutant (S70A or AAA) expressing cells entrance into S phase (ie, ∼ 50%) compared to only 10%-20% of the S70E or EEE Bcl2 expressing cells (Figure 3B). These findings strongly suggest that Bcl2 phosphorylation may regulate not only antiapoptotic but also antioxidant activity in a mechanism involving regulation of intracellular ROS generation. Thus, intracellular ROS levels may provide a functional second messenger-type link between Bcl2's survival and cell cycle regulatory properties.
IL-3 enhances intracellular ROS levels and promotes G1/S cell cycle progression that can be retarded by phosphomimetic Bcl2. (A) and (B) H7 cells expressing WT, S70A, S70E, AAA or EEE mutant Bcl2 were washed 3 times with RPMI1640 and incubated in IL-3–free medium with 10% fetal bovine serum (FBS) for 24 hours. Recombinant IL-3 was added to each cell culture for various times as indicated. The cells were harvested at each time point. Intracellular ROS (A) or cell cycle status (B) was assessed as described in “Materials and methods.” The data represent the mean ± SD of 3 determinations.
IL-3 enhances intracellular ROS levels and promotes G1/S cell cycle progression that can be retarded by phosphomimetic Bcl2. (A) and (B) H7 cells expressing WT, S70A, S70E, AAA or EEE mutant Bcl2 were washed 3 times with RPMI1640 and incubated in IL-3–free medium with 10% fetal bovine serum (FBS) for 24 hours. Recombinant IL-3 was added to each cell culture for various times as indicated. The cells were harvested at each time point. Intracellular ROS (A) or cell cycle status (B) was assessed as described in “Materials and methods.” The data represent the mean ± SD of 3 determinations.
Addition of H2O2 stimulates G1/S cell cycle transition, down-regulation of p27, and activation of Cdk2
To directly test the effect of H2O2 on G1 → S cell cycle transition, IL-3–dependent myeloid NSF/N1.H7 cells expressing the WT or Bcl2 mutants were deprived of IL-3 for 24 hours and treated with 50 μM H2O2. Results show that this concentration of H2O2 can mimic IL-3 by stimulating G1 → S cell cycle progression (Figure 4A vs Figure 3B). Similarly, expression of S70E or EEE Bcl2 retards but does not prevent H2O2-induced G → S cell cycle progression (Figure 4A). To explore the potential signaling mechanism(s) involved in H2O2-induced G1 → S transition, the activation state of 2 protein kinases required for proliferative cell growth, mitogen-activated protein kinase (MAPK) (ERKs1/2) and Cdk2,16 was determined. Addition of H2O2 to IL-3–deprived cells rapidly induces a dose-dependent phosphorylation and activation of both ERKs1/2 and Cdk2 (Figure 4B-C). Interestingly, the effect of H2O2 is specific since it selectively promotes the degradation of the Cdk inhibitor p27 but has no effect on p21 expression (Figure 4D). It is well described that activation of the MAPKs (ERK1/2) and/or Cdk2, or reduction of p27 expression, facilitates G1 → S transition. We propose that H2O2 may stimulate G1 → S transition through a novel pathway involving down-regulation of p27 and/or activation of Cdk2 that can be regulated by Bcl2. We also propose that this occurs, at least in part, as a result of Bcl2's antioxidant property. These data may explain how intracellular peroxides can fundamentally promote cell cycle progression.
H2O2 stimulates G1/S cell cycle transition that is associated with down-regulation of p27 and activation of cdk2. (A) Cells expressing WT and A- or E-Bcl2 mutants were deprived of IL-3 for 24 hours. Cell cycle status was assessed following addition of low concentration of H2O2 (ie, 50 μM) in the absence of IL-3 for various times as indicated. (B) Cells expressing WT Bcl2 were treated with various concentrations of H2O2 for 30 minutes. The cells were harvested, washed, and lysed in detergent buffer. Western blot analysis was performed to detect phosphorylated ERK1/2 (p-ERKs) or total ERK1 and ERK2 proteins by using a phosphospecific ERK antibody or a mixture of ERK1 and ERK2 antibodies, respectively. (C) Cells were treated with various concentrations of H2O2 for 30 minutes. Cdk2 was immunoprecipitated from cell lysates and incubated with purified histone-1 in an in vitro kinase assay as described in “Materials and methods.” Reaction mixtures were subjected to SDS–PAGE. Cdk2 activity was analyzed by autoradiography. Cdk2 protein was determined by Western blotting using Cdk2 antibody. (D) Cells were treated with various concentrations of H2O2 as described in (C). Cells were harvested and lysed in detergent buffer. Expression levels of p21 and p27 were analyzed by Western blotting using p21 and p27 antibodies. The data represent the mean ± SD of 3 determinations.
H2O2 stimulates G1/S cell cycle transition that is associated with down-regulation of p27 and activation of cdk2. (A) Cells expressing WT and A- or E-Bcl2 mutants were deprived of IL-3 for 24 hours. Cell cycle status was assessed following addition of low concentration of H2O2 (ie, 50 μM) in the absence of IL-3 for various times as indicated. (B) Cells expressing WT Bcl2 were treated with various concentrations of H2O2 for 30 minutes. The cells were harvested, washed, and lysed in detergent buffer. Western blot analysis was performed to detect phosphorylated ERK1/2 (p-ERKs) or total ERK1 and ERK2 proteins by using a phosphospecific ERK antibody or a mixture of ERK1 and ERK2 antibodies, respectively. (C) Cells were treated with various concentrations of H2O2 for 30 minutes. Cdk2 was immunoprecipitated from cell lysates and incubated with purified histone-1 in an in vitro kinase assay as described in “Materials and methods.” Reaction mixtures were subjected to SDS–PAGE. Cdk2 activity was analyzed by autoradiography. Cdk2 protein was determined by Western blotting using Cdk2 antibody. (D) Cells were treated with various concentrations of H2O2 as described in (C). Cells were harvested and lysed in detergent buffer. Expression levels of p21 and p27 were analyzed by Western blotting using p21 and p27 antibodies. The data represent the mean ± SD of 3 determinations.
Reduction of intracellular ROS following IL-3 withdrawal or treatment with the antioxidant PDTC or expression of phosphomimetic Bcl2 mutants inhibits G1 → S cell cycle progression
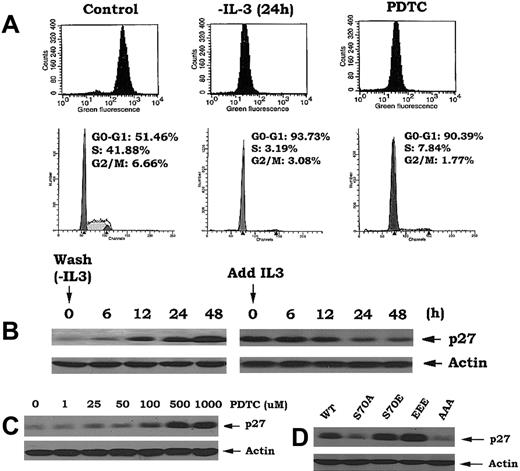
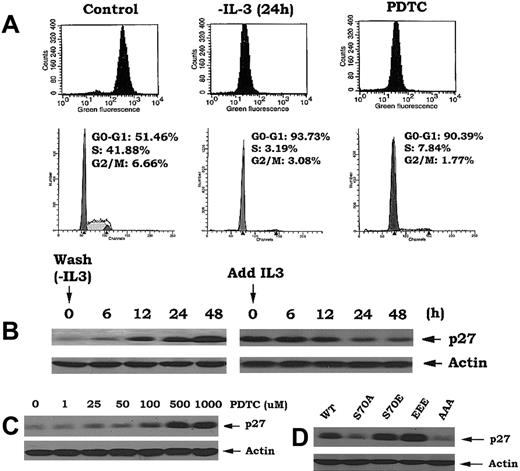
Our findings indicate that Bcl2 can act as a potent antioxidant to regulate intracellular ROS and retard cell cycle entry (Figures 1, 2). Interestingly, simply reducing the level of intracellular ROS by other means such as deprivation of IL-3 or treatment of cells with the antioxidant pyrrolidine dithiocarbamate (PDTC), even in the presence of IL-3, also leads to the accumulation of cells in G0/G1 (> 90%; Figure 5A). These findings highlight the interdependence of cell cycle progression and intracellular ROS levels and uncover a potentially novel regulatory function for Bcl2.
Reduction of intracellular ROS following IL-3 withdrawal or treatment with antioxidant PDTC or expression of phosphomimetic Bcl2 mutants results in inhibition of G1 → S transition. (A) Cells expressing nonphosphorylatable Bcl2 mutant (AAA) were deprived of IL-3 or treated with PDTC (500 μM) as indicated. The levels of intracellular ROS levels and cell cycle status were assessed as in Figure 1. (B) Cells were deprived of IL-3 for various times up to 48 hours, then IL-3 was added to cells for various times as indicated. Expression levels of p27 were determined by Western blotting using p27 antibody. (C) Cells were treated with various concentrations of PDTC for 24 hours. Expression levels of p27 were determined as in (B). (D) Cells expressing WT, A-, or E-Bcl2 mutants were lysed in detergent buffer. Expression levels of p27 were determined as described above.
Reduction of intracellular ROS following IL-3 withdrawal or treatment with antioxidant PDTC or expression of phosphomimetic Bcl2 mutants results in inhibition of G1 → S transition. (A) Cells expressing nonphosphorylatable Bcl2 mutant (AAA) were deprived of IL-3 or treated with PDTC (500 μM) as indicated. The levels of intracellular ROS levels and cell cycle status were assessed as in Figure 1. (B) Cells were deprived of IL-3 for various times up to 48 hours, then IL-3 was added to cells for various times as indicated. Expression levels of p27 were determined by Western blotting using p27 antibody. (C) Cells were treated with various concentrations of PDTC for 24 hours. Expression levels of p27 were determined as in (B). (D) Cells expressing WT, A-, or E-Bcl2 mutants were lysed in detergent buffer. Expression levels of p27 were determined as described above.
Since increased p27 expression leads to G1 → S transition blockade and accumulation of cells in G0/G1,28 and since addition of H2O2 to cells induces p27 down-regulation (Figure 4D), we next tested whether ROS could affect p27 expression. Interestingly, p27 is dramatically up-regulated by IL-3 withdrawal and rapidly down-regulated by addition of IL-3 to factor-deprived cells (Figure 5B). Since IL-3 addition or withdrawal also can positively or negatively, respectively, regulate intracellular ROS levels, these results support the notion that p27 may act as an ROS-regulated gate that controls G1 → S cell cycle transition. This notion is strengthened by the findings that addition of the antioxidant PDTC enhances p27 expression in close association with decreased intracellular ROS levels and accumulation of cells in G0/G1 (Figure 5A,C). Since cells expressing either EEE or S70E Bcl2 also contain significantly lower levels of intracellular ROS (Figure 2A), we propose that this may mechanistically explain how p27 is up-regulated in these cells (Figure 5D). Furthermore, since the direct addition of H2O2 induces G1 → S cell cycle transition in a mechanism apparently involving not only down-regulation of p27 but also activation of Cdk2 and the ERKs1/2 (Figure 4), these findings support the idea that Bcl2 retards cell cycle transition by decreasing intracellular ROS. Thus, the antioxidant property of Bcl2 may serve to not only dampen potentially damaging levels of ROS generated by rapidly respiring mitochondria during growth but also retard cells from entering the cycle, thereby slowing their growth (Figure 1). This effect targets G1 → S transition, a critical control checkpoint in which cells either continue cell cycle progression or undergo programmed cell death.9
Phosphorylation of Bcl2 regulates superoxide dismutase and catalase expression
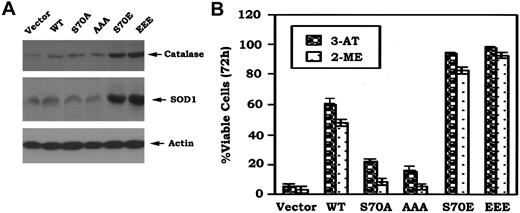
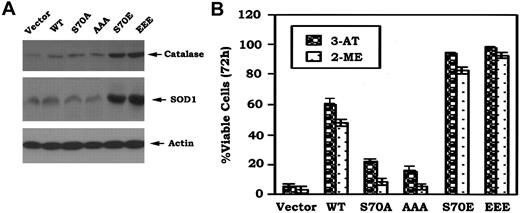
Since Bcl-2 colocalizes with SOD, catalase, and glutathione peroxidase (GPx) in mitochondria where the majority of ROS is generated,8,29 it is possible that Bcl2 may act as an antioxidant in a mechanism involving regulation of expression of one or more of these antioxidant enzymes. Studies were designed to test whether expression of phosphomimetic Bcl2 affects expression of antioxidant enzymes. Results indicate that cells stably expressing S70E and EEE Bcl2 but not those expressing nonphosphorylatableA-mutants express increased levels of catalase and SOD1 (Figure 6A). These data suggest that the phosphomimetic Bcl2 may decrease intracellular ROS in a mechanism that involves, at least in part, up-regulation of one or more of these critical antioxidant enzymes.
Phosphomimetic Bcl2 enhances expression of Cu/Zn-superoxide dismutase (SOD1) and catalase, and more potently inhibits 3-AT or 2-ME–induced cell death. (A) Cells expressing WT, A-, or E-Bcl2 mutants were lysed in detergent buffer. Expression levels of SOD1 and catalase were determined by Western blotting using SOD1 or catalase antibody, respectively. (B) Cells were treated with 3-AT (10 mM) or 2-ME (3 μM) for 72 hours. Cell viability was determined by analyzing annexin-V binding on FACS as described in Figure 1C. The data represent the mean ± SD of 3 determinations.
Phosphomimetic Bcl2 enhances expression of Cu/Zn-superoxide dismutase (SOD1) and catalase, and more potently inhibits 3-AT or 2-ME–induced cell death. (A) Cells expressing WT, A-, or E-Bcl2 mutants were lysed in detergent buffer. Expression levels of SOD1 and catalase were determined by Western blotting using SOD1 or catalase antibody, respectively. (B) Cells were treated with 3-AT (10 mM) or 2-ME (3 μM) for 72 hours. Cell viability was determined by analyzing annexin-V binding on FACS as described in Figure 1C. The data represent the mean ± SD of 3 determinations.
To test a role for decreased intracellular ROS on Bcl2's antiapoptotic function, the cells were treated with 3-amino-1,2,4-triazole (3-AT), a catalase-specific inhibitor,30 or 2-methoxyestradiol (2-ME), a potent SOD inhibitor and inducer of apoptosis.31 Results reveal that cells expressing the S70E or EEE Bcl2 are more survival hearty than those expressing WT or S70A or AAA (Figure 6B). Thus, while it is possible, as previously reported,32-34 that Bcl2's antioxidant property that helps to decrease intracellular ROS levels may be not required for its antiapoptotic effect. Nonetheless, these properties are functionally linked in respiring cells.
Discussion
Bcl2 functions as a potent survival agonist that effectively confers cellular resistance to apoptosis following exposure of cells to various stresses.11,35 Bcl2 expression also can inhibit cell cycle progression by retarding G1 → S phase transition.9,10 The intracellular signal transduction mechanism(s) by which Bcl2 may regulate these 2 functions was not clear. Our results indicate that Bcl2 may negatively regulate cell cycle transition in a novel mechanism involving regulation of intracellular ROS levels through its potent antioxidant function. Therefore, phosphorylation of Bcl2 may functionally link its antiapoptotic, cell cycle retardation, and antioxidant properties.
Since our findings reveal that mono- or multisite phosphorylation of Bcl2 can potently retard G1 → S cell cycle transition in association with increased cell survival and deceased cell growth (Figure 1), it was important to identify the downstream secondary messenger(s) involved. While production of high levels of ROS can lead to cellular oxidative stress and induce apoptosis, a growing body of evidence indicates that lower levels of the major ROS, superoxide and H2O2, can also stimulate cell proliferation.27 For example, H2O2 or superoxide promotes G1 → S cell cycle transition in various cell systems.3,27 Since Bcl2 functions as a potent antioxidant,8 we considered whether this property may explain how Bcl2 can affect G1 → S transition. Our findings indicate that Bcl2 decreases intracellular ROS levels and retards cell cycle transition in a mechanism regulated by Bcl2 phosphorylation. Cells expressing mono- or multisite phosphomimetic Bcl2 mutants (ie, S70E or EEE) display significantly lower ROS levels, consistent with a reduced redox state (Figure 2A). The retardation of G1 → S transition observed in these cells may result from reduced intracellular ROS levels, since addition of H2O2 directly to cells can facilitate G1 → S cell cycle progression. It has been reported that high concentrations of H2O2 can act as an oxidative stress and induce apoptosis through peroxidation reactions that can be inhibited by Bcl2 through its antioxidant function.8 Our data now indicate that the phosphomimetic forms of Bcl2 enhance its antioxidant function and more potently protect cells from apoptosis Bcl2 following either the direct addition of high concentrations of H2O2 or treatment with a catalase or SOD inhibitor that can increase intracellular ROS levels (Figures 2 and 6).30,31 By contrast, the nonphosphorylatable S70A and AAA Bcl2 mutants possess much less, if any, antioxidant activity, and their expression fails to protect cells from apoptosis following such treatments (Figure 2B). These data are consistent with the findings that some of the multiple protein kinases known to be activated by oxidative stress, including MAPKs ERK1/2 and the JNK1,17,20 may phosphorylate Bcl2 and stimulate its antioxidant function in an attempt to override the oxidative stress that may otherwise lead to apoptosis.
However, Bcl2's antioxidant role in reducing ROS levels may not be required for suppression of apoptosis since Bcl2 has been reported to protect cells from apoptosis under anaerobic conditions.32-34 Nonetheless, our findings indicate that Bcl2's antioxidant property is functionally connected to its cell cycle regulatory property.
Importantly, addition of lower concentrations of H2O2 (∼ 50 μM) to cells has no effect on survival but can mimic IL-3 to stimulate G1 → S cell cycle transition (Figures 2B and 4A). These data indicate that the functional effect of H2O2 depends on its concentration. Recent reports indicate that cyclin E/Cdk2 and MAPK (ERK1/2)–induced cyclinD/Cdk4/Cdk6 activities are required for passage from G1 into S phase.16 Moreover, p27 is a critical negative regulator of Cdk2 and G1 → S cell cycle progression, since overexpression of p27 results in G1 arrest in a variety of cell types.36-39 The findings that H2O2 not only activates MAPK (ERK1/2) and Cdk2 but also can specifically down-regulate p27 (Figure 4) suggest a likely mechanism by which H2O2 can stimulate G1 → S cell cycle progression. Therefore, we propose that Bcl2, through its antioxidant property, can regulate cell cycle progression.
The intracellular ROS level may be critical when cells make the decision to progress from G1 → S phase. This possibility is underscored by the observation that cells treated with the antioxidant PDTC or following growth factor withdrawal display significantly decreased intracellular ROS levels and accumulate in G0/G1 (Figure 5). These data also strongly support a functionally inextricable relationship between ROS levels and G1/S cell cycle status. Since cells expressing the phosphomimetic Bcl2 mutants have enhanced p27 expression (Figure 5), we propose that Bcl2 may regulate G1/S cell cycle progression in a novel mechanism involving a ROS/p27/Cdk2 axis.
Superoxide dismutase, catalase, and glutathionine peroxidase (GPx) physiologically catalyze the intracellular reduction of ROS.3 Superoxide dismutases (ie, SOD1 and SOD2) are the major antioxidant enzymes that catalyze the dismutation of the superoxide anion (
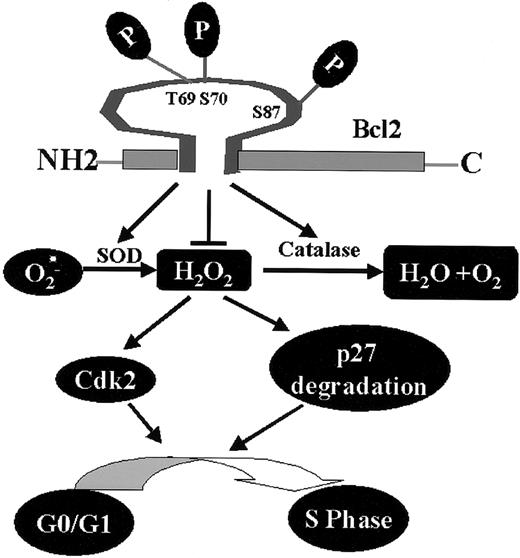
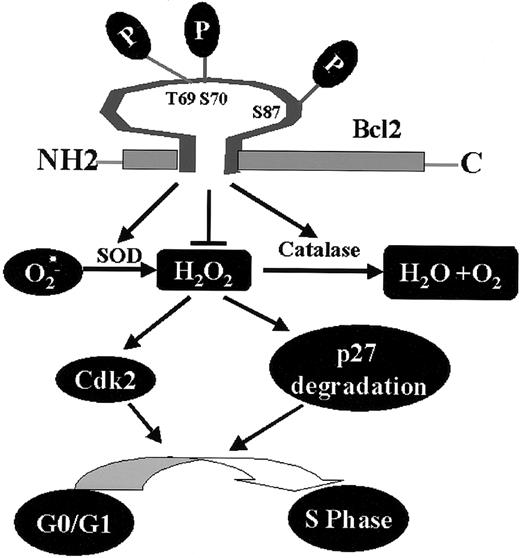
Bcl2, through its phosphorylation, regulates a novel cell cycle progression pathway that features a role for intracellular peroxides in stimulating G1 → S cell cycle transition. Phosphorylation at mono- or multisite appears to not only activate Bcl2's potent survival function14,17 but also enhance its antioxidant properties, leading to decreased levels of ROS, retardation of G1 → S cell cycle entry, and reduced cell growth (Figure 7).
Proposed model of Bcl2/cell cycle signaling. Mono- or multisite Bcl2 phosphorylation reduces intracellular ROS levels through regulation of cellular antioxidant enzymes (ie, SOD and catalase). The decreased intracellular ROS levels induced by Bcl2 result in up-regulation of p27 and down-regulation of Cdk2 activity that are associated with retardation of G1→S cell cycle transition.
Proposed model of Bcl2/cell cycle signaling. Mono- or multisite Bcl2 phosphorylation reduces intracellular ROS levels through regulation of cellular antioxidant enzymes (ie, SOD and catalase). The decreased intracellular ROS levels induced by Bcl2 result in up-regulation of p27 and down-regulation of Cdk2 activity that are associated with retardation of G1→S cell cycle transition.
Bcl2's role in regulation of ROS levels is consistent with its mitochondrial localization, since the majority of ROS is produced in this organelle, at least in nonphagocytic cells. Therefore, the functional bundling of cell survival and cell cycle progression properties through Bcl2's potent antioxidant property may serve as a biologic regulator to control cell growth. That is, Bcl2 may be highly beneficial for cell survival in an environment where otherwise increased levels of ROS may be generated from mitochondrial respiration that occurs during rapid cell growth. Since increased ROS levels may cause oxidative damage and DNA mutation that may result in cellular pathology including cancer, applying the brakes on ROS generation and decreasing cell cycle transition may allow time to repair such cellular damage.
Prepublished online as Blood First Edition Paper, July 10, 2003; DOI 10.1182/blood-2003-04-1027.
Supported by National Institutes of Health grant CA44649-11.
The publication costs of this article were defrayed in part by page charge payment. Therefore, and solely to indicate this fact, this article is hereby marked “advertisement” in accordance with 18 U.S.C. section 1734.
We thank Melissa Chen for FACS analysis.

