Abstract
The t(11;14)(q13;q32) is the most common translocation in multiple myeloma (MM), resulting in up-regulation of cyclin D1. We used a segregation fluorescence in situ hybridization (FISH) assay to detect t(11;14) breakpoints in primary MM cases and real-time reverse transcriptase-polymerase chain reaction (RT-PCR) to quantify cyclin D1 and MYEOV (myeloma overexpressed) expression, another putative oncogene located on chromosome 11q13. High levels of cyclin D1 mRNA (cyclin D1/TBP [TATA box binding protein] ratio > 95) were found exclusively in the presence of a t(11;14) translocation (11/48 cases; P < .00001). In addition, a subgroup of MM cases (15/48) with intermediate to low cyclin D1 mRNA (cyclin D1/TBP ratio between 2.3 and 20) was identified. FISH analysis ruled out a t(11; 14) translocation and 11q13 amplification in these cases; however, in 13 of 15 patients a chromosome 11 polysomy was demonstrated (P < .0001). These results indicate an effect of gene dosage as an alternative mechanism of cyclin D1 deregulation in MM. The absence of chromosome 11 abnormalities in 2 of 15 patients with intermediate cyclin D1 expression supports that there are presumably other mechanism(s) of cyclin D1 deregulation in MM patients. Our data indicate that deregulation of MYEOV is not favored in MM and further strengthens the role of cyclin D1 overexpression in lymphoid malignancies with a t(11;14)(q13;q32) translocation. (Blood. 2004;104:1120-1126)
Introduction
Translocations involving the immunoglobulin heavy chain region (IgH) on chromosome 14q32 are an important cytogenetic event in the pathogenesis of various B-cell lymphoid neoplasms such as multiple myeloma (MM), mantle cell lymphoma (MCL), Burkitt lymphoma, and follicular lymphoma.1,2 In MM, these translocations are thought to be an early event in the pathogenesis, occurring mostly during class switch recombination in terminally differentiated B cells and leading to deregulation of translocated genes under the influence of the IgH enhancers on 14q32. The IgH locus contains at least 3 different enhancers: the 5′ intronic μ enhancer (Eμ) located in the intron between the IgH joining (JH) and switch μ (Sμ) sequences and two 3′-IgH enhancers located downstream of the constant region genes (Eα1 and Eα2).3,4 The breakpoints in the IgH locus are usually inside switch regions and can result in separating and splitting of 2 different enhancers to each derivative chromosome, theoretically leading to deregulation of genes on both derivative chromosomes. Occasionally, breaks also occur in the JH region or in the diversity and joining (DJ) region on the basis of hypermutations followed by chromosomal breakage. More than 20 different chromosomal partner regions that translocate to 14q32 have been identified so far in MM,5-8 of which the t(11;14)(q13;q32) is the most common translocation with a reported frequency of 15% to 20% based on fluorescence in situ hybridization (FISH) or conventional cytogenetic analysis.8-12 The t(11;14)(q13;q32) translocation results in up-regulation of the cell cycle regulatory proto-oncogene CCND1/cyclin D1, which is normally not expressed in plasma cells. In MM the breakpoints are scattered within a 360-kb region between CCND1 and MYEOV.13-15 MYEOV is a putative oncogene previously identified by the application of a NIH3T3 tumorigenicity assay with DNA from a gastric carcinoma15 and lacks homology to any known gene. MYEOV is located 360 kb centromeric of CCND1 and its activation, concurrent to CCND1 by juxtaposition of MYEOV to either the 5′ Eμ or the 3′ Eα IgH enhancer, has recently been described.15 However, although MYEOV (myeloma overexpressed) was overexpressed in a subset of MM cell lines with t(11;14), it has never been investigated in primary MM cases.
The aim of this study was, therefore, to investigate both cyclin D1 and MYEOV deregulation by quantitative reverse transcriptase-polymerase chain reaction (QRT-PCR) in a series of primary MM cases and to explore its relationship to the presence of a t(11;14)(q13; q32) translocation, as assessed by a FISH assay.16
Patients, materials, and methods
Tissue samples
Sixty formalin-fixed, paraffin-embedded blocks of 48 patients with MM diagnosed between 1991 and 2002 were retrieved from the files of the Institute of Pathology, Technical University of Munich (Munich, Germany). In 9 of these MM cases, 2 or 3 biopsies taken at different time points over a period of up to 5 years were available. The biopsies were not decalcified, as most of the material was obtained during surgery from large osteolytic lesions. The cases were graded according to the histologic grading criteria described by Bartl et al17 and were reviewed by 3 of the authors (L.Q.-M., M.K., and F.F.). Some of the cases have been reported previously as part of another study.18 In addition, 14 formalin-fixed, paraffin-embedded blocks of nonneoplastic lymphoid tissues (6 lymph nodes, 4 tonsils, and 4 decalcified bone marrow biopsies with reactive changes) were included as normal tissue controls.
Cell lines
In addition to the primary cases, 7 human myeloma cell lines (KMM1, OPM2, U266, KMS5, KMS11, KMS12, and KMS18), 2 mantle cell lymphoma cell lines (Granta 519 and NCEB), one anaplastic large cell lymphoma cell line (Ki-JK), 2 diffuse large cell lymphoma cell lines (SUDHL-4 and SUDHL-10), and 4 carcinoma cell lines (HT29, A431, MDA-MB231, and MDA-MB468) were used in the study. The carcinoma cell lines were acquired from American Type Culture Collection (ATCC; Manassas, VA) and cultured as recommended by the supplier. All lymphoid cell lines were cultured in RPMI 1640 medium supplemented with 15% fetal calf serum, 2 mM glutamine, 10 U/mL penicillin, and 60 μg/mL streptomycin (Invitrogen, Life Technologies, Karlsruhe, Germany).
RNA extraction and QRT-PCR
Tissue preparation, microdissection of pure tumor cell populations, and RNA extraction from formalin-fixed tissues were performed as described previously.19 Briefly, approximately 10 000 tumor cells were microdissected from each deparaffinized sample. Cells were lysed in 200 μL Tris/EDTA (tris(hydroxymethyl)aminomethane/ethylenediaminetetraacetic acid) lysis buffer and 500 μg/mL proteinase K. After complete digestion at 60°C, RNA was purified by phenol-chloroform extraction, precipitated, and dissolved in 20 μL H2O. Total RNA from cell lines was isolated using the acid-phenol-chloroform guanidinium method.20 Extracted RNA was DNase treated by incubating the RNA for 1 hour at 37°C with 10 U of DNAse I (Roche, Basel, Switzerland). Reverse transcription was performed with 250 ng of random hexamers (Roche) and 200 U of Superscript II-reverse transcriptase (Invitrogen, Life Technologies) in a final volume of 20 μL, following the manufacturer's directions.
QRT-PCR analyses were performed using the ABI PRISM 7700 Sequence Detection System (Applied Biosystems, Foster City, CA). MYEOV primers and probe were as follows, yielding a 80-bp product for MYEOV (designated by the nucleotide position relative to MYEOV GenBank accession number AJ223366): MYEOV-901 sense, 5′-CGGTGAGAGGAGCATTTGTGT-3′; MYEOV-980 antisense, 5′-GGCACCCTTGTCTCCCTTGT-3′; and MYEOV-930 probe, 5′-FAM TTTGCTGCTGGAGCTGGTGACCG-3′TAMRA. PCR reaction conditions, sequences for primers and probes for cyclin D1 and TBP (TATA box binding protein) as housekeeping gene control, and quantification procedures have been published.19 The cutoff value for altered cyclin D1 expression was based on the mean value of cyclin D1/TBP ratios determined in 8 reactive lymphoid tissues and bone marrow samples + 5 standard deviations and was 2.33 (mean, 0.84; range, 0.31-1.38). Ratios between 2.33 and 20 were arbitrarily considered to represent low (2.33-9.9) to intermediate (10-20) cyclin D1 overexpression and ratios above 20 or more to represent high cyclin D1 overexpression. Amounts of MYEOV and TBP RNA were calculated using linear regression analysis from an external standard curve generated from KMS12 RNA. MYEOV/TBP ratios were determined in 14 reactive tissues from lymph nodes (LNs), bone marrow (BM), and tonsils (mean, 0.15; range, 0.02-0.5). MYEOV/TBP ratios below 1.0 (mean + 5 standard deviations) were arbitrarily considered to represent normal or negative MYEOV levels.
FISH
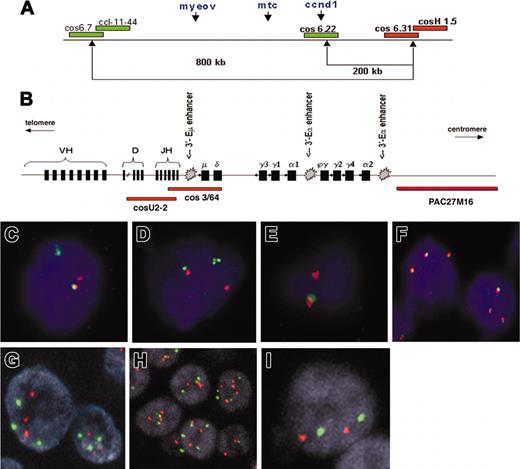
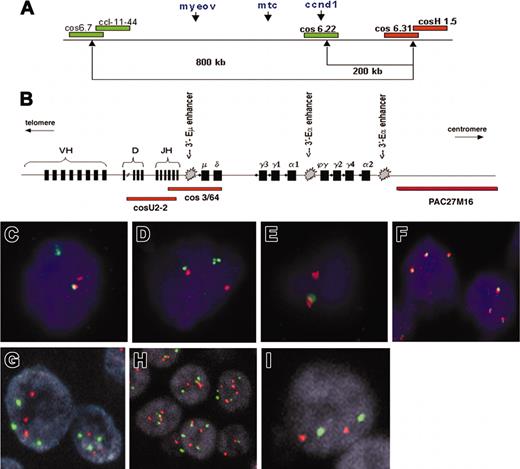
B-cell leukemia/lymphoma-1 (BCL-1) breakpoints (5′ and 3′of the CCND1 gene) were detected by a previously designed interphase FISH segregation assay.13,21 In brief, 2 probe sets were selected after mapping of large contigs of probes on normal DNA fibers resulting in a so-called color barcode of the BCL-1/11q13 region. Subsequently, a consecutive mapping of all possible breakpoints by applying the same set of probes on DNA fibers from tumor material with a putative BCL-1/11q13 breakpoint was performed. A schematic representation of the probe sets for detection of the BCL-1/11q13 breakpoints is shown in Figure 1A. The pooled cosmids cos6.7/cCl-11-44 were used in combination with the pooled cos6.31/cosH1.5 to detect the breakpoints within an 800-kb region around CCND1. In approximately 8% of MCL cases, we previously identified a mono-allelic breakpoint both immediately 3′ as well as 5′ of the CCND1 gene.24 Because these mono-allelic double breaks will not be detected with the 800-kb flanking probe set, MM cases negative for this latter probe set were studied with cos6.22/CCND1 in combination with the pooled cos6.31 and cosH1.5 (Figure 1A).
Patterns of FISH probes used in this study. (A) Schematic representation of the probe sets used for detection of the t(11;14)(q13;q32) breakpoint in chromosome 11q13, consisting of differentially labeled (green and red) pooled cosmids and P1-derived artificial chromosomes (PACs). (Adapted from Haralambieva et al16 with permission.) (B) Schematic representation of the immunoglobulin heavy chain (IgH) gene locus and the IgH FISH probes used in the CCND1 colocalization assay. Cosmid U2-2 covers JH and part of DH gene segments and cos3/64 covers the JH, Cδ, and Cμ gene segments, as described by Southern blotting analysis with segment-specific probes22 and DNA fiber FISH mapping.23 PAC clone PAC27M16 was mapped by DNA fiber FISH and located immediately 3′ of the immunoglobulin Ca2 region (J. Guikema, E.S., and P.M.K., unpublished results, May 2003). (C-F) Segregation FISH analysis. Panels C and D both show a t(11;14)(q13;q32) translocation indicated by the presence of segregated red and green signals. Panel E shows a monoallelic translocation break with loss of the derivative chromosome der11, as indicated by the presence of a single red signal and the lack of a green signal. The colocalized signal (red/green) represents the normal allele. (F) Segregation FISH analysis showing increased copy numbers for the CCND1 locus indicated by the presence of 3 colocalized signals. (G-I) Traditional interphase FISH analysis showing a trisomy (G), a polysomy (H), or a disomy (I). Original magnification × 630 for panels C-I.
Patterns of FISH probes used in this study. (A) Schematic representation of the probe sets used for detection of the t(11;14)(q13;q32) breakpoint in chromosome 11q13, consisting of differentially labeled (green and red) pooled cosmids and P1-derived artificial chromosomes (PACs). (Adapted from Haralambieva et al16 with permission.) (B) Schematic representation of the immunoglobulin heavy chain (IgH) gene locus and the IgH FISH probes used in the CCND1 colocalization assay. Cosmid U2-2 covers JH and part of DH gene segments and cos3/64 covers the JH, Cδ, and Cμ gene segments, as described by Southern blotting analysis with segment-specific probes22 and DNA fiber FISH mapping.23 PAC clone PAC27M16 was mapped by DNA fiber FISH and located immediately 3′ of the immunoglobulin Ca2 region (J. Guikema, E.S., and P.M.K., unpublished results, May 2003). (C-F) Segregation FISH analysis. Panels C and D both show a t(11;14)(q13;q32) translocation indicated by the presence of segregated red and green signals. Panel E shows a monoallelic translocation break with loss of the derivative chromosome der11, as indicated by the presence of a single red signal and the lack of a green signal. The colocalized signal (red/green) represents the normal allele. (F) Segregation FISH analysis showing increased copy numbers for the CCND1 locus indicated by the presence of 3 colocalized signals. (G-I) Traditional interphase FISH analysis showing a trisomy (G), a polysomy (H), or a disomy (I). Original magnification × 630 for panels C-I.
To determine the position of CCND1 relative to IgH enhancers (Figure 1B), the breakpoint-positive cases were analyzed by a colocalization assay using 2 probe sets (Figure 1A-B): (1) cos6.22 (covering CCND1) in combination with the pooled cosmid U2-2 (covering the JH and part of the diversity and heavy region [DH] gene segments) and cos3/64 (covering the JH, Cδ, and Cμ gene segments) as described by Vaandrager et al23 and Matsuda et al22 ; and (2) cos6.22/CCND1 in combination with PAC27M16 located immediately 3′ of the immunoglobulin Cα2 region (provided by Dr D. Cox, Research Institute, Hospital for Sick Children, Toronto, ON, Canada).
Probes were labeled by the Kreatech Universal Linkage System (ULS) nonenzymatic labeling method (Kreatech Diagnostics, Amsterdam, the Netherlands) with biotin-16-aUTP or digoxygenin-11-dUTP (Roche). The adapted conditions for the hybridization on routine tissue sections from formaldehyde-fixed, paraffin-embedded tissue blocks were described recently.16
Signals were considered colocalized when the distance between them was equal or smaller than the size of one hybridization signal. Any breakpoint should result in segregation of one or both probe sets and the presence of single red and/or single green hybridization signals in tissue sections.16 In the 7 negative control tissues, single signals were detected in 1% to 7% (mean, 4.9%; standard deviation, 1.9%) of the nuclei and the cutoff levels for both probe sets were set at 11.0% (mean plus 3 times the standard deviation).
Samples that showed evidence of increased copy number for CCND1 locus were studied separately using the CEP11 probe, labeled with SpectrumGreen, that hybridizes to the alpha satellite DNA sequence located at the centromere of chromosome 11 (11p11.1-q11) in combination with CCND1 gene locus (11q13)-specific probe labeled with SpectrumOrange (Vysis, Downers Grove, United Kingdom). Tissue pretreatment was performed as previously described.25 FISH signals of at least 100 nuclei of each tumor area were evaluated by 2 investigators using a laser scanning microscope (LSM 510; Carl Zeiss, Jena, Germany) equipped with epifluorescence optics (C-Apochromat × 63/1.2 Wcorr) and an appropriate combination of emission filters (BP-500-550 IR, BP-565-615 IR, LP 650). Image processing was carried out with Zeiss software (AIM 3.0). Following the criteria of Hopman et al,26 each case was classified as amplified for the CCND1 gene locus if there were more than twice as many clustered red cyclin D1 signals as green centromere 11 signals (ratio > 2). A polysomy 11 was diagnosed if more than 20% of all nuclei showed more than 2 nuclear red signals accompanied by the same number of nuclear green signals (ratio 1).
Immunohistochemistry
Immunohistochemistry was performed on an automated immunostainer (Ventana Medical System, Tucson, AZ) according to previously published procedures.18 The cyclin D1 antibody used in this study was from Novocastra (Newcastle, United Kingdom; clone P2D11F11) and CD20 was from Dako (Glostrup, Denmark; clone L26). Images were recorded using a Hitachi camera HW/C20 installed in a Zeiss Axioplan microscope with Intellicam software. Adobe PhotoShop (San Jose, CA) was used for image processing.
Statistical analysis
To characterize differences in the mRNA levels between the various MM cases, descriptive statistics was used. For continuous variables, the Wilcoxon rank sum test was used to test for differences between patients with the t(11;14)(q13;q32) translocation versus other patients. The Fisher exact/chi-square test was used for the count data. To correlate between polysomy and nonpolysomy cases, the Wilcoxon rank sum test was used. All the tests were performed using functions of ctest package of R libraries for statistical computing (www.r-project.org).
Results
Quantitation of cyclin D1 mRNA in 48 primary cases of MM
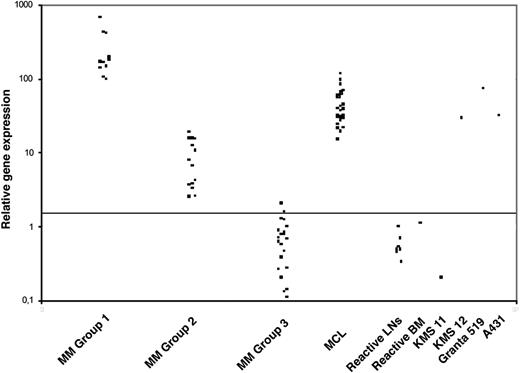
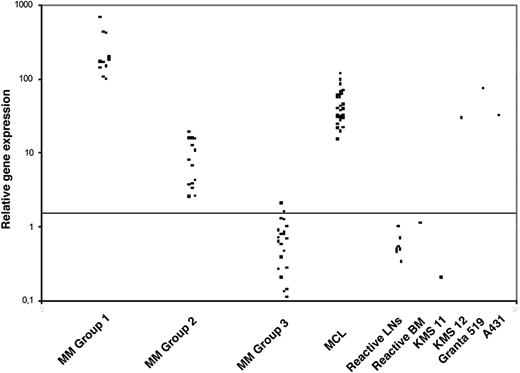
To establish and validate the system for real-time cyclin D1 expression analysis we first analyzed a series of well-characterized cell lines (Table 1). Increased expression of cyclin D1 correlated with both DNA amplification in 4 carcinoma cell lines and with the lymphoid cell lines carrying t(11;14). The results of cyclin D1 mRNA expression levels in the primary MM tumors are summarized in Table 2. Cyclin D1 mRNA transcript levels are clustered in 3 different groups (Figure 2). Group 1 included 11 (23%) cases displaying high cyclin D1 mRNA levels (cyclin D1/TBP ratio > 95; median, 171.3; range, 96.76-666.25). A second group included 15 (31%) cases with low to intermediate cyclin D1 mRNA levels (cyclin D1/TBP ratio between 2.3 and 20; median, 7.64; range, 2.5-18.72). In 2 patients (cases 12 and 17), follow-up biopsies taken up to 5 years apart showed similar results, indicating that the overexpression of cyclin D1 remains stable over time. Finally, the third group comprised the remaining 22 (46%) cases with normal or negative expression of cyclin D1 mRNA (cyclin D1/TBP ratio between 0 and 2; median, 0.6; range, 0.11-2.03).
QRT-PCR analysis of cyclin D1 mRNA levels in MMs. QRT-PCR analysis of cyclin D1 was performed relative to the TBP housekeeping gene and results are depicted as ratio of cyclin D1/TBP transcript numbers. Three distinct groups of MMs with respect to cyclin D1 levels can be identified. Note for comparison the cyclin D1 levels in a group of 23 cases of mantle cell lymphoma (MCL), the KMS12 MM cell line harboring a t(11;14)(q13;q32) translocation, and the A431 squamous cell carcinoma cell line harboring a 11q13 amplification. The horizontal line indicates the cutoff value for altered cyclin D1 expression as described in “Patients, materials, and methods.”
QRT-PCR analysis of cyclin D1 mRNA levels in MMs. QRT-PCR analysis of cyclin D1 was performed relative to the TBP housekeeping gene and results are depicted as ratio of cyclin D1/TBP transcript numbers. Three distinct groups of MMs with respect to cyclin D1 levels can be identified. Note for comparison the cyclin D1 levels in a group of 23 cases of mantle cell lymphoma (MCL), the KMS12 MM cell line harboring a t(11;14)(q13;q32) translocation, and the A431 squamous cell carcinoma cell line harboring a 11q13 amplification. The horizontal line indicates the cutoff value for altered cyclin D1 expression as described in “Patients, materials, and methods.”
FISH analysis in primary cases of MM
Fifty-five routine paraffin samples of 48 MM patients were analyzed by segregation FISH for the presence of breakpoints in the CCND1 locus (Table 2). Case 1 was not informative because of the consistently weak hybridization signal. Overall, 10 patients (21%) showed evidence of a CCND1 breakpoint by the presence of high numbers of segregated FISH signals on tissue sections with the 5′ probe set (group 1; Figure 1C-E). Further analysis revealed a specific FISH signal pattern in 4 of these patients (cases 4, 6, 7, and 10) consisting of 2 colocalized signals representing the normal allele and a single red signal (Figure 1E). This pattern and the lack of a single green signal indicated the presence of a mono-allelic translocation break in the CCND1 locus with a loss of the derivative chromosome der(11) carrying MYEOV (Figure 1A,E). No additional breakpoints were detected in any of the breakpoint-negative cases tested by the 3′ probe set.
Colocalization FISH demonstrated that in all evaluable cases in group 1, BCL-1/CCND1 was juxtaposed to IgH sequences. In cases 2, 4, 7, and 10, the 6.22/CCND1 probe colocalized with PAC27M16 but not with cosmids U2-2 and cos3/64, suggesting that the breakpoints were localized either in the gamma or alpha switch region of the IgH locus and, thus, CCND1 is only juxtaposed to 3′-Eα enhancers and not to the intronic 5′-Eμ enhancer. In cases 5, 6, and 8, the CCND1 signal colocalized with a smaller red signal derived from U2-2 and cos3/64 indicating a break at JH or Sμ. Since this interphase FISH assay cannot discriminate between a break in JH or Sμ, we cannot conclude whether CCND1 is juxtaposed to all 5′-Eμ and the 3′-Eα enhancers (in case of a break within the JH region) or only the 3′-Eα enhancers (in case of a Sμ break). In cases 9 and 11, the 6.22/CCND1 probe colocalized with PAC27M16, but all signals from cosmids U2-2 and cos3/64 were lost in tumor population although they were present in admixed non-MM cells. Consequently, we could not draw any conclusion on the exact breakpoint within the IgH locus. Case 3 was not analyzed by colocalization FISH because of lack of material.
In 22 samples of 19 patients, segregation FISH indicated the presence of an increased copy number for the CCND1 locus (Figure 1F). In order to confirm this finding and to be able to distinguish between low-level amplification from increased chromosome copy numbers (polysomy), these samples and all cases with intermediately elevated cyclin D1 levels (cases 12-26 and 35) were further analyzed by FISH with a CCND1 locus-specific probe and a chromosome 11 centromeric probe. The results are listed in Table 2. Fourteen cases were scored as having an 11q13 polysomy (Figure 1G-H), while only 2 cases with elevation of cyclin D1 levels (13 and 14) were disomic (Figure 1I). None of the cases showed an 11q13 amplification.
Histologic findings and immunohistochemistry
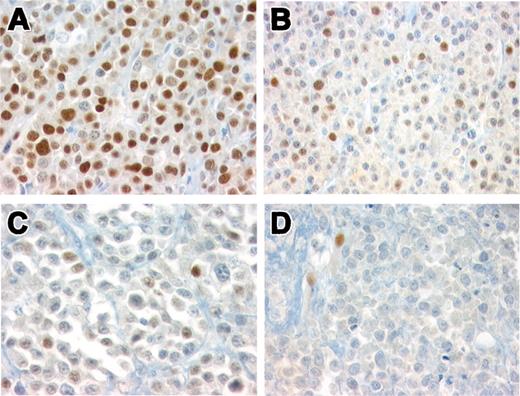
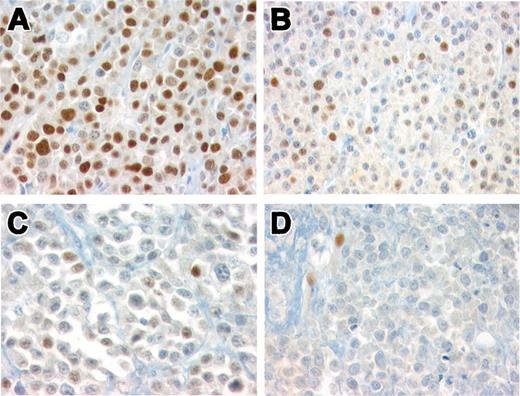
Histologically, 39 cases (81%) were composed of well-differentiated plasma cells (Bartl grade I) and 9 cases (19%) were moderately differentiated (Bartl grade II).17 Ten cases revealed lymphoplasmacytoid differentiation (Table 2). Cyclin D1 expression was observed in 18 cases (37.5%). Strong, homogenous nuclear staining in the majority of tumor cells (> 80%, +++) was observed in 11 of 18 cases (Figure 3A). Intermediate cyclin D1 protein expression (20%-50%, ++) was observed in 4 cases (Figure 3B), and low levels of protein expression (10%-20%, +) were observed in 3 cases (Figure 3C). Cases 19, 21, and 24 were considered negative (Figure 3D); however, rare bona fide plasma cells were positive for cyclin D1. Four of 48 cases (8.3%) showed focal expression of CD20.
Immunohistochemical analysis of cyclin D1 in 48 MMs. (A) Representative case of MM group 1 showing strong, homogenous, cyclin D1 nuclear staining in the majority of tumor cells (> 80%, +++). Immunoperoxidase staining; original magnification × 400. (B) A representative case with intermediate cyclin D1 protein expression (++). Nuclear positivity is detected in 20% to 50% of the tumor cells. Note that the intensity of the staining varies from cell to cell. Immunoperoxidase staining; original magnification × 400. (C) MM with nuclear positivity in 10% to 20% of tumor cells (+) representing low levels of protein expression. Immunoperoxidase staining; original magnification × 640. (D) MM negative for cyclin D1. Note the positivity in endothelial cells used as internal control. Immunoperoxidase staining; original magnification × 640.
Immunohistochemical analysis of cyclin D1 in 48 MMs. (A) Representative case of MM group 1 showing strong, homogenous, cyclin D1 nuclear staining in the majority of tumor cells (> 80%, +++). Immunoperoxidase staining; original magnification × 400. (B) A representative case with intermediate cyclin D1 protein expression (++). Nuclear positivity is detected in 20% to 50% of the tumor cells. Note that the intensity of the staining varies from cell to cell. Immunoperoxidase staining; original magnification × 400. (C) MM with nuclear positivity in 10% to 20% of tumor cells (+) representing low levels of protein expression. Immunoperoxidase staining; original magnification × 640. (D) MM negative for cyclin D1. Note the positivity in endothelial cells used as internal control. Immunoperoxidase staining; original magnification × 640.
Correlation between the expression of cyclin D1 mRNA and protein with the presence of 11q13 alterations
The expression of cyclin D1 (mRNA and protein) together with the presence or absence of the t(11;14) translocation clearly defined 3 different groups. Group 1 included the 11 (23%) cases displaying high cyclin D1 mRNA levels. All 10 evaluable cases showed the t(11;14) translocation by segregation FISH and strong nuclear staining for cyclin D1 (+++; Table 2 and Figure 3A). Group 2 contained 15 (31%) cases with low to intermediate elevation of cyclin D1 mRNA and no evidence of the t(11;14) translocation. Thirteen of these 15 cases showed polysomy by the locus-specific probe FISH. The 11q13 amplification was not identified in any of the cases. In contrast to the previous group, cyclin D1 protein expression varied from negative to (++) positive. The correlation between cyclin D1 mRNA and protein expression was generally good. Cases with low mRNA levels (cyclin D1/TBP ratio < 10) tended to be negative or (+) positive for cyclin D1 protein expression, confirming our previous observations that real-time RT-PCR is a more sensitive method for the detection and quantitation of cyclin D1.19 The association of 11q polysomy and low to intermediate cyclin D1 mRNA expression was statistically highly significant (P < .0001). Group 3 comprised the remaining 22 (46%) cases with normal or negative expression of cyclin D1 (mRNA and protein) and no alteration of the 11q13 locus. Only in one case (case 35) was a polysomy for 11q identified by FISH.
MYEOV expression is rarely related with t(11;14) in MM
To investigate whether MYEOV is involved in MM, we also determined the MYEOV mRNA expression levels using real-time RT-PCR (Tables 1-2). Elevated expression of MYEOV was observed in 34 (76%) of 45 cases, of which 14 cases showed a high expression with a MYEOV/TBP ratio higher than 6.0. However, only 2 of the 10 MM cases with t(11;14) showed such a high MYEOV expression.
Discussion
In this study, we investigated cyclin D1 deregulation in a large series of primary MM cases and analyzed a potential correlation with the expression of MYEOV, a proposed oncogene lying in close vicinity to the t(11;14)(q13;q32) breakpoint region.15 In addition, we investigated the influence of distinct translocation breakpoints and 11q13 copy numbers on the expression levels of cyclin D1 mRNA.
We found that high levels of cyclin D1, both at the mRNA and the protein level, occurred exclusively in the presence of a t(11;14)(q13;q32) translocation. There are only a few thorough studies, so far,27,28 that correlate cyclin D1 mRNA levels with the presence of a t(11;14) translocation. This is largely due to technical obstacles, which have now been overcome by the availability of the real-time RT-PCR technique.19,29 In this study, breakpoints in the 11q13 region were detected in 10 (21%) of the 47 evaluable cases by our segregation FISH approach. While the incidence of t(11;14) found in our study is similar to that described in 2 recent reports12,30 (17% and 18%, respectively), we provide further evidence that the t(11;14) translocation is tightly connected with strong cyclin D1 overexpression, as shown by real-time RT-PCR (cyclin D1/TBP ratio > 95) and immunohistochemical analysis (+++; Table 2 and Figure 3A).
The strikingly high levels of cyclin D1 mRNA in MM cases with t(11;14) are in contrast with our previous findings in MCL,19 where even though significantly elevated amounts of cyclin D1 mRNA were found in all samples (median cyclin D1/TBP ratio 31.9), they were well below the levels of most MM cases (Figure 2). The difference is most likely not due to the percentage of tumor cells since we enriched both MCL and MM by microdissection. There are 2 possible explanations for the higher cyclin D1 expression in MM. One is the presence of different breakpoints in the IgH locus at 14q32. In MCL, the break occurs in the JH region resulting in a direct juxtaposition of CCDN1 to the 5′-Eμ enhancer and to the downstream 3′-Eα enhancers. The 14q32 breakpoint in MM is usually located in an IgH switch region resulting in the juxtaposition of CCND1 onto the 3′-Eα enhancers. Accordingly, our colocalization FISH analysis revealed that in the MM cases with a t(11;14) translocation, CCND1 expression is triggered by the 3′-Eα enhancers in at least 4 of the 7 analyzable cases. A second and more plausible explanation is that due to the higher levels of IgH transcription in MM, as opposed to MCL, the enhancers juxtaposed to the CCND1 gene will trigger higher cyclin D1 transcription.
The second oncogene investigated in this study, MYEOV, lies in close proximity to the CCND1 locus. For the first time, we demonstrate that MYEOV overexpression occurs in some primary MM cases with the t(11;14) translocation, presumably as a result of a reciprocal translocation.15 This scenario, where both MYEOV and CCND1 come under the separate control of different IgH enhancers seems to be a rare event, since high overexpression of MYEOV was found in only 2 of 10 translocated cases, paralleling the findings in MM cell lines.15 Because the enhancers are joined to both CCND1 and MYEOV in myelomas with a breakpoint in switch γ or switch α sites and since MYEOV expression is lost in most of these cases, our data strongly suggest that MMs do not favor MYEOV expression.
An interesting finding is the definition of a subgroup of MM patients with significant correlation between low to intermediate cyclin D1 mRNA overexpression and chromosome 11 polysomy (13/14; P < .0001). The presence of stable, intermediate cyclin D1 mRNA levels in several follow-up biopsies of 2 patients with chromosome 11 polysomy, taken up to 5 years apart, supports the notion that polysomy 11 is an essential factor related to cyclin D1 overexpression in these patients. Nevertheless, whether polysomy 11 per se directly or indirectly causes increased cyclin D1 expression in these cases remains to be clarified. The influence of the gene dosage effect through polysomy on cyclin D1 levels is difficult to explain since, until now, it has been considered that cyclin D1 is normally not expressed in lymphoid cells. The frequency of polysomy 11 in our study (29%) is in the range of what has been reported previously (17%-37%).27,30-33 However, the impact of this abnormality on cyclin D1 expression has not been thoroughly addressed. As shown in the present study, quantitative RT-PCR and not immunohistochemistry seems to be the method of choice to study this possible relationship: we found cyclin D1 staining in only 5 of 14 cases with polysomy 11, whereas 13 of 14 cases showed overexpression as determined by RT-PCR (Table 2). Similarly, in an immunohistochemical analysis by Pruneri et al,30 only 2 of 13 cases with trisomy 11 showed cyclin D1 overexpression. In a recent study, Soverini et al,27 using real-time RT-PCR, showed that MM with trisomy 11 significantly overexpressed cyclin D1. However, in contrast to our data, where a clear distinction between patients harboring the t(11;14) translocation and those with trisomy 11 was observed, they found some overlap between the 2 groups. This discrepancy most probably reflects differences in the methodology. Whereas Soverini et al27 used unpurified mononuclear cell fractions, we analyzed pure tumor cell populations obtained by microdissection.
There is still a small proportion of MM cases with intermediate overexpression of cyclin D1, lack of t(11;14), and no apparent molecular abnormalities of CCND1 (2 of 15 cases, case 13 and 14), leaving open the possibility of additional deregulating mechanisms. One potential explanation, DNA amplification in the 11q13 region, frequently observed in solid tumors,34 was not found in any of our MM cases, as shown by FISH and quantitative PCR of cyclin D1 genomic DNA (data not shown). Other mechanisms include transcriptional regulatory mechanisms or insertion of any immunoglobulin regulatory elements, such as the 3′α enhancer, as described for the U266 MM cell line.35 In case of insertion, both breakpoints are located in the region flanked by cos6.7/cCl-11-44 and cos6.31/cosH1.5, and, therefore, this aberration will not be detected with the probe sets used in this study.
In contrast to previous studies,12,36 it is now accepted that MM with the t(11;14)(q13;q32) translocation represents a unique subset of patients with a relatively favorable outcome.37,38 Future studies examining prognosis of MM should take into consideration that cyclin D1 can be up-regulated independently of a t(11;14) translocation, as demonstrated in this study.
Prepublished online as Blood First Edition Paper, April 13, 2004; DOI 10.1182/blood-2003-11-3837.
Supported in part by a grant from the Deutsche Forschungsgemeinschaft (FE 597/1-1; F.F., L.Q.-M., and M.K.) and by the European Community, project QLRT-1999-30687.
K.S. and E.H. contributed equally to the work.
The publication costs of this article were defrayed in part by page charge payment. Therefore, and solely to indicate this fact, this article is hereby marked “advertisement” in accordance with 18 U.S.C. section 1734.
The authors thank Ulrike Reich, Jaqueline Müller, Daniela Angermeier, Elenore Samson, and Nadin Kink for their excellent technical assistance.

