Abstract
The leukocyte activation marker CD69 is a novel regulator of the immune response, modulating the production of cytokines including transforming growth factor-β (TGF-β). We have generated an antimurine CD69 monoclonal antibody (mAb), CD69.2.2, which down-regulates CD69 expression in vivo but does not deplete CD69-expressing cells. Therapeutic administration of CD69.2.2 to wild-type mice induces significant natural killer (NK) cell–dependent antitumor responses to major histocompatibility complex (MHC) class I low RMA-S lymphomas and to RM-1 prostatic carcinoma lung metastases. These in vivo antitumor responses are comparable to those seen in CD69-/- mice. Enhanced host NK cytotoxic activity correlates with a reduction in NK-cell TGF-β production and is independent of tumor priming. In vitro studies demonstrate the novel ability of anti-CD69 mAbs to activate resting NK cells in an Fc receptor–independent manner, resulting in a substantial increase in both NK-cell cytolytic activity and interferon γ (IFNγ) production. Modulation of the innate immune system with monoclonal antibodies to host CD69 thus provides a novel means to antagonize tumor growth and metastasis.
Introduction
CD69 is expressed in all leukocytes during activation,1 with rapid kinetic onset (2-4 hours) in lymphoid cells.2 The CD69 gene is located within the natural killer (NK) complex controlling NK-cell activity.1,2 Both the genetic and the biochemical characteristics of the mouse CD69 molecule are quite similar to its human homolog.1,3-5 Our recent studies show that the CD69 molecule is in fact a negative regulator of the immune response in part through production of transforming growth factor-β (TGF-β). CD69 deficiency promotes both autoimmune and antitumor responses.6,7 The in vivo antitumor response was evaluated by analyzing the susceptibility of CD69-/- mice to tumors.7 CD69-/- mice showed an enhanced NK-mediated antitumor response that led to greater protection and rejection of major histocompatibility complex (MHC) class I low tumor cells compared with wild-type (wt) mice. This potent antitumor response was associated with altered cytokine patterns, reduced TGF-β production, and an increase in local lymphocyte responses. Consistent with these data, the CD69-/- mice showed a greater incidence and severity of collagen-induced arthritis, again correlated with reduced TGF-β production.6 In addition, CD69 engagement promoted active TGF-β production in murine and human leukocytes in vitro, further evidence for the role of the CD69 molecule as an inhibitor of immune responses. TGF-β1 is known to regulate both the production of immune mediators and lymphocyte differentiation.8-12 Generally, TGF-β1 down-regulates immunoresponse and plays a major role in tumor responses,13-15 both in animal models and in human tumor cells in vitro.16,17
Significant progress is now being made in augmenting specific immune effector functions in experimental tumor therapy, particularly using monoclonal antibodies (mAbs).18-22 Antitumor immunity is strongly enhanced by the blockade of the inhibitory effects of different costimulatory pathways.20,23-27 In particular, blockade of cytotoxic T lymphocyte–associated antigen 4 (CTLA-4) shows dramatic antitumor effects in multiple animal models,28-30 and has shown preliminary encouraging efficacy in early clinical trials.31,32 Since CD69 is a novel negative regulator of the immune response, we have begun to explore the targeting of CD69 with mAbs as an alternative means to strengthen antitumor responses.
The present study shows the ability of a nondepleting immunoglobulin G1 (IgG1) isotype CD69 mAb to treat mice bearing both primary and metastatic class I low tumors. Reduced tumor growth correlates with increased NK cytotoxicity, as measured in vivo and ex vivo, and this increase is independent of tumor challenge. The anti-CD69 mAb enhances the activity of host NK cells, mediated by a reduction in TGF-β. In vitro studies also reveal the capacity of the anti-CD69 mAb to induce NK activity in naive splenocytes. These findings provide clear evidence for a novel approach to tumor therapy through mAb modulation of immune system via host CD69.
Materials and methods
Mice
Mice were bred at the Centro Nacional de Biotecnología (Madrid, Spain) under specific pathogen-free conditions and at the University of Barcelona in a conventional facility. All experiments were performed using mice on the C57BL/6 genetic background, except in vivo immunization with 300.19 cells, which carried out in BALB/c mice. C57BL/6 wild-type and gene-targeted CD69-/- mice5 were 6 to 12 weeks of age, and littermates or was age-matched litters whose parents were littermates were used as controls. All procedures involving animals and their care were approved by the Ethics Committee of the University of Barcelona and were conducted according to institutional guidelines that are in compliance with national (Generalitat de Catalunya decree 214/1997, DOGC 2450) and international (Guide for the Care and Use of Laboratory Animals, National Institutes of Health publication 85-23, 1985) laws and policies.
Cell culture
The RM-1 prostate carcinoma (H-2b; a gift from Dr T. Thompson, Baylor College of Medicine, Houston, TX), YAC-1 (H-2a), and RMA-S (H-2b) mutant lymphoma cells (derived from Rauscher virus–induced murine cell line RBL-5 and defective for peptide loading of MHC class I molecules) and 300.19 cells (BALB/c pre–B cells) were cultured in RPMI 1640 medium supplemented with 10% heat-inactivated fetal calf serum (FCS), 2 mM L-glutamine, 100 U/mL penicillin, and 100 μg/mL streptomycin (Sigma, St Louis, MO) at 37°C, 5% CO2.
Tumor growth in vivo
Tumor cells (RMA-S) in 200 μL of phosphate-buffered saline (PBS) were injected intraperitoneally or subcutaneously (50 μL) in CD69.2.2-treated mice and isotype control (irrelevant IgG1)–treated wt mice as indicated. Mice were observed by monitoring body weight daily for tumor ascites development for 12 weeks. Mice were killed, for ethical reasons, when the body weight had increased by 25%, corresponding to obvious signs of irreversible tumor growth and moribund animals.
RM-1 lung colonization
RM-1 cells (1 × 10⁴) suspended in 200 μL PBS were injected into the tail vein of 8-week-old C57BL/6 mice. At days 1 and 5 after tumor inoculation, mice were treated with 500 μg of CD69.2.2 mAb or 500 μg of isotype control mAb (IgG1). Mice were killed 16 days later, the lungs were removed and fixed in 4% paraformaldehyde solution, and individual surface lung metastases were counted with the aid of a dissecting microscope.
Flow cytometry
Cells (1 × 10⁶) were first preincubated with a blocking solution (PBS with 5% heat inactivated fetal calf serum, 15% heat-inactivated rabbit serum, 0.02% sodium azide, and 2.4G2 mAb) to avoid binding of Abs to Fcγ receptors. Cells were then stained for 30 minutes on ice with fluoroscein isothiocyanate (FITC)– or phycoerythrin (PE)–conjugated antibodies or with biotinylated antibodies followed by streptavidin-FITC or -PE (Southern Biotech, Birmingham, AL) The following antibodies were used: anti-DX5 (DX5; NK cells), anti-2B4 (2B4; NK cells), anti-CD3 (145-2C11; T cells), anti-B220/CD45 (RA3-6B2; B cells), anti-LY6G (RB6-8C5; granulocytes), anti-IgD (SBA-1), and anti-CD69 (H1.2F3) (all from PharMingen, San Diego, CA, except anti-IgD [SBA-1] from Southern Biotech). Finally, cells were washed and analyzed on FACSCalibur flow cytometer (Becton Dickinson, Mountain View, CA), counting 104 live cells and using CellQuest software (Becton Dickinson). For intracellular cytokine staining, spleen cells were treated with mAb CD69.2.2 or isotype control mAb (20 μg/mL). After 18 hours of culture in Stem Span serum-free medium (Stem Cell Technologies, London, United Kingdom), cells were first stimulated with phorbol 12-myristate 13-acetate (50 ng/mL) and ionomycin (1 μM) for 6 hours in the presence of Golgi Stop (BD Pharmingen, San Diego, CA). Subsequently, cells were surface-labeled with anti-DX5, fixed, and permeabilized, then stained with anti-IFNγ–FITC (XMG1.2) antibody (BD Pharmingen).
Antibody-dependent cellular cytotoxicity assay
Purified spleen NK cells were obtained using the CELLection Biotin Binder Kit (Dynal, Oslo, Norway) and biotinylated anti-DX5 antibody according to manufacturer's instructions. Briefly, viable single-cell suspensions were incubated (1 hour at 37°C) on polystyrene tissue-culture dishes (Becton Dickinson, Mountain View, CA). Nonadherent spleen cells were incubated (15 minutes, 4°C) with biotinylated anti-DX5 antibody, washed twice, and CELLection biotin magnetic Dynabeads (Dynal Biotech, Oslo, Norway) (1 × 10⁷ magnetic beads per 1 × 10⁶ cells) added to capture antibody-coated cells. Cell purity was always greater than 98% DX5+. NK cells were cultured in complete medium with 20% inactivated FCS with 1000 U/mL human recombinant interleukin-2 (rIL-2). After 72 hours, the IL-2–activated NK cells (effector cells) were mixed with RMA-S target cells at different ratios. CD69.2.2 mAb or isotype control mAb were added at 10 μg/mL and antibody-dependent cell cytotoxicity was analyzed by a standard 51Cr release assay.
51Cr-release assays
Direct NK-cell cytotoxic activity was assessed by a standard chromium 51 (51Cr) release assay. In all experiments, 5 × 10³ Na251CrO4-labeled target cells (RM-1, RMA-S, or YAC-1) were mixed with effector cells at the ratios indicated (4 hours, 37°C). Spontaneous 51Cr release was determined by incubating target cells with medium alone; maximum release was determined by adding Triton X-100 at a final concentration of 2.5%. The percentage of specific lysis was calculated as percentage specific lysis = [(sample cpm - spontaneous cpm)/(maximal cpm - spontaneous cpm)] × 100. Spontaneous 51Cr release was always less than 10%, and all experiments were performed in triplicate.
In vivo NK cytotoxicity assay
C57BL/6 wt mice were treated with 200 μg of mAb CD69.2.2 or isotype control. After 16 hours of mAb inoculation, NK target tumor cells (RM-1, RMA-S, or YAC-1) were labeled 51Cr with 0.74 MBq/mL (20 μCi/mL) sodium chromate (1 hour, 37°C). Cells (5 × 10⁴) suspended in 200 μL PBS were intravenously or intraperitoneally injected in mAb CD69.2.2– or isotype control mAb–treated mice. Dead cells were removed by centrifugation on a Nycodenz density cushion (Sigma) before inoculation. Mice were killed 4 hours later, and the distribution of the radioactivity in different organs (lung or peritoneum) was measured.
Ribonuclease protection assay and quantitative real-time reverse transcriptase–polymerase chain reaction analyses
Total RNA was extracted from splenocytes or purified NK cells using Tri Reagent (Sigma) as recommended. Ribonuclease (Rnase) protection assays (RPAs) were performed on 1 to 20 μg of total RNA using the Riboquant MultiProbe RNase Protection Assay System (PharMingen, San Diego, CA) following manufacturer's instructions. Multiprobe template sets mCK2b and mCK3b were used. DNA templates were used to synthesize the [32P] uridine 5′ triphosphate (UTP)–labeled probes (111 TBq/mM, 370 MBq/mL [3000 Ci/mM, 10 mCi/mL]; Amersham Life Science, Buckinghamshire, United Kingdom) in the presence of a cytosine-adenine-guanine-uracyl (GACU) pool using a T7 RNA polymerase. Hybridization with 1-20 μg of each target RNA was performed overnight, followed by digestion with RNase A and T1 according to the standard protocol. Samples were then treated with a proteinase K–sodium dodecyl sulfate (SDS) mixture, extracted with chloropan, and precipitated in the presence of ammonium acetate. Samples were run in an acrylamide-urea sequencing gel, next to the labeled probes, at 45 W with 0.5 × Tris (tris(hydroxymethyl)aminomethane)–borate/EDTA (ethylenediaminetetraacetic acid) buffer (TBE). The gel was adsorbed to filter paper, dried under vacuum, and exposed on a film (X-AR; Eastman Kodak, Rochester, NY) with an intensifying screen at -70°C. For reverse transcriptase–polymerase chain reaction (RT-PCR), 2 μg of deoxyribonuclease (DNase) I-treated RNA was reverse transcribed with murine leukemia virus (MuLV) RT (Roche Diagnostics, Lewes, United Kingdom). Real-time PCR was performed in a Lightcycler rapid thermal cycler system (Roche Diagnostics) using primers from different exons that generated products of about 200 base pair (bp) length. Results for each cytokine are normalized to GAPDH (glyceraldehyde-3-phosphate dehydrogenase) expression measured in parallel in each sample.
Monoclonal antibody production
A new panel of mouse CD69–specific mAbs was generated by fusion of NS-1 myeloma cells with spleen cells from a CD69-/- mouse previously immunized 3 times with mouse 300-19 pre–B cells as described previously.7
Complement-dependent cytotoxicity assay
RMA-S cells were labeled with 3.7 MBq (100 μCi) of Na2 51CrO4 (Amersham Pharmacia Biotech, Uppsala, Sweden) for 2 hours at 37°C. After washing the cells 4 times, 1 × 10⁴ cells were plated in 96-well V-bottom microtiter plates with culture medium supplemented with 10% FCS. mAb was added to each well at the final concentration as indicated. The plates were incubated 30 minutes at 4°C. Then, rabbit complement (Cederlane, Hornby, Ontario, Canada) to a final dilution of 1/10, or culture medium, was added. Subsequently, the plates were incubated for 45 minutes at 37°C and then centrifuged at 200g for 5 minutes. The counts per minute (cpm) of 51Cr in 100 μL aliquots of each supernatant were measured. Spontaneous release of 51Cr was determined by incubating the target cells with medium alone, while the maximum release was determined by adding Triton X-100 at a final concentration of 2.5%. The percentage of specific lysis was calculated as follows: percentage specific lysis = [(sample cpm - spontaneous cpm)/(maximal cpm - spontaneous cpm)] × 100. The spontaneous release of 51Cr was always less than 10%, and all experiments were run in triplicate.
Immunoprecipitation
Approximately 108 C57BL/6 mouse thymocytes were washed 3 times in PBS. Thymocytes were then surface labeled with 300 μL of Sulfo N-hydroxysuccinimide ester (NHS)-Biotin 1 mg/mL (Sigma) for 30 minutes at 4°C. Cells were lysed and precleared 3 times for 2 hours at 4°C using 40 μL of protein G Sepharose (Amersham Pharmacia Biotech) and 10 μg of an unreactive mAb. Immunoprecipitations were carried out using 10 μg of purified CD69 mAbs, and 10 μg of purified isotype control. Immunoprecipitates were washed and then analyzed by sodium dodecyl sulfate–polyacrylamide gel electrophoresis (SDS-PAGE). The samples were run in the presence or absence of 5% 2-mercaptoethanol (reducing or nonreducing conditions). Molecular weight was determined using a prestained standard molecular weight marker (Sigma). The proteins were transferred by electroblotting with glycine transfer buffer to polyvinylidene difluoride (PVDF) membranes (Immobilon; Millipore, Boston, MA), and incubated with avidin-peroxidase 100 ng/mL (Sigma). After 45 minutes the membranes were developed using Amersham Enhancer Chemoluminiscence reagent (Amersham International, Little Chalfont, United Kingdom).
Internalization assay
Spleen lymphocytes from C57BL/6 wt mice were incubated overnight with 20 ng/mL of phorbol 12-myristate 13-acetate (PMA; Calbiochem, EMB Biosciences, San Diego, CA). CD69+ lymphocytes were incubated 30 minutes at 4°C with purified anti-CD69.2.2 or isotype control (10 μg/mL). After wash and centrifuge, the lymphocytes were incubated 25 minutes on ice with GAM-alexa488 (Molecular Probes, Eugene, OR). Lymphocytes were divided in 2 parts. One part was incubated 1 hour on ice, and the other part was incubated 1 hour at 37°C. Aliquots were removed, washed once with ice-cold PBS, and divided into 2 other parts. One part was left untreated on ice, while the other was incubated at 4°C for 45 seconds in PBS solution acidified to pH 2.0 with HCl and supplemented with 0.03 M sucrose and 10% FCS. Samples were then washed in a large excess of RPMI 1640 supplemented with 10% FCS and 100 mM HEPES (N-2-hydroxyethylpiperazine-N′-2-ethanesulfonic acid) buffer. Cells were fixed and analyzed by confocal microscopy (Olympus Fluoview 500, UPLAN APO 60×/1.40/oil) for Alexa488. Untreated samples account for total cell-associated fluorescence, while acid stripped aliquots account for Alexa488 fluorescence in acid-resistant (internal) compartments.
Statistical analysis
Where indicated, the Student t test for nonpaired data and the Mann-Whitney U test were used to calculate statistical significance for differences in a particular measurement between different groups. Statistical significance was set at a P value less than .05.
Results
Generation and characterization of anti–murine CD69 mAbs
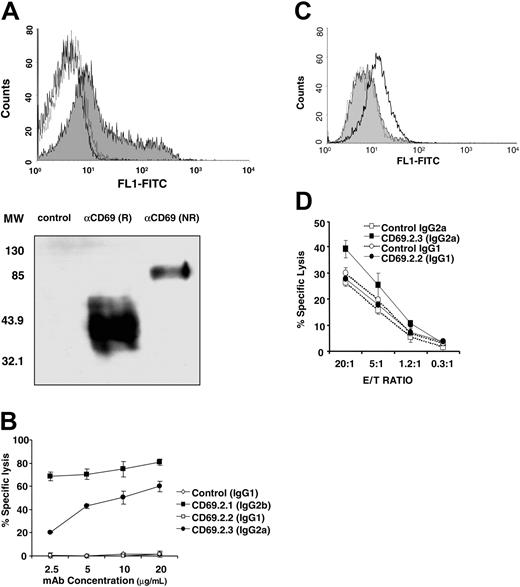
CD69-/- mice were immunized with CD69+ murine cells, and a panel of mAbs specific for murine CD69 was isolated. mAb specificity was defined by recognition of murine CD69-transfected CHO and Jurkat cells but not of untransfected cells. The specificity of selected mAbs was confirmed first through staining of wt mouse thymocytes, a subset of which is known to express CD69, but not thymocytes from CD69-/- mice (Figure 1A, top). Second, immunoprecipitations from CD69+ splenocytes showed the expected bands (40 kDa reduced, 85 kDa nonreduced) corresponding to the murine CD69 molecule, as described (Figure 1A, bottom).33
Complement-dependent lysis of CD69+ target cells mediated by anti-CD69 mAbs of different isotypes was evaluated. No lysis of target cells was detected with IgG1 isotype mAb CD69.2.2. In contrast, IgG2a isotype mAb CD69.2.3 and IgG2b isotype mAb CD69.2.1 effectively lysed CD69+ target cells in the presence of complement (Figure 1B). Cytolytic activity was not observed in the presence of the control monoclonal antibodies of nonrelated specificity (Figure 1B). The binding of anti-CD69 mAbs to Fc recptor (FcR+) cells was next examined using macrophages obtained from CD69-/- mice. The IgG1 isotype mAb CD69.2.2 did not bind to CD69-/- macrophages, in contrast to the IgG2a isotype mAb CD69.2.3, as assessed by fluorescence-activated cell sorting (FACS; Figure 1C). Accordingly, NK-cell–dependent antibody-dependent cellular cytotoxicity (ADCC) activity was observed using mAb CD69.2.3 but not mAb CD69.2.2 (Figure 1D). Furthermore, the induction of FcR-dependent cell death by FcRIII-expressing granulocytes and macrophages as effector cells was not detected using mAb CD69.2.2 (data not shown). Thus, the specific IgG1 isotype anti–murine CD69 mAb CD69.2.2 minimizes the interaction of CD69+ cells with both FcR-expressing cells and the complement system, and was selected to further evaluate the in vivo function of CD69.
Characterization of mAb CD69.2.2. (A) (Top) The specific binding of CD69.2.2 mAb to CD69 in thymocytes from wt (gray shaded curve) and CD69-/- mice (dotted line) was determined by flow cytometry analysis. Isotype control (IgG1) is indicated by solid line. (Bottom) Immunoprecipitation of cell lysates from murine thymocytes with mAb CD69.2.2. As a negative control a nonrelated mAb (IgG1) was used. The immunoprecipitated samples were separated in an SDS-PAGE gel in reducing conditions (R) and nonreducing conditions (NR). Molecular weight (MW) markers are indicated in kDa. (B-D) MAb CD69.2.2 does not fix complement or induce ADCC. (B) Results of complement-mediated cytotoxicity assays using different anti–murine CD69 mAbs. The mAbs CD69.2.1 (IgG2b) and CD69.2.3 (IgG2a) were used as positive controls. RMA-S cells served as the target. (C) mAb binding to Fc receptors in CD69-/- macrophages was determined by flow cytometry analysis. The CD69.2.2 (IgG1) mAb is represented by the gray shaded curve, while the positive control mAb (CD69.2.3, IgG2a) is represented by the black line. The negative control is represented by the broken line. (D) ADCC activity mediated by mAb CD69.2.2 (IgG1) and CD69.2.3 (IgG2a) assessed using IL-2–activated NK cells as effectors cells and RMA-S as target cells. E/T ratio indicates effector-target ratio. Error bars represent standard deviation.
Characterization of mAb CD69.2.2. (A) (Top) The specific binding of CD69.2.2 mAb to CD69 in thymocytes from wt (gray shaded curve) and CD69-/- mice (dotted line) was determined by flow cytometry analysis. Isotype control (IgG1) is indicated by solid line. (Bottom) Immunoprecipitation of cell lysates from murine thymocytes with mAb CD69.2.2. As a negative control a nonrelated mAb (IgG1) was used. The immunoprecipitated samples were separated in an SDS-PAGE gel in reducing conditions (R) and nonreducing conditions (NR). Molecular weight (MW) markers are indicated in kDa. (B-D) MAb CD69.2.2 does not fix complement or induce ADCC. (B) Results of complement-mediated cytotoxicity assays using different anti–murine CD69 mAbs. The mAbs CD69.2.1 (IgG2b) and CD69.2.3 (IgG2a) were used as positive controls. RMA-S cells served as the target. (C) mAb binding to Fc receptors in CD69-/- macrophages was determined by flow cytometry analysis. The CD69.2.2 (IgG1) mAb is represented by the gray shaded curve, while the positive control mAb (CD69.2.3, IgG2a) is represented by the black line. The negative control is represented by the broken line. (D) ADCC activity mediated by mAb CD69.2.2 (IgG1) and CD69.2.3 (IgG2a) assessed using IL-2–activated NK cells as effectors cells and RMA-S as target cells. E/T ratio indicates effector-target ratio. Error bars represent standard deviation.
mAb CD69.2.2 internalizes murine CD69 in vitro and in vivo
To investigate CD69 internalization in vitro, confocal microscopy was used. CD69+ cells at 37°C or at 4°C were incubated with FITC-labeled mAb CD69.2.2 for 1 hour, and then acid-stripped to remove cell-surface–bound FITC-mAb CD69.2.2 (Figure 2A). Acid-stripped CD69+ cells incubated at 37°C showed intense intracellular fluorescence (Figure 2A). In contrast, in cells incubated with FITC-mAb CD69.2.2 at 4°C fluorescence was completely removed after acid treatment. Thus, CD69 was readily internalized in vitro at 37°C after binding mAb CD69.2.2.
To investigate CD69 internalization in vivo, C57B6 mice were treated intraperitoneally with 500 μg mAb CD69.2.2 or isotype control mAb (IgG1). Loss of CD69 expression was assessed both by the binding of FITC-labeled hamster anti–murine CD69 mAb, and independently with an anti–mouse IgG second antibody (data not shown). No staining was detected with the anti–mouse IgG, discounting the possibility of crossblocking of the anti–murine CD69–specific reagent by mAb CD69.2.2. The treatment resulted in loss of CD69 expression in all cells of the thymus, bone marrow, and peripheral lymphoid organs for a period of at least 15 days, as assessed by FACS (Figure 2B-C). Importantly, the loss of CD69 expression occurred in vivo without changing the pattern of CD3, B220, CD4, CD8, or CD5 surface molecules; nor were any changes observed in the leukocyte subpopulation frequency in the primary or secondary lymphoid organs or in the blood compartment (Figure 2B-C and data not shown). Together, these results show that the indicated treatment with mAb CD69.2.2 causes the selective loss of CD69 expression with no detectable alterations in any hematopoietic or thymic maturation processes.
mAb CD69.2.2 induces CD69 internalization in activated lymphocytes in vitro and inhibition of CD69 expression in vivo. (A) CD69+ lymphocytes, previously stained with mAb CD69.2.2 antibodies and GAMalexa488, were incubated at 4°C or 37°C for 1 hour (left column). Incubation with PBS (pH 2.0; right column), removes membrane-bound mAbs. Representative photographs were taken by confocal microscopy. (B-C) C57BL/6 mice were treated at 8 weeks of age with a single injection (500 μg intraperitoneally) of mAb CD69.2.2 or control mAb (IgG1). Lymphocytes from treated mice were analyzed by flow cytometry. Representative profiles of B cells (B220/CD69) in lymph node (LN), spleen, and peritoneum 15 days after injection are shown (B). Bone marrow and LN lymphocytes (C) were subjected to flow cytometric analysis. Representative profiles of B220/IgM, IgD/IgM, LY6G/B220, and CD3/B220 are shown with the percentage of cells in each quadrant.
mAb CD69.2.2 induces CD69 internalization in activated lymphocytes in vitro and inhibition of CD69 expression in vivo. (A) CD69+ lymphocytes, previously stained with mAb CD69.2.2 antibodies and GAMalexa488, were incubated at 4°C or 37°C for 1 hour (left column). Incubation with PBS (pH 2.0; right column), removes membrane-bound mAbs. Representative photographs were taken by confocal microscopy. (B-C) C57BL/6 mice were treated at 8 weeks of age with a single injection (500 μg intraperitoneally) of mAb CD69.2.2 or control mAb (IgG1). Lymphocytes from treated mice were analyzed by flow cytometry. Representative profiles of B cells (B220/CD69) in lymph node (LN), spleen, and peritoneum 15 days after injection are shown (B). Bone marrow and LN lymphocytes (C) were subjected to flow cytometric analysis. Representative profiles of B220/IgM, IgD/IgM, LY6G/B220, and CD3/B220 are shown with the percentage of cells in each quadrant.
Therapeutic delivery of anti-CD69 mAb mediates antitumor responses
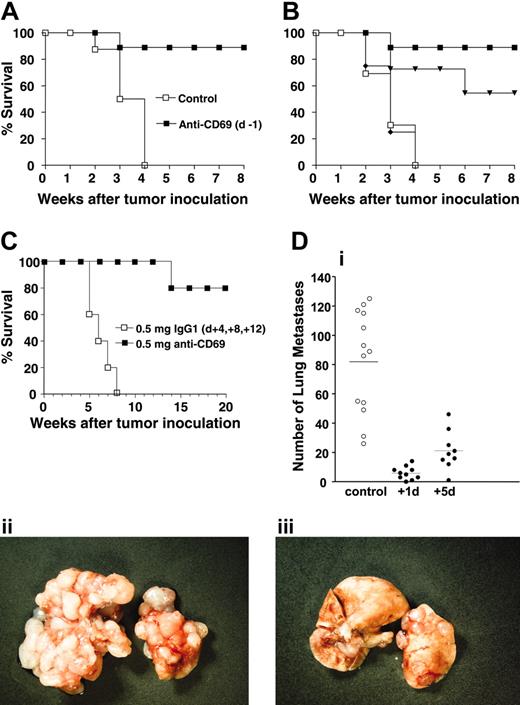
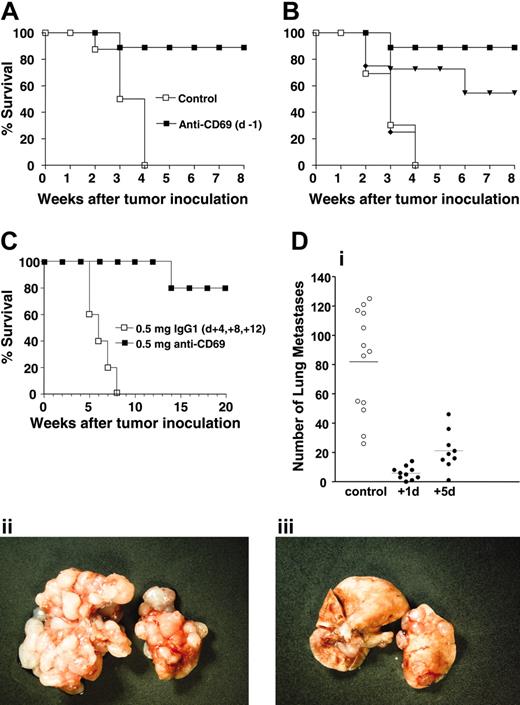
To examine in vivo the role of CD69 in tumor therapy, the effects of mAb CD69.2.2 were first evaluated in C57B6 mice bearing MHC class I low syngeneic RMA-S tumors, which are known to be eliminated via an NK-cell–dependent immune response.16 The C57B6 mice receiving RMA-S tumor cells (105, intraperitoneally) developed lethal tumors, and 100% of the animals succumbed within 4 weeks (Figure 3A). In contrast, when the mice were treated with mAb CD69.2.2 1 day prior to tumor cell injection, more than 80% of the mice remained alive and tumor free after 8 weeks (Figure 3A). Importantly, when the antibody was used therapeutically in wt mice, essentially identical results were obtained when mAb was given 1 day following tumor injection, and significant inhibition was still seen even when mAb CD69.2.2 was administered 3 days after tumor injection, indicative of efficacy when given therapeutically (Figure 3B). Furthermore, when tumor cells were injected subcutaneously in wt mice, all control animals died by 8 weeks, while more than 80% of the mice remained alive and tumor free 20 weeks after treatment with mAb CD69.2.2 at days 4, 8, and 12 after tumor injection (Figure 3C). These results suggest that the repeated injection of mAb CD69.2.2 may significantly enhance therapeutic responses. Finally, mAb treatment of both severe combined immunodeficient (SCID) mice and RAG-1-/- mice (1 × 10⁶ RMA-S cells intraperitoneally, mAb CD69.2.2 at - 1 day) also provided a significant survival advantage, showing that tumor cell elimination can occur in the absence of T and B cells (data not shown). To investigate the therapeutic potential of mAb CD69.2.2 against experimental metastases, animals were treated at different time points after intravenous challenge with RM-1 tumor cells, and pulmonary metastases were analyzed after 16 days. Even 5 days after tumor inoculation, mAb 2.2 drastically reduced tumor metastasis (Figure 3D). Taken together, these results validate CD69 as a host target in tumor therapeutic approaches, with some of the anti-CD69–induced tumor cell elimination occurring early in the induced immune response, and in the absence of T and B lymphocytes.
The effect of anti-CD69 mAbs on NK-cell cytotoxicity and TGF-β production
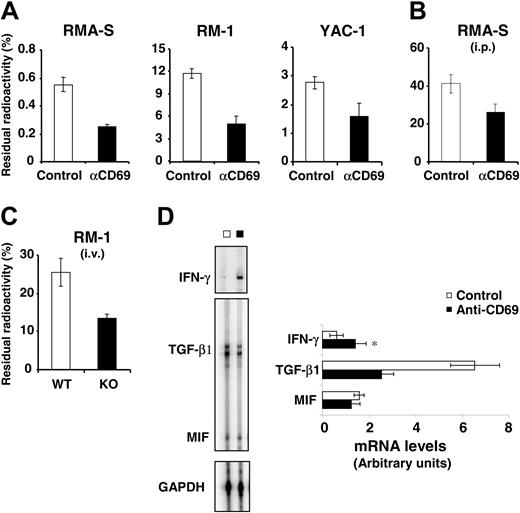
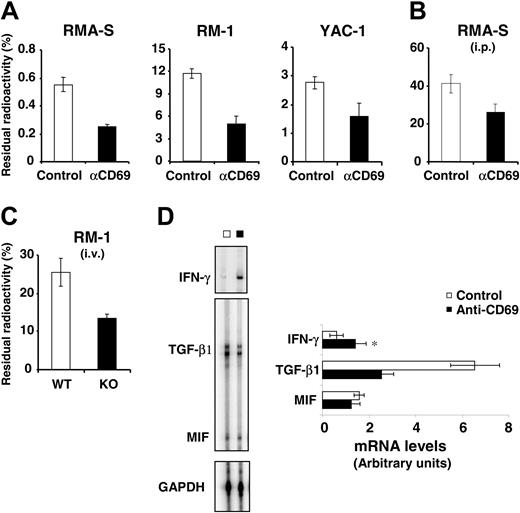
To evaluate directly the induction of NK cytotoxic effector function by anti-CD69 mAb CD69.2.2, the activation of host cells was assessed by measuring cytotoxicity in vivo. Mice were treated with mAb CD69.2.2 or control isotype mAb. Sixteen hours later, 5 × 10⁴ radioactively labeled RMA-S, RM-1, or YAC-1 tumor cells were injected intravenously, and NK-dependent cytotoxicity was measured 4 hours later in multiple organs. As shown in Figure 4 A-B, the cytotoxic activity consistently and significantly increased in the mice treated with mAb CD69.2.2, compared with the mice treated with the control isotype mAb. A similar increase in cytotoxic activity was also observed in CD69-/- compared with wt mice when the RM-1 tumor target cells were injected intravenously. (Figure 4C).
Enhanced in vivo antitumor survival in anti-CD69–treated mice. Survival profiles of C57BL/6 mice treated with mAb CD69.2.2 or with control isotype are shown. The C57BL/6 mice were inoculated intraperitoneally with 105 RMA-S cells and treated with 1 single dose (500 μg mAb), either 1 day before (A, ▪) or 1 (▪), 3 (▾), or 5 days (♦) after (B) inoculation with RMA-S cells. □ indicates control. C57BL/6 mice (C) were treated (500 μg mAb) 4, 8, and 12 days after inoculation subcutaneously with 105 RMA-S cells. C57BL/6 mice (D) were injected intravenously with 104 RM-1 cells and were treated with 1 dose (500 μg) of mAb CD69.2.2 or isotype control mAb either on day 1 or 5 after tumor challenge. (i) Number of lung metastases was counted 16 days after tumor inoculation. Each symbol represents 1 mouse: ○ indicates control mAb; •, mAb CD69.2.2. Photographs are of lungs from mAb CD69.2.2 (+1 day) (iii) or control mAb–treated mice (ii). (A, n = 7; B, n = 5; C, n = 5; D, n = 9). Panels A-C show 1 of 2 independent experiments. Panel D combines the results from 2 independent experiments. The mean number of lung metastases is represented by horizontal bars.
Enhanced in vivo antitumor survival in anti-CD69–treated mice. Survival profiles of C57BL/6 mice treated with mAb CD69.2.2 or with control isotype are shown. The C57BL/6 mice were inoculated intraperitoneally with 105 RMA-S cells and treated with 1 single dose (500 μg mAb), either 1 day before (A, ▪) or 1 (▪), 3 (▾), or 5 days (♦) after (B) inoculation with RMA-S cells. □ indicates control. C57BL/6 mice (C) were treated (500 μg mAb) 4, 8, and 12 days after inoculation subcutaneously with 105 RMA-S cells. C57BL/6 mice (D) were injected intravenously with 104 RM-1 cells and were treated with 1 dose (500 μg) of mAb CD69.2.2 or isotype control mAb either on day 1 or 5 after tumor challenge. (i) Number of lung metastases was counted 16 days after tumor inoculation. Each symbol represents 1 mouse: ○ indicates control mAb; •, mAb CD69.2.2. Photographs are of lungs from mAb CD69.2.2 (+1 day) (iii) or control mAb–treated mice (ii). (A, n = 7; B, n = 5; C, n = 5; D, n = 9). Panels A-C show 1 of 2 independent experiments. Panel D combines the results from 2 independent experiments. The mean number of lung metastases is represented by horizontal bars.
To further investigate the NK-cell antitumor response resulting from treatment with mAb CD69.2.2, the induction of soluble immune mediators in NK cells was examined. RPAs were performed on purified NK peritoneal cells isolated from mice 3 days after challenge with RM-1 tumor cells, and treated with either mAb CD69.2.2 or isotype control mAb (Figure 4D). The findings showed a significant decrease in TGF-β1 mRNA expression, and a significant increase in IFNγ expression, in the mAb CD69.2.2–treated mice. Levels of migration inhibitory factor (MIF) were unchanged. TGF-β1 mRNA expression in the NK cells of control mice was almost double the expression level in those of anti-CD69 mAb–treated mice. Because it is well documented that TGF-β1 decreases NK-cell cytotoxicity,34 these results are consistent with the in vivo activation of NK cytotoxicity by mAb CD69.2.2.
CD69 expressed by tumor cells plays no role in antitumor effects
The elimination by anti-CD69 mAb of both CD69- RM-1 and CD69+ RMA-S tumor cells was very similar (Figures 3, 4), suggesting the NK cytotoxicity induced by mAb CD69.2.2 is independent of CD69 expression on RMA-S tumor cells.
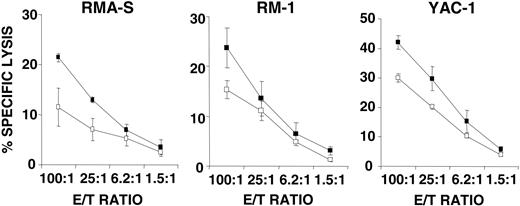
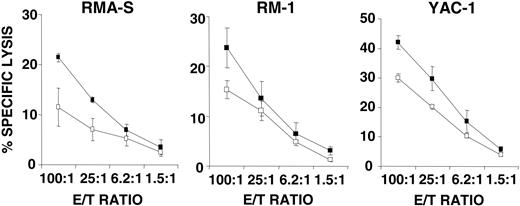
If the antitumor response in mAb CD69.2.2–treated wt mice is due to the interaction of mAb with CD69+ host immune cells, then splenocytes from nontumor-primed mAb CD69.2.2–treated mice should show increased capacity to lyse in vitro NK target cells. Indeed, a significant increase in lysis of MHC class I low tumor cells was found when the splenocytes of mAb CD69.2.2–treated mice were compared with those from isotype control mAb–treated mice (Figure 5). These findings show that the increased antitumor cytotoxicity induced by anti-CD69 mAb treatment can be mediated by the increased activity of the immune effector cells without interaction between tumor cells and mAb CD69.2.2.
To further address the role, if any, of tumor cell expression of CD69, the in vivo effects of the mAb CD69.2.2 treatment were monitored in CD69-/- mice by the ex vivo analysis of peritoneal cells 3 days after intraperitoneal inoculation with a large number (8 × 10⁶) of CD69+ RMA-S tumor cells. Mice treated with mAb CD69.2.2 or isotype control mAb showed similar overgrowth of RMA-S cells (data not shown). These findings are consistent with the fact that no induction of death or arrest cycling of RMA-S cells was detected by propidium iodide (PI) cycle analysis in vitro in the presence of mAb CD69.2.2 either alone or together with anti–mouse IgG mAb (data not shown).
Cytotoxicity and TGF-β1 mRNA expression in NK-cells induced in the antitumor response of anti-CD69–treated mice. Mice treated with 200 μg of mAb CD69.2.2 or with isotype control mAb (intraperitoneally 16 hours prior to injection with the tumor cells) were injected intravenously with 5 × 10⁴ RMA-S, RM-1, or YAC-1 cells (A), intraperitoneally with 5 × 10⁴ RMA-S cells (B), or intravenously with 5 × 10⁴ RM-1 cells in both wt and CD69-/- (KO) mice (C). RMA-S, RM-1, and YAC-1 were labeled with 51Cr prior to injection. Four hours after injection of labeled cells, the percentage of residual radioactivity remaining in the lungs (A,C) or in the peritoneum (B) was determined. Data are expressed as percentages of the total radioactivity injected (mean ± SD). (A, n = 5; B, n = 4; C, n = 4). The results are representative of 2 similar experiments. (D) Relative levels of cytokine mRNA in NK-cells purified from the peritoneum 3 days after the intraperitoneal inoculation of 105 RM-1 cells into either control mice (□) or mice treated (▪) with 200 μg of mAb CD69.2.2 (on days - 1 and +1 of tumor inoculation). The data are expressed in arbitrary densitometric units normalized for the expression of GAPDH in each sample. Five animals were used per experimental group, and results are representative of 2 separate experiments. Error bars represent standard deviation (*P < .05).
Cytotoxicity and TGF-β1 mRNA expression in NK-cells induced in the antitumor response of anti-CD69–treated mice. Mice treated with 200 μg of mAb CD69.2.2 or with isotype control mAb (intraperitoneally 16 hours prior to injection with the tumor cells) were injected intravenously with 5 × 10⁴ RMA-S, RM-1, or YAC-1 cells (A), intraperitoneally with 5 × 10⁴ RMA-S cells (B), or intravenously with 5 × 10⁴ RM-1 cells in both wt and CD69-/- (KO) mice (C). RMA-S, RM-1, and YAC-1 were labeled with 51Cr prior to injection. Four hours after injection of labeled cells, the percentage of residual radioactivity remaining in the lungs (A,C) or in the peritoneum (B) was determined. Data are expressed as percentages of the total radioactivity injected (mean ± SD). (A, n = 5; B, n = 4; C, n = 4). The results are representative of 2 similar experiments. (D) Relative levels of cytokine mRNA in NK-cells purified from the peritoneum 3 days after the intraperitoneal inoculation of 105 RM-1 cells into either control mice (□) or mice treated (▪) with 200 μg of mAb CD69.2.2 (on days - 1 and +1 of tumor inoculation). The data are expressed in arbitrary densitometric units normalized for the expression of GAPDH in each sample. Five animals were used per experimental group, and results are representative of 2 separate experiments. Error bars represent standard deviation (*P < .05).
In vivo effect of anti-CD69 treatment in the absence of tumor challenge. The splenocytes of mice treated in vivo with mAb CD69.2.2 or control isotype mAb were examined ex vivo. Twenty-four hours after mAb injection (200 μg intravenously), cytotoxicity of splenocytes against RMA-S, RM-1, and YAC-1 target cells was assessed. The findings represent 2 experiments conducted independently. ▪ indicates the splenocytes of mice treated with mAb CD69.2.2, and □, the control mice (n = 4; mean ± SD).
In vivo effect of anti-CD69 treatment in the absence of tumor challenge. The splenocytes of mice treated in vivo with mAb CD69.2.2 or control isotype mAb were examined ex vivo. Twenty-four hours after mAb injection (200 μg intravenously), cytotoxicity of splenocytes against RMA-S, RM-1, and YAC-1 target cells was assessed. The findings represent 2 experiments conducted independently. ▪ indicates the splenocytes of mice treated with mAb CD69.2.2, and □, the control mice (n = 4; mean ± SD).
Taken together, these data all suggest that the direct interaction of mAb CD69.2.2 with CD69+ tumor cells is either irrelevant or plays a very minor role in its in vivo effects.
Anti-CD69 mAb triggers NK-cell functions on resting NK cells in vitro
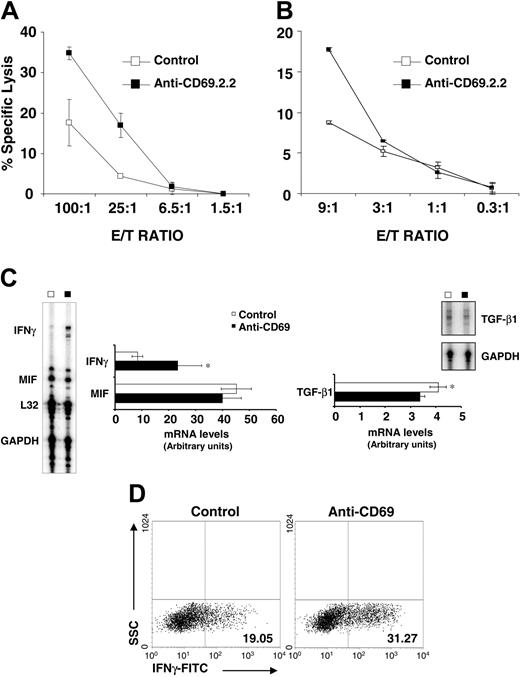
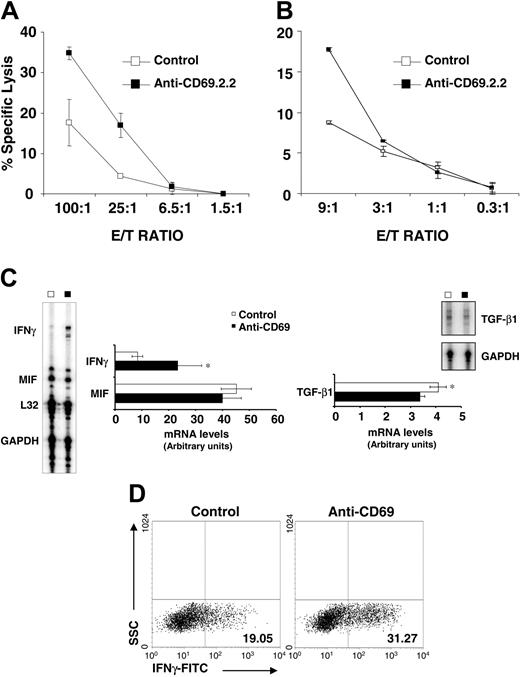
Our in vivo data described revealed that anti-CD69 mAb CD69.2.2 enhanced NK-cell cytotoxicity in the absence of FcR binding, tumor stimulation, or other NK stimuli. Therefore, we next determined whether mAb CD69.2.2 could activate resting NK cells in vitro, as measured by NK-cell cytolytic activity and IFNγ production after 18 hours of mAb treatment. When resting splenocytes were cultured with mAb CD69.2.2, specific lysis of RMA-S cells was achieved (Figure 6A). Furthermore, purified NK cells from mAb CD69.2.2–treated splenocytes also demonstrated higher cytotoxicity than NK cells isolated from isotype mAb–treated cultures (Figure 6B). Consistent with these results, and with those of Figure 4D, exposure of splenocytes to mAb CD69.2.2 down-regulated TGF-β mRNA expression and enhanced both IFNγ cytokine mRNA expression (Figure 6C) and intracellular IFNγ protein levels (Figure 6D).
These results show for the first time that an anti-CD69 mAb can trigger NK cytotoxic activity in vitro independent of Fc receptors, and emphasize that anti-CD69 mAb–based immunotherapy can promote NK-cell activation in vivo in the absence of host stromal interactions.
Discussion
Recent insights from CD69-/- mice have shown the leukocyte activation marker CD69 to be a novel negative regulator of the immune response, in part through production of TGF-β. Here we report that a novel murine anti–murine CD69 mAb, designated mAb CD69.2.2, selected to down-modulate cell surface–expressed CD69 in vivo but not deplete CD69-expressing cells, can generate potent host-derived antitumor responses similar to those seen in CD69-/- mice. These in vivo antitumor responses are associated with significantly reduced TGF-β production by NK cells derived from tumor-bearing animals. Furthermore, treatment of healthy animals with mAb CD69.2.2 generates NK cells tumoricidal to MHC class I low targets in the absence of tumor priming. Importantly, our results assign to CD69 a new function, as we show that mAb CD69.2.2 in vitro can trigger both cytolytic activity in resting NK cells and IFNγ secretion.
To test whether the induced absence of CD69 expression in wt mice leads to antitumor survival, as it does in CD69-/- animals, we selected an anti-CD69 antibody that targets CD69 without activating Fc-dependent or complement-dependent functions. The anti-CD69 mAb CD69.2.2 did not fix mouse complement, activate classical ADCC mediated by NK cells, or induce FcR-mediated death by FcRIII-expressing cells. However, mAb CD69.2.2 treatment internalized CD69 in vitro, and resulted in loss of CD69 expression in vivo for extended periods of time, yet with no apparent detrimental effects on any immune competent cell types. Thus, by means of this anti-CD69 mAb treatment, we obtained transiently CD69-deficient mice, a valuable model for assessing the effects of loss of CD69 on tumor growth.
In preliminary experiments we had found that treatment with mAb CD69.2.2 inhibited the intraperitoneal growth of CD69+ RMA-S cells over a short 3-day period, and that pretreatment of animals with mAb CD69.2.2 inhibited the growth of lung metastases of CD69- RM-1 cells.7 Here we significantly extend these studies. We show that pretreatment with mAb CD69.2.2 results in a dramatic effect on survival in animals given RMA-S tumors (Figure 3A); that therapeutic treatment with a single dose of mAb CD69.2.2 1 or 3 days after RMA-S injection also extends survival (Figure 3B); and that therapeutic treatment with multiple doses of mAb CD69.2.2 4, 8, and 12 days after RMA-S subcutaneous injection significantly extends survival (Figure 3C). Furthermore, therapeutic treatment with mAb CD69.2.2 of animals injected intravenous with RM-1 cells, either 1 or 5 days after injection, dramatically reduces the number of lung metastases measured at day 16 (Figure 3D).
In vitro induction of NK cytoxicity and IFNγ mRNA after CD69 stimulation. Splenocytes from 8-week-old wt mice were incubated in vitro with mAb CD69.2.2 or isotype control mAb (IgG1) and after 18 hours cytotoxic activity was assayed with RMA-S tumor cells as target cells. Results of standard 51Cr cytotoxic assay are shown for total spleen cells (A) and purified NK cells (B). Results shown are representative of 3 independent experiments. (C) mAb CD69.2.2 increases IFNγ mRNA in splenocytes in vitro. mAb CD69.2.2 or isotype control mAb were added at 20 μg/mL and levels of IFNγ, MIF, and TGF-β mRNA were determined by RPA. Results are expressed in arbitrary densitometric units normalized for the expression of GAPDH in each sample. Four animals were used per experimental group, and results shown are representative of 4 separate experiments. (D) mAb CD69.2.2 induces IFNγ production in mouse NK cells. Cells were incubated in serum-free medium for 18 hours and IFNγ was determined by intracellular staining. Dot plots represent the distribution of side scatter (SSC) versus IFNγ–expressing cells among gated DX5+ NK cells. Numbers in left quadrants represent the percentage of INF-γ positive cells. Results are representative of 2 independent experiments and 4 animals were used per experimental group. Error bars represent standard deviation (*P < .05).
In vitro induction of NK cytoxicity and IFNγ mRNA after CD69 stimulation. Splenocytes from 8-week-old wt mice were incubated in vitro with mAb CD69.2.2 or isotype control mAb (IgG1) and after 18 hours cytotoxic activity was assayed with RMA-S tumor cells as target cells. Results of standard 51Cr cytotoxic assay are shown for total spleen cells (A) and purified NK cells (B). Results shown are representative of 3 independent experiments. (C) mAb CD69.2.2 increases IFNγ mRNA in splenocytes in vitro. mAb CD69.2.2 or isotype control mAb were added at 20 μg/mL and levels of IFNγ, MIF, and TGF-β mRNA were determined by RPA. Results are expressed in arbitrary densitometric units normalized for the expression of GAPDH in each sample. Four animals were used per experimental group, and results shown are representative of 4 separate experiments. (D) mAb CD69.2.2 induces IFNγ production in mouse NK cells. Cells were incubated in serum-free medium for 18 hours and IFNγ was determined by intracellular staining. Dot plots represent the distribution of side scatter (SSC) versus IFNγ–expressing cells among gated DX5+ NK cells. Numbers in left quadrants represent the percentage of INF-γ positive cells. Results are representative of 2 independent experiments and 4 animals were used per experimental group. Error bars represent standard deviation (*P < .05).
Approaches to active cell-mediated immunotherapy of malignant diseases include the activation of NK effector cells, part of the innate arm of antitumor immunity. Indeed, many reports have suggested NK cells are involved in mediating antitumor effects.35-40 Therefore, it is generally accepted that the host innate immune response is essential in controlling the dissemination and growth of metastatic tumors and influences the prognosis of the tumor-bearing host. Nevertheless, to our knowledge very few studies have documented the ability of mAbs to specifically modulate NK-cell activity to therapeutic advantage in vivo.22 Here our data show that this is clearly the case. First, mAb CD69.2.2 enhanced NK cytotoxic effector function against multiple MHC class I low target cells in a short term in vivo assay (Figure 4). Second, purified NK cells from RM-1 tumor cell–challenged mice showed a significant decrease in TGF-β1 mRNA and a significant increase in IFNγ mRNA (Figure 4D). Third, the antitumor effects of mAb CD69.2.2 are still observed in SCID and RAG-/- mice (data not shown). Most importantly, we show for the first time the capacity of an anti-CD69 mAb to promote NK-cell function both in vitro and in vivo in unstimulated NK cells. Thus, mAb CD69.2.2 triggers NK-cell tumoricidal function in vivo in naive mice and in vitro in unstimulated splenocytes.
The molecular mechanisms underlying this interaction remain to be elucidated. Mechanisms of NK-cell cytotoxicity activation by costimulatory molecules have been described41,42 and new studies reveal novel roles for regulatory molecules on NK cells.43 Similarly, mAb CD69.2.2 promotes NK cytolytic activity in the presence or absence of the tumor microenvironment. Consequently, in vivo treatment with anti-CD69 mAbs, in both preventative or therapeutic settings, is efficient in promoting NK-cell–dependent tumor elimination. Importantly, this occurs in the face of significant levels of TGF-β made by the tumors themselves. We have found that both the RMA-S and RM-1 tumor cells used here make high levels of TGF-β1 (E.E., unpublished observations), as do most tumors. Although the elimination of MHC class I high tumors by T-cell–dependent mechanisms is well established, tumor-derived TGF-β1 is known to easily override the tumoricidal properties of CD8+ T cells.44 In contrast, the host CD69/TGF-β1 axis described here seems much less affected by tumor-derived TGF-β1 production. A requirement for cell-surface TGF-β1 and cell-cell contact for inhibition is one possible explanation,45,46 but clearly further work is needed to understand this phenomenon. Nevertheless, there may exist a TGF-β1 threshold above which this CD69/TGF-β1 axis may collapse, as seems to occur in the therapeutic experiment when mAb CD69.2.2 is delivered after 5 days of intraperitoneal tumor inoculation (Figure 3B).
The therapeutic properties of anti-CD69 mAb CD69.2.2 resemble those described for mAbs to inhibitory immune receptors of the CD28/B7 family.47,48 In vivo treatment of mice with anti–CTLA-4 mAbs induces a CTL-dependent immune response leading to tumor regression in transplantable and spontaneous carcinoma tumor models,28,49 and a humanized antibody to CTLA-4 has shown favorable initial responses in clinical trials.31,32 Also, blockade of the B7-H1 molecule interaction with mAbs has shown antitumor effects mediated through regulatory cytokine inhibition.50 In addition, the inhibition of regulatory cytokine effects mediating the immune eradication of tumors was reported to occur through blockade of TGF-β signaling in T cells44 or diminishing TGF-β presence on antigen-presenting cells.13
One striking feature of the data presented here is the remarkable degree to which the anti-CD69 mAb–treated mice resemble the CD69-/- mice. This is apparent at all levels examined, including tumor survival, NK cytotoxicity, and NK-cell TGF-β expression.7 Importantly, treatment with mAb CD69.2.2 internalizes cell surface CD69 yet has no effect on leukocyte subsets in general, and CD69-expressing subsets in particular, within the lymphoid system. The conservation of NK-dependent antitumor properties between CD69-/- and mAb CD69.2.2–treated mice is relevant because these properties are promptly induced within few hours of mAb treatment, favoring rapid NK-cell–target tumor cell interactions.
In conclusion, our observations indicate that anti-CD69 mAb CD69.2.2 mediates NK-cell cytotoxic activation, in part through inhibition of TGF-β production. Furthermore, our results clearly demonstrate that blockade of CD69 allows the development of optimal antitumor responses. Thus, CD69 must be added to the growing list of cell-surface receptors that provide powerful new targets for the development of immune therapies.
Prepublished online as Blood First Edition Paper, February 3, 2005; DOI 10.1182/blood-2004-10-3854.
Supported by grant No. SAF 2002-02 895 from the Ministerio de Ciencia y Tecnología.
The publication costs of this article were defrayed in part by page charge payment. Therefore, and solely to indicate this fact, this article is hereby marked “advertisement” in accordance with 18 U.S.C. section 1734.
We are grateful to Dr Roy R. Lobb for excellent critical reading of the manuscript, to Dr D. Sancho, Dr C. Martinez-A, and Dr F. Sanchez-Madrid for support and helpful discussion, and to A. Hobbs for editorial assistance. We also thank Dr Pilar Pallarés for her technical assistance and T. Cueva for maintaining the mice colony.


