Abstract
Measurement of liver iron concentration (LIC) is necessary for a range of iron-loading disorders such as hereditary hemochromatosis, thalassemia, sickle cell disease, aplastic anemia, and myelodysplasia. Currently, chemical analysis of needle biopsy specimens is the most common accepted method of measurement. This study presents a readily available noninvasive method of measuring and imaging LICs in vivo using clinical 1.5-T magnetic resonance imaging units. Mean liver proton transverse relaxation rates (R2) were measured for 105 humans. A value for the LIC for each subject was obtained by chemical assay of a needle biopsy specimen. High degrees of sensitivity and specificity of R2 to biopsy LICs were found at the clinically significant LIC thresholds of 1.8, 3.2, 7.0, and 15.0 mg Fe/g dry tissue. A calibration curve relating liver R2 to LIC has been deduced from the data covering the range of LICs from 0.3 to 42.7 mg Fe/g dry tissue. Proton transverse relaxation rates in aqueous paramagnetic solutions were also measured on each magnetic resonance imaging unit to ensure instrument-independent results. Measurements of proton transverse relaxivity of aqueous MnCl2 phantoms on 13 different magnetic resonance imaging units using the method yielded a coefficient of variation of 2.1%.
Introduction
Body iron loading is associated with disorders such as hereditary hemochromatosis (HH), thalassemia, sickle cell disease, aplastic anemia, myelodysplasia, and others.1 The body iron burden is a principal determinant of clinical outcome in all forms of systemic iron overload, whether from red blood cell transfusion, from increased dietary iron absorption, or both. Accurate assessment of the body iron burden is essential for managing iron chelation therapy to prevent iron toxicity while avoiding the adverse effects of excess chelator administration. In hereditary and nonhereditary forms of hemochromatosis, determination of the magnitude of body iron stores permits identification of individuals at risk of iron-induced organ damage who would benefit from phlebotomy therapy.
The simplest methods available for assessment of body iron levels are biochemical measurements of the serum iron concentration, transferrin saturation, and ferritin concentration.2 However, serum biochemical tests can be confounded by factors such as infection, inflammation, and malignancy3,4 and do not accurately reflect tissue iron levels. The reference method for evaluating the magnitude of body iron load in systemic iron overload is measurement of the liver iron concentration (LIC).5 The most direct clinical method of measuring LIC is through chemical analysis of needle biopsy specimens. The biopsy sample can also be used for detection of liver fibrosis and cirrhosis, which have important prognostic implications for survival and risk of hepatocellular carcinoma. However, the measurement of LIC and detection of fibrosis or cirrhosis in biopsy specimens are subject to sampling variability, owing mainly to the small size of the biopsy relative to the whole liver.6-8 The variation in LIC throughout the liver increases as iron loading increases and with the development of cirrhosis.7 The coefficient of variation (CV) values for multiple needle biopsy measurements of LICs from individual livers range from an average of 19% for disease-free liver7,8 to an average of more than 40% for end-stage liver disease7,8 for typical needle biopsy sample dry masses of less than 4 mg. The analytical component of the variability has been estimated to be in the region of 3% to 7%.7,9 Furthermore, the invasive nature and risks associated with liver needle biopsy preclude serial observations.
Here we report a new noninvasive method for the measurement and imaging of LICs in vivo through the measurement of tissue proton transverse relaxation rates (R2) using clinical magnetic resonance imaging (MRI) instruments.
Patients, materials, and methods
MRI
Single spin-echo image acquisition. MRI on human subjects was conducted on five 1.5-T whole body imaging units (Siemens MAGNETOM Vision Plus [n = 4] and Siemens SONATA [n = 1], Munich, Germany). Phased array torso coils were used for signal detection. Axial images were acquired with a multislice single spin-echo (SSE) pulse sequence, with a pulse repetition time TR of 2500 msec, spin echo times TE of 6, 9, 12, 15, and 18 msec, and slice thickness of 5 mm. A matrix size of 256 was used with typical fields of view being between 350 and 400 mm (exact dimensions depending on subject size). Each spin-echo sequence was run with fixed gain settings determined by the TE = 6 msec acquisition. Data were acquired in half Fourier mode to reduce measurement time with one acquisition. No fat suppression was used. A 1000-mL bag of Hartmann solution (compound sodium lactate; Baxter Healthcare, Toongabbie, NSW, Australia) was imaged with both the phantoms and human subjects to provide an external long T2 reference for the correction of instrumental gain drift.
For liver studies, each subject was positioned so that the liver was located central to the phased array torso coil. Slices (n = 19) were collected for each subject, with the gap between slices adjusted to enable entire coverage of the liver (minimum gap size, 5 mm).
R2 imaging. R2 values were calculated throughout a liver slice by curve fitting the equation for the bi-exponential decay in transverse magnetization following an SSE pulse sequence to the voxel intensity data as a function of TE.10 A mean R2 value was calculated for each voxel by summation of the fast and slow components of the proton transverse relaxation rate weighted by their relative population densities as described elsewhere.10 To reduce image noise, the voxel intensities were smoothed over a 5 × 5 window kernel prior to curve fitting. Respiratory ghosting in the SSE images was reduced prior to generation of the R2 images using methods described elsewhere.11 The generation of the liver R2 images is described in greater detail elsewhere.12
Selection of region of interest for R2 analysis. For each subject, the largest axial slice of the liver was selected for R2 image analysis. Given the heterogeneity of LIC and R2 within the human liver, the R2 measurement and needle biopsy site were approximately colocated to determine the relationship between R2 and LIC. A lateral region of the right lobe of the liver bounded by its surface and a sagittal plane 35 mm medial to its most lateral surface point was used to calculate a mean R2 value (<R2>) for purposes of generating a calibration curve relating R2 to LIC. To quantify the heterogeneity in R2 for a subject, the entire slice of the liver was used for calculation of the SD of R2 (σR2).
Phantoms
The precision and accuracy of R2 measurements made using each MRI scanner were assessed by measuring a series of MnCl2 solutions with different concentrations, prepared by serial dilution of a stock solution with distilled water. Concentrations ranged from 0.1 to 3.2 mM, which provided R2 values in the range encompassed by healthy through to highly iron-loaded liver. The phantoms were also measured on a variety of other makes and models of 1.5-T MRI scanners to assess the variation in the results of R2 measurement methodology on different types of scanners. The instruments on which the R2 measurements of the phantoms were tested included Siemens Magnetom Vision (n = 5), Siemens Symphony (n = 2), Siemens Sonata (n = 1; Siemens, Munich, Germany), Philips Intera (n = 3; Best, the Netherlands), and General Electric Signa (n = 2; Milwaukee, WI).
Human subjects
All subjects gave written consent to participation in the study. All procedures on subjects were approved by the Human Ethics Committees at the University of Western Australia (Perth) and St John of God Hospital (Perth, Australia) and also by the Committee on Human Rights Related to Human Experimentation at Mahidol University (Bangkok, Thailand).
R2-LIC calibration. Subjects included patients who were about to undergo liver needle biopsy performed by their clinicians for the assessment of iron overload disorder or liver disease. The liver biopsy was used for routine histologic examination and LIC measurement. MRI scanning was scheduled as close as possible to the liver biopsy procedure (a few days) or within 1 to 2 months for those volunteers who did not warrant clinical treatment for iron overload.
For the iron-loaded subjects, 2 major conditions were included in the study: hereditary hemochromatosis (HH) and thalassemia disorders. The HH group consisted of subjects homozygous for the C282Y mutation on the HFE gene (n = 23; age range, 17-74 years). The thalassemia group included individuals with β-thalassemia who had been treated with regular blood transfusion and chelation therapy (n = 9; age range, 8-36 years) and those with β-thalassemia/hemoglobin E who had not received regular blood transfusions nor chelation therapy (n = 41; age range, 12-63 years). The non—iron-loaded group consisted of subjects with hepatitis. From the 32 volunteers in this group, 29 had hepatitis C. Other cases of hepatitis were alcohol induced (n = 2) and drug induced (n = 1). Three of the subjects with hepatitis C were heterozygous for the C282Y mutation of the HFE gene.
Reproducibility tests (precision) of liver R2 measurements. Subjects included 3 healthy volunteers, 5 with β-thalassemia major, and 2 with HH. Each volunteer was measured on 2 MRI scanners (both Siemens Magnetom Vision), the 2 measurements being made on consecutive days. The entire cross-section of the largest liver slice was used for the determination of the mean R2 value in each case.
Determination of liver biopsy iron concentration
The chemical analysis for LIC measurement was conducted with atomic absorption spectrometry after acid digestion (4 laboratories). All samples had dry weights more than 0.4 mg. Quality control studies for interlaboratory assay were first performed using standard reference liver material (National Bureau of Standards BL1577a) and aliquots from a homogenized specimen of iron-loaded liver tissue. The CV of LIC measurements between laboratories was 12%, comparable with the CV of 11% found for interlaboratory LIC measurements in a previous study of 48 laboratories.9
R2-LIC calibration
An empirical analytical expression for a calibration curve relating liver <R2> to biopsy LIC was found by modeling curves to the data with the aid of nonlinear regression algorithms. The calibration equation has the form: <R2> = a + bxd + cx2d, where <R2> is the mean liver R2 value in units of s-1, x is the mean liver iron concentration in units of (mg Fe) · (g dry tissue)-1, and a, b, c, and d are constants with the values, 6.88 s-1, 26.06 s-1 · (mg Fe)-0.701 · (g dry tissue)1.402, -0.438 s-1 · (mg Fe)-1.402 · (g dry tissue)0.701, and 0.701, respectively.
Statistical analyses
The Spearman rank order test was used to determine the nonparametric correlation between the R2 measurements and liver biopsy LIC. The methods of Bland and Altman13 were used to determine the 95% limits of agreement between R2-LIC measurements and biopsy LIC measurements. Sensitivity and specificity of the R2-LIC measurement to discrimination of biopsy LIC values above certain clinically important LIC thresholds were evaluated. Confidence limits for the sensitivity and specificity were obtained using the Wilson score method.14 Areas under receiver operating characteristic (ROC) plots were evaluated at each of the clinically important LIC thresholds by calculating the true positive fraction and true negative fraction for detection of LICs above the clinically important threshold for each possible cut-off value of mean liver R2.15 SEs on the areas under the ROC plots were evaluated using the approximations of Hanley and McNeil.16
Results
Measurement of R2 for aqueous MnCl2 phantoms
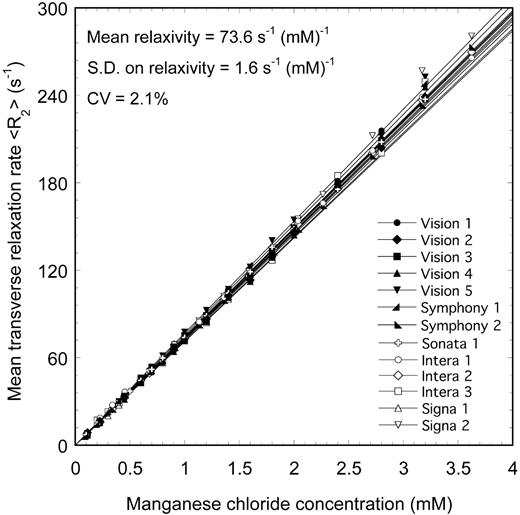
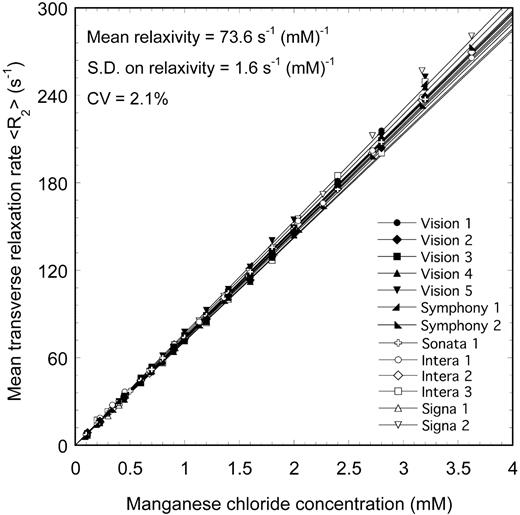
Measurements of R2 for a series of aqueous MnCl2 phantoms with a range of ionic concentrations were made using 13 different MRI scanners (Figure 1) using techniques based on methods described elsewhere10,12,17,18 and summarized earlier (see “MRI”). The mean relaxivity value obtained from the 13 scanners was 73.6 s-1 (mM)-1, with an SD of 1.6 s-1 · mM-1. The CV of relaxivity measured on the 13 scanners was 2.1%, demonstrating a high degree of reproducibility of the R2 measurement technique on phantoms.
<R2> versus MnCl2 concentration for aqueous MnCl2 phantoms measured on 13 different 1.5-T MRI scanners. The solid lines are linear fits to the data.
<R2> versus MnCl2 concentration for aqueous MnCl2 phantoms measured on 13 different 1.5-T MRI scanners. The solid lines are linear fits to the data.
Measurement of R2 and iron concentration for liver tissue in vivo
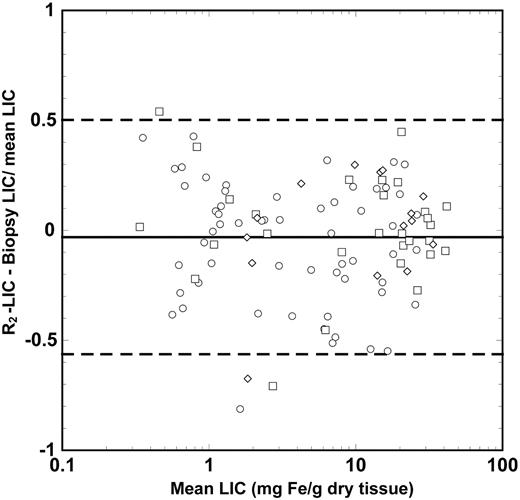
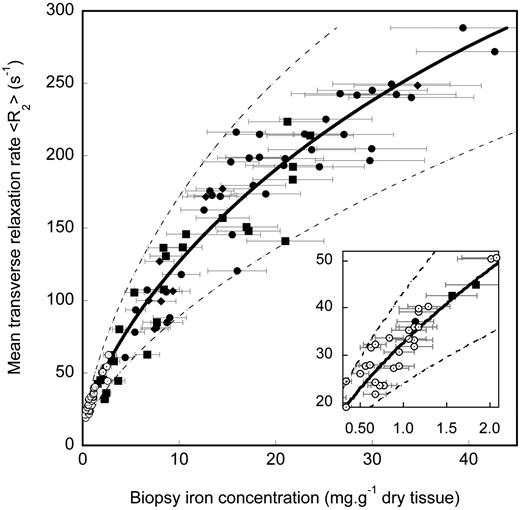
Biopsy LIC values measured for the 105 human subjects ranged from 0.3 to 42.7 mg Fe/g dry liver tissue. A highly significant correlation (ρ = 0.98, P < .0001) was found between biopsy LIC and liver <R2> measurements for the region of interest in the right lobe of the liver as determined by the Spearman rank order test for all subjects (Figure 2). The 95% limits of agreement between R2-LIC and biopsy LIC values were found 50% and -56% (Figure 3). These limits of agreement are comparable with an expected repeatability coefficient between 2 needle biopsy LIC measurements from different parts of a fibrosis-free liver of 53% (based on an average CV of needle biopsy LIC measurements from a single liver of 19%7,8 for biopsy specimens of < 4 mg dry tissue).
R2-LIC calibration curve. Liver <R2> measurement for the region bounded by the surface of the right lobe of the liver and a sagittal plane 35 mm medial to the most lateral surface point versus needle biopsy LIC. The solid line is the calibration determined by curve fitting to the data. The Pearson correlation coefficient of the calibration with the data is r = 0.98. The error bars indicate the estimated ± 19% uncertainties on biopsy measurement of average LICs. The uncertainty of 19% is based on studies of LIC heterogeneity in fibrosis-free liver.7,8 The dashed lines indicate the 95% limits of agreement between R2-LIC and biopsy LIC. Subject groups are hepatitis (○), HH (▪), β-thalassemia/hemoglobin E (•), and β-thalassemia ( ).
).
R2-LIC calibration curve. Liver <R2> measurement for the region bounded by the surface of the right lobe of the liver and a sagittal plane 35 mm medial to the most lateral surface point versus needle biopsy LIC. The solid line is the calibration determined by curve fitting to the data. The Pearson correlation coefficient of the calibration with the data is r = 0.98. The error bars indicate the estimated ± 19% uncertainties on biopsy measurement of average LICs. The uncertainty of 19% is based on studies of LIC heterogeneity in fibrosis-free liver.7,8 The dashed lines indicate the 95% limits of agreement between R2-LIC and biopsy LIC. Subject groups are hepatitis (○), HH (▪), β-thalassemia/hemoglobin E (•), and β-thalassemia ( ).
).
Bland Altman plot showing the differences between R2-LIC and biopsy LIC. The solid line shows the mean difference between the 2 measurements, whereas the dashed lines indicate the upper and lower 95% limits of agreement between the 2 measurements. The different data symbols differentiate between the different fibrosis stages: stages 0 and 1, ○; stages 2 to 4, □; and stages 5 and 6, ⋄.
Bland Altman plot showing the differences between R2-LIC and biopsy LIC. The solid line shows the mean difference between the 2 measurements, whereas the dashed lines indicate the upper and lower 95% limits of agreement between the 2 measurements. The different data symbols differentiate between the different fibrosis stages: stages 0 and 1, ○; stages 2 to 4, □; and stages 5 and 6, ⋄.
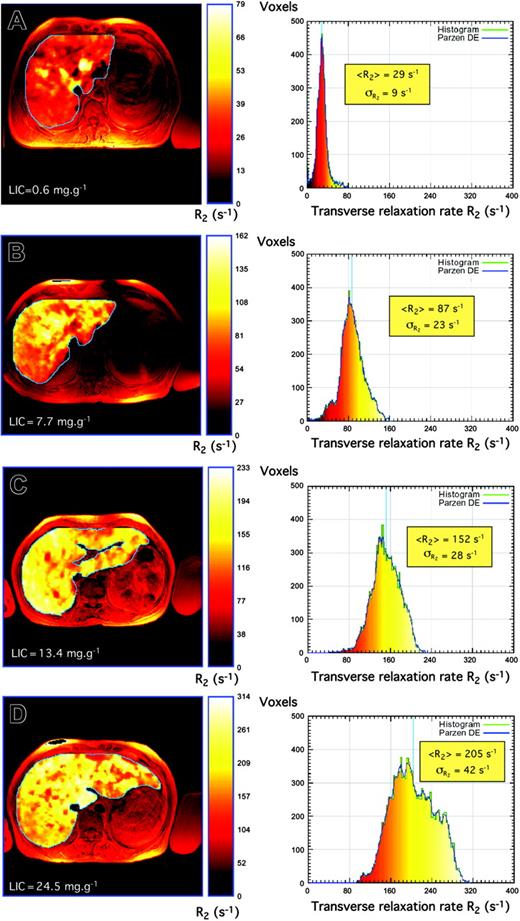
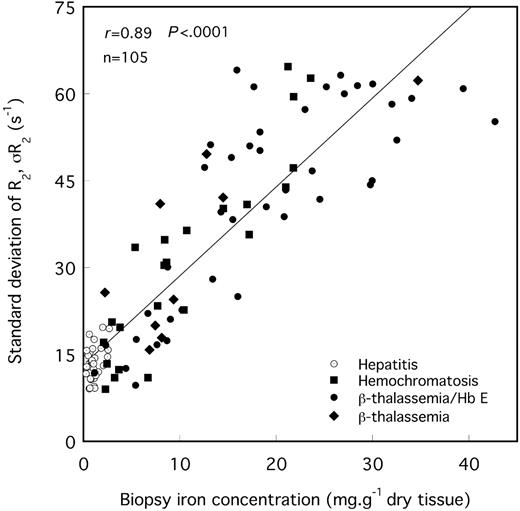
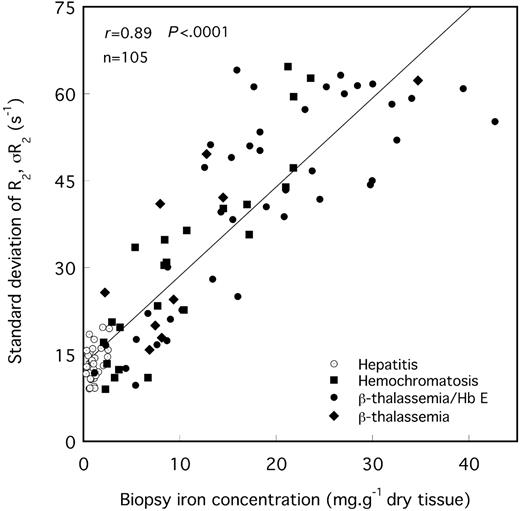
The means and modes of the liver R2 distributions shift to higher values of R2 with increasing biopsy LICs (Figures 2 and 4). Furthermore, there is a general increase in R2 variability throughout the liver with increasing biopsy LIC, which is evident as a broadening of the R2 distribution (Figures 4, 5). The mean CV of R2 throughout the maximum area axial slices of the liver for all 105 volunteers was 29% ± 8% (mean ± SD).
Liver R2 images and distributions. Liver R2 images and distributions for 4 subjects with different degrees of iron overload and pathologic conditions: (A) hepatitis, (B) HH, (C) β-thalassemia, and (D) β-thalassemia/hemoglobin E. Note that the liver R2 images are superimposed on standard spin-echo images for registration purposes. Principles of construction of R2 images and distributions are described elsewhere.44 Note that to enable visualization of the heterogeneity of R2 within each liver, the color scale within each liver is adjusted for each image such that zero corresponds to voxel R2 of zero, whereas the maximum of the color scale is scaled to the maximum R2 value within the liver.
Liver R2 images and distributions. Liver R2 images and distributions for 4 subjects with different degrees of iron overload and pathologic conditions: (A) hepatitis, (B) HH, (C) β-thalassemia, and (D) β-thalassemia/hemoglobin E. Note that the liver R2 images are superimposed on standard spin-echo images for registration purposes. Principles of construction of R2 images and distributions are described elsewhere.44 Note that to enable visualization of the heterogeneity of R2 within each liver, the color scale within each liver is adjusted for each image such that zero corresponds to voxel R2 of zero, whereas the maximum of the color scale is scaled to the maximum R2 value within the liver.
SD of R2 for the maximum area liver slice versus needle biopsy iron concentration. The solid line is a linear fit to the data with a Pearson correlation coefficient of r = 0.89.
SD of R2 for the maximum area liver slice versus needle biopsy iron concentration. The solid line is a linear fit to the data with a Pearson correlation coefficient of r = 0.89.
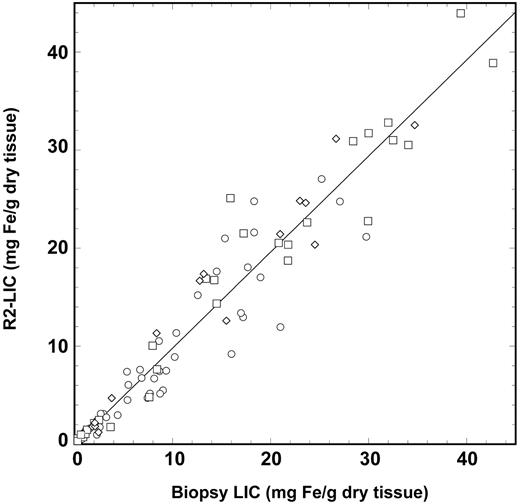
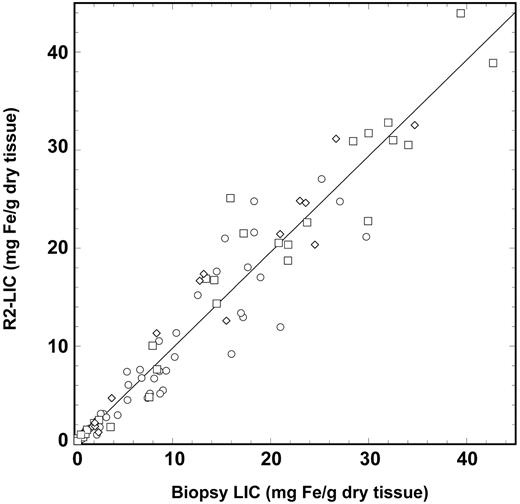
The sensitivity of liver <R2> measurement to biopsy LIC at low LIC values is illustrated in the inset of Figure 2. The sensitivities and specificities of the measured liver <R2> values for the discrimination of biopsy LIC values above various clinically significant thresholds19,20 are shown in Table 1 along with the corresponding areas under the ROC plots. The calibration curve models the relationship between <R2> and LIC, with a Pearson correlation coefficient of 0.98 (Figure 2). Analysis of the data using the methods of Bland and Altman13 showed that the mean differences between the R2-LIC values and biopsy LIC values for each of the individual subject groups were not significantly different from zero, suggesting that the single calibration curve is sufficient to model the relationship between liver <R2> and LIC for all the subject groups. By removing all cases (n = 14) with a Knodell fibrosis staging of 5 or 6,21,22 the mean difference between R2-LIC and biopsy LIC was not significantly different from zero. A graphical representation showing the relationship between R2-LIC, biopsy LIC, and the scatter of data with different fibrosis stages is given in Figure 6. Of the 105 biopsies used in this study, only 48 had the dry masses permanently recorded by the pathology laboratory. Of these, 17 had dry masses below 1 mg and 31 had dry masses more than 1 mg. By considering only biopsies with a recorded dry mass greater than 1 mg, the mean difference between R2-LIC and biopsy LIC was not significantly different from zero.
R2-LIC versus biopsy LIC. The R2-LIC values are derived from the calibration equation described in the text. The solid line is a straight line fitted through the origin and has a gradient of 0.980 ± 0.018. The different data symbols differentiate between the different fibrosis stages: stages 0 and 1, ○; stages 2 to 4, □; and stages 5 and 6, ⋄.
R2-LIC versus biopsy LIC. The R2-LIC values are derived from the calibration equation described in the text. The solid line is a straight line fitted through the origin and has a gradient of 0.980 ± 0.018. The different data symbols differentiate between the different fibrosis stages: stages 0 and 1, ○; stages 2 to 4, □; and stages 5 and 6, ⋄.
No significant correlation was found between age and biopsy LIC or liver R2 for the individuals with HH. However, among the subjects with β-thalassemia/hemoglobin E, there was a significant correlation between both age and biopsy LIC (Spearman rank order ρ = 0.37; P = .02) and between age and liver <R2> (Spearman rank order ρ = 0.43; P = .006).
Staging of fibrosis. For the iron-loaded volunteer groups (HH, β-thalassemia, and β-thalassemia/hemoglobin E), the CV of R2 was weakly but significantly correlated with the staging of fibrosis according to the Knodell stage21,22 (ρ = 0.35; P = .003; n = 73, Spearman rank test). For the HH patient group, there was a slightly stronger significant correlation between the CV of R2 and the staging of fibrosis (ρ = 0.48; P = .03). Further, for the HH group, the skewness of the R2 distribution was significantly correlated with the staging of fibrosis (ρ = 0.52; P = .02). Neither the CV of R2 nor the skewness of the R2 distribution was significantly correlated with LIC.
Reproducibility study. By measuring 10 subjects on 2 MRI scanners, we determined the random uncertainty on a single slice liver <R2> measurement to be ± 7.7%, with a nonsignificant systematic difference between the scanners of 1.2% (with the systematic difference being < 6.7% with 95% confidence).
Discussion
Accuracy and precision of R2 measurements
The accuracy and precision of R2 measurements on thirteen 1.5-T MRI scanners have been demonstrated using aqueous MnCl2 phantoms. The measured relaxivity value of 73.6 ± 0.4 s-1 mM-1 is consistent with the value of 74.0 s-1 mM-1 from the measurements of Anderson and Jensen at 1.5 T (20°C).23 For the in vivo measurement of liver <R2> values, the observed systematic difference between repeat liver R2 measurements made on 2 MRI scanners was not greater than 6.7% (with 95% confidence), consistent with the measurement of a CV of MnCl2 relaxivity between 13 different scanners of 2.1% for the phantoms. The random uncertainty on a single liver <R2> measurement in vivo was approximately 8%, whereas the CV of <R2> for slices neighboring the maximal cross-sectional slice for the 10 volunteers was 10%. Hence, it is possible that a significant part of the 8% random uncertainty is due to the naturally occurring variation in R2 from slice to slice within each liver combined with inexact slice registration between the 2 measurements.
R2 sensitivity, specificity, and dynamic range for LIC measurement
The specificity of liver R2 (as measured by a variety of SSE techniques) for the quantification of liver iron concentration has been demonstrated in several previous studies of iron-loaded patients17,18,24-26 using monoexponential signal decay analysis. We have demonstrated previously that variation of R2 within a single liver reflects the LIC variation throughout the liver.17,18 However, this is the first report to demonstrate a measurement method with (1) negligible instrument-dependent systematic errors, (2) a universal calibration curve applicable to multiple patient groups with a variety of liver pathologies, and (3) iron concentration imaging capabilities. Furthermore, the calibration curve covers a greater dynamic range with a greater sensitivity and specificity of the measurement parameter (R2 in this case) to needle biopsy-measured LIC than any other reported MRI methodology. High levels of sensitivity and specificity are demonstrated at the clinically important LIC thresholds of 1.8, 3.2, 7.0, and 15.0 mg Fe/g dry tissue (Table 1). At higher liver iron concentrations the sensitivity to needle biopsy LIC starts to drop, presumably because of both the curvature in the relationship between R2 and biopsy LIC and the increase in biopsy sampling error at higher LICs (eg, at 25 mg Fe/g dry tissue the sensitivity and specificity for biopsy LIC are 0.77 (95% confidence limits, 0.50-0.92) and 0.98 (95% confidence limits, 0.92-0.99), respectively, with an area under the ROC plot of 0.67 ± 0.09 (mean ± SE).
The sensitivity and specificity of <R2>-derived LIC measurement to biopsy LIC appears comparable with that reported for biomagnetic liver susceptometry (BLS), a technique first used clinically in the early 1980s.27 BLS is reported to have an uncertainty of 50 to 300 μg Fe/g wet tissue (or 0.17-1.00 mg Fe/g dry tissue, assuming liver is 70% water28 ) below approximately 5 mg Fe/g wet tissue (approximately 16.5 mg Fe/g dry tissue). Above 5 mg Fe/g wet tissue the differences between BLS LIC measurements and biopsy LIC measurements are greater and there is evidence for a departure from a linear relationship between BLS-measured LIC and biopsy-measured LIC, which may be a consequence of differences in the magnetic properties of ferritin and hemosiderin.29 Such phenomena may explain the curvilinear relationship between <R2> and biopsy LICs observed in the present study. However, other factors such as clustering of hemosiderin iron deposits at higher iron concentrations or a systematic change in tissue hydration with iron loading could also explain the curvilinear relationship between liver <R2> and LIC that we observe. Interestingly, a BLS study briefly reported by other workers5 shows noticeably smaller differences in BLS LIC measurements and biopsy LIC measurements at higher LIC values and the relationship between BLS LIC and biopsy LIC remains linear to high LIC values. The reasons for the better agreement between BLS LIC and biopsy LIC are not entirely clear but could include larger biopsy sample sizes, different pathologies, or more precise instrumentation.
Several reports have demonstrated that larger biopsy masses result in a more representative measure of average liver iron concentration or body iron stores.6,7,30 Very large biopsy specimens can result in lower CV values of LIC measurements. For example, Barry and Sherlock31 obtained a CV of LIC in duplicate samples from remote sites of nondiseased liver of 8.6% when using specimens with average dry mass of approximately 10 mg. Angelucci et al30 have shown that there is a better correlation between LICs measured by needle biopsy and total body iron stores when the sample mass is above 1 mg. The pathology laboratories in our study routinely require a minimum biopsy dry mass of 0.4 mg. Of the 48 biopsies that had their dry mass permanently recorded, 17 had dry masses below 1 mg and 31 had dry masses greater than 1 mg. The CV values of the differences in R2-LICs and biopsy LICs were 25% and 22% for the biopsies with dry masses less than 1 mg and more than 1 mg, respectively, consistent with the observations of Angelucci et al.30 However, a Bland Altman analysis13 of the 95% limits of agreement between the LIC estimates by R2 measurement and biopsy were 39% ± 11% and -59% ± 11% for samples less than 1 mg, 46% ± 7% and -41% ± 7% for samples more than 1 mg, and 50% ± 5% and -56% ± 5% for all 105 biopsies in the study. With 17 samples below 1 mg and 31 samples above 1 mg, there was not enough power to detect a significant difference in the limits of agreement determined for the 3 groups of samples.
Liver iron heterogeneity and R2
Previous spin-echo imaging studies of the liver have shown correlation of R2 with liver biopsy iron concentration up to 22.4 mg Fe/g dry tissue using monoexponential signal decay analysis in selected regions of interest.24-26 Localized MR spectroscopy measurements in the vicinity of the biopsy site have shown good correlation (r = 0.95) with LIC up to 37.2 mg Fe/g dry tissue.32 However, a limitation of localized spectroscopy measurements is the inability to measure or image the spatial variation in LIC. Noninvasive liver iron measurement by BLS is similarly restricted to the measurement of LIC in smaller liver volumes.
Previous postmortem R2 imaging studies of iron-loaded liver tissue have shown that the variation in R2 within a single liver reflects a spatial variation in liver iron concentration over a length scale of approximately 1 cm.17,18 The SD of liver R2 distributions, σR2, appears to be a measure of the degree of heterogeneity in iron concentration throughout the liver. In this study, σR2 was found to be correlated with biopsy LIC. This observation is consistent with previous studies7 showing an approximately linear increase in the SD of multiple-site needle biopsy LIC measurements over a liver with the mean biopsy LIC measurement. For cirrhotic livers, the CV of needle biopsy LIC has been reported to be 41%7 or greater,8 whereas in nondiseased liver average values of approximately 19% have been obtained.7,8 Another study on multiple sampling of 2 noncirrhotic postmortem β-thalassemic liver tissue specimens with larger samples (0.2-0.3 g) yielded CV values of LIC of 17% and 24%.33 Our finding that the CV of liver R2 positively correlates with fibrosis stage in the iron-loaded subjects further suggests that the CV of R2 is a measure of the degree of heterogeneity of iron concentration within the liver, consistent with our previous finding that the spatial variation of R2 within a single liver reflects the spatial variation of iron concentration within the liver.17,18 Hence further research is warranted to investigate whether spatial information generated from R2 imaging may be used to assess the degree of liver fibrosis.
LIC and age
No significant correlation was found between age and biopsy LICs or liver R2 for the subjects with HH. This observation is consistent with a previous study of 410 subjects with HH.34 The significant correlation between age and biopsy LIC (Spearman rank order ρ = 0.37; P = .02) and age and liver <R2> (Spearman rank order ρ = 0.43; P = .006) for the β-thalassemia/hemogloblin E patients is most likely due to the fact that the patients had received no chelation therapy and few (if any) blood transfusions. In this group of subjects, iron loading is due to increased dietary absorption and so the correlation of LIC with age suggests a characteristic rate of iron uptake for the β-thalassemia/hemoglobin E subjects.
Mechanisms of R2 enhancement in iron-loaded liver tissue
The mechanisms by which tissue iron deposits enhance proton transverse relaxation rates are not yet fully understood. However, 2 different mechanisms have been proposed, both of which may play a role in iron-loaded tissue. Gossuin et al35 have developed a theoretical model involving proton exchange between bulk water and exchangeable protons located at the surface of the hydrated iron(III) oxyhydroxide cores of ferritin. The model explains the magnitude of the effect of ferritin concentrations on the proton transverse relaxation rate in aqueous solutions. On the other hand, Jensen and Chandra36 have developed a model that explains the nonexponential nature of proton transverse relaxation in ironloaded tissue. Their model suggests a relaxation mechanism based on the diffusion of protons in the magnetic field inhomogeneities induced by micron-scale hemosiderin clusters within the tissue. It is likely that both mechanisms play a role in liver tissue. As such, the relative fraction of iron in dispersed ferritin and clustered hemosiderin may influence the relaxivity of the tissue iron (ie, the amount of relaxation enhancement per iron atom). Thus, a variability in this fraction may contribute to the variability in the relationship between hepatic R2 and LIC and could be a possible explanation for the curvature seen in the R2 versus LIC relationship in Figure 2. A variability in the way iron clusters will also determine the relationship between R2 and LIC as demonstrated by in vitro experiments with ferritin in liposomes.37 Spatial variations in these parameters throughout an individual liver could contribute to the variation in R2 as shown in Figure 5.
Other MRI methods of LIC measurement
Several other MRI-based methods for assessing LIC have been reported in the literature over the past 2 decades.38 They generally fall into 4 main categories: (1) signal intensity ratio methods based on T2 contrast39 , (2) signal intensity ratio methods based on T2* contrast40,41 , (3) relaxometry methods based on T2 measurement,24,26 , and (4) relaxometry methods based on T2* measurement.42 Signal intensity ratio methods generally enable shorter data acquisition times but are inherently less precise given that fewer data are acquired. The most promising of the signal intensity ratio methods is that recently reported by Gandon et al.40 For the purpose of distinguishing subjects with significant iron loading (defined by Gandon et al as 60 μmol Fe/g dry tissue, ie, approximately 3.2 mg Fe/g dry tissue) from subjects without significant iron loading, their technique demonstrates a sensitivity of 89% and specificity of 80% (with somewhat higher values for their study group: sensitivity 93%, specificity 98%). Their technique enables measurements to be made up to LICs of 375 μmol Fe/g dry tissue (20.9 mg Fe/g dry tissue).
Of the T2* relaxometry methods, the method of Anderson et al42 has attracted the most attention recently. Anderson's method was developed primarily for relaxometry measurements of the heart and, hence, is not necessarily optimized for liver iron measurement. Nevertheless, a correlation between T2* and LIC as measured by biopsy has been observed with a relatively good sensitivity and specificity for detecting LICs above 3.2 mg Fe/g dry tissue (sensitivity approximately 100%, specificity approximately 90%). However, sensitivity and specificity for discriminating LICs above other thresholds of clinical importance are less satisfactory (eg, a cut-point of 7 mg Fe/g dry tissue gives approximate sensitivity and specificity of 70% and 88%, respectively, whereas a cut-point of 1.8 mg Fe/g dry tissue gives approximate sensitivity and specificity of 88% and 33%, respectively). Subsequent developments of the technique of Anderson et al42 have enabled T2* relaxometry data to be acquired during a single breath-hold, thus enabling very short data acquisition times.43
Implementation of R2-LIC measurements in clinical practice
The relative costs of the various methodologies will vary among institutions and countries. However, the overall costs will be determined by the length of time a patient spends inside the scanner and the time to analyze the data. The R2 method described here involves a 20-minute data acquisition period (on average) compared with just a few minutes for single breath-hold methods. Nevertheless, 20 minutes is a relatively short period in the scanner compared with many other MRI examination protocols. The payoff for the extra minutes in the scanner is a higher specificity and sensitivity over a greater range of LICs than any other MRI-based method of liver iron measurement. Data analysis has been simplified by the production of custom-designed software to facilitate the execution of the analysis algorithms.
The applicability of the technique has been demonstrated on a range of 1.5-T MRI units from the 3 major manufacturers. However, currently the short TE pulse sequences are not standard on the General Electric models.
The algorithms developed to measure and image R2 in the liver10,11,44 have been incorporated into a software package with associated training manuals. There are 2 general ways in which the software could become available to the medical community. Software could be distributed to individual MRI centers for use by individual radiologists. Alternatively, the telemedicine model could be used whereby data are transmitted to central data analysis facilities as a digital specimen to be analyzed. The latter model has the advantages of quality control as well as eliminating the need for training of large numbers of radiologists.
Prepublished online as Blood First Edition Paper, July 15, 2004; DOI 10.1182/blood-2004-01-0177.
Supported in part by the National Health and Medical Research Council (Project Grant 211947), Wellcome Trust (Collaborative Research Initiative Grant 068613), and the National Research Council of Thailand. T.G.S., P.R.C., and W.C.-a. have declared a financial interest in a company whose potential product was studied in the present work. P.R.C. and W.C.-a. are employed by a company whose potential product was studied in the present work.
We would like to thank the following people for supporting the research: Dr Jay Ives (SKG Radiology, Perth), Dr Catherine Cole (Princess Margaret Hospital, Perth), Dr John Pereira (Prince of Wales Hospital, Sydney), Enrico Rossi (PathCentre, Perth), Dr George Garas, (Sir Charles Gairdner Hospital, Perth), Pornpan Sirunkapracha (Mahidol University, Bangkok), Dr Pichest Metarrugcheep and Somsak Chanyawattiwongse (Neurological Institute, Bangkok).





 ).
).