Abstract
The B-lymphocyte potential of progenitor thymocytes and whether the thymus is colonized by common lymphocyte progenitor cells have been subjects of considerable debate. Herein, we have used limiting dilution analysis to determine the lineage potential of phenotypically defined subpopulations of CD4–CD8– double-negative thymocytes. Culture systems used showed single-hit kinetics and had a high plating efficiency for B-, myeloid, and natural killer cell development. The T-cell potential of sorted cells was confirmed by transferring cells to fetal thymus organ cultures. Our results indicate that the earliest population of CD117+ double-negative cells, although containing potent T-cell developmental potential and significant myeloid and natural killer potential, does not have any residual B-cell potential. Gene transcription analysis also indicated that these double-negative cells contained abundant T and myeloid, but not B cell–specific transcripts. The implications of these results within the context of current models of thymocyte development are discussed.
Introduction
All cell lineages of the hemopoietic system, including lymphocytes, are derived from hemopoietic stem cells (HSCs).1 HSCs are rare, self-renewing cells found in the bone marrow (BM) of adult mice and their differentiation along a particular lineage is associated with progressive loss of self-renewal capacity and progressive increase in lineage commitment. It is still a matter of debate whether the progressive commitment of cells to a particular lineage is an instructive or stochastic process.2,3
The thymus is a primary lymphoid organ responsible for T-lymphocyte development.4 The thymus is continually seeded via the bloodstream by BM-derived cells throughout life and does not contain self-renewing stem cells.5 The sparse number (about 100) of BM progenitors seeding the thymus daily6 makes their identification difficult; indeed, there is currently no consensus as to either their phenotype or developmental potential. It has been estimated that each progenitor is capable of dividing 20 times,7,8 giving rise to about one million progeny expressing CD4 and CD8. Thus, there appears to be an inverse relationship between a cell's proliferation potential and its developmental status. The experimental strategy that has been adopted is to identify within the thymus rare populations of cells with an increasingly immature phenotype but potent T-cell progenitor activity.9 Likewise, attempts have been made to identify within the BM cells with potent T-lineage potential.10 The crucial issue is whether there is a direct lineage interrelationship between the cells identified in the BM and those in the thymus.
Within the thymus, a subpopulation of 3% to 5% of cells expressing neither CD4 nor CD8 and therefore called double-negative (DN) cells11 contains T-cell progenitor activity.12 DN cells are themselves heterogeneous but combined phenotypic and molecular analysis indicates that they can be placed in a differentiation scheme.13,14 The phenotypic progression from CD44+CD25– (known as DN1) through CD44+CD25+ (DN2) to CD44–CD25+ (DN3) and, finally CD25–CD44– (DN4) cells was a scheme rapidly adopted and remains in widespread use today. DN1 and DN2 cells were also described as CD4low cells.15 CD44+CD25– DN1 cells comprise about 10% of total DN cells, that is, 0.3% to 0.5% of total thymocytes or 0.5 to 0.75 × 10⁶ cells, but as a population are still heterogeneous, containing mature as well as precursors of other non–T-lineage cells such as natural killer (NK),16 dendritic cells,17 macrophages,18 and B cells.15 Strategies whereby DN cells are stained with cocktails of “lineage-specific” markers and contaminating non-T cells “gated out” have been used, but a consensus strategy has not been developed.14 Some time ago, Godfrey et al included the expression of CD117 (c-kit, the receptor for stem cell factor) to positively identify DN1 cells with T-progenitor activity.19 CD117+ DN1 cells proliferated in vitro to a cocktail of cytokines,20 including interleukin 7 (IL-7), potently reconstituted the T-cell lineage, and contained cells with T-cell receptor β (TCRβ) genes in germline configuration, properties characteristic of early progenitors.13
The lineage commitment status of DN1 (CD4lowCD44+CD25–) cells, in particular their ability to form B cells, was first reported by Wu et al.15 However, as they pointed out, their result could have reflected the heterogeneity of the progenitor population rather than the bipotent (T and B) developmental potential of individual DN1 cells. Complementary approaches were being undertaken to identify BM cells with T-cell progenitor activity. Thus Kondo et al21 showed that colonies derived from single, IL-7R+ (CD127+) Thy-1–B220–Sca-1lowCD117low cells contained both T and B, but not myeloid, progenitor activity and such cells were called “common lymphoid progenitors” (CLPs). Additional reports suggested that the thymus was colonized by CLPs. Thus, blocking αβ-expressing thymocyte development either in TCRβ knockout (KO),22 human CD3ϵ transgenic mice23 or by inducibly deleting the Notch-1 gene24 resulted in an increased number of thymic B cells. In contrast, overexpression of a downstream Notch-signaling molecule, Notch-ic, resulted in T lymphopoiesis in the BM.25 These studies suggested that cells migrating from the BM to the thymus were capable of becoming either T or B cells. Although the presence of CLPs within the thymus has still not been directly demonstrated phenotypically, these experiments confirmed that the thymus was fully capable of supporting B-cell development should such a cell find itself there.26,27 In addition, the phenotype of committed B-cell progenitors in the thymus is crucially dependent on mouse age.28
Two other cell types with properties similar to CLPs were described. Using a human CD25 (hCD25) “reporter” gene driven by the mouse preTα promoter, a BM subpopulation was identified that was B220+CD117–CD19– and to distinguish them from B220– CLPs, were called CLP-2.29 Clones of CLP-2 cells contained some CD19+ cells and half the clones could develop into T cells following intrathymic transfer. Intravenous transfer of 5 to 15 × 106 CLP-2 cells showed that they could home to the thymus and subsequent in vitro organ cultures of CLP-2–seeded thymi contained T cells. In the CD44+CD25– compartment of hCD25 transgenic thymus, some hCD25+CD4lowB220+CD117– (CLP-2) cells were found to have T-cell progenitor activity, but their B and myeloid potential was not assessed. Another study found so-called early T-lineage progenitors (ETPs) among DN1 cells.30 ETPs were CD117high and CD127neg/lo but, unlike CLPs, were not responsive to IL-7 in vitro, generated with slower kinetics a few B-lineage cells, had some myeloid potential, and showed sustained production of T-lineage cells. Interestingly, in adult Ikaros–/– mice,31 where BM CLPs are undetectable, frequencies of thymic ETPs were normal. Thus, ETPs more closely resembled HSCs, suggesting that the T-versus B-lineage pathway diverged even earlier than previously thought.30
Finally, Katsura and colleagues, using a modified fetal thymic organ culture (FTOC) assay, investigated the lineage potential of various fetal liver and thymus subpopulations.3,32 Single CD117+Sca-1+ mouse fetal liver33 or fetal thymus32 cells could be classified as bipotential myeloid T and myeloid B cells, but cells with only T- and B-cell potential were never found, bringing into question the existence of bipotent T-B cells outside the BM.3
Here, we have used limiting dilution analysis to determine the lineage potential of phenotypically defined subpopulations of DN cells. Culture systems used showed single-hit kinetics and had a high plating efficiency for B, myeloid, and NK cell development. The T-cell potential of sorted cells was confirmed by reconstituting FTOCs and monitoring the kinetics of appearance of downstream progeny. Our results indicate that the earliest population of DN cells, namely, CD117+ DN1 cells, although containing T-cell developmental potential and relatively potent myeloid and NK potential, does not have any residual B-cell potential. Gene transcription analysis also indicated that CD117+ DN1 cells contained abundant T and myeloid, but not B cell-specific transcripts. The implications of these results within the context of current models of thymocyte development are discussed.
Materials and methods
Mice
Female C57BL/6 mice and pregnant C57BL/6.Ly5.1 congenic mice aged 6 to 12 weeks were housed at the Animal Care Facility of the Biocenter, Basel University. Timed pregnancies were set up and the day of finding a vaginal plug considered day 0 of development. All animal experiments were carried out according to institutional animal ethics committee guidelines.
Cell culture
Iscove modified Dulbecco medium (IMDM; Life Technologies, Basel, Switzerland) supplemented with 50 μM β-mercaptoethanol, 1 mM glutamine, 2% heat-inactivated fetal bovine serum (FBS), and 0.03% (wt/vol) Primatone (Quest, Naarden, The Netherlands) was used for all cell cultures. IMDM was supplemented with 2% FBS for ST-234 stromal cell cultures, 10% for FTOCs, and 20% for OP935 stromal cell cultures. For thymocyte differentiation assays, IMDM was supplemented with the indicated cytokines. Cells were cultured in a humidified incubator at 37°C and containing 10% CO2.
Monoclonal antibodies and flow cytometry
Mouse thymocytes and femoral BM were resuspended at 1 to 5 × 10⁶/mL in IMDM. Then 50 μL of this cell suspension was incubated at 4°C for 30 minutes with labeled monoclonal antibodies (mAbs) specific for the indicated antigens, all purchased from BD Biosciences (Basel, Switzerland). Streptavidin-phycoerythrin (PE; Southern Biotechnology Associates, Birmingham, AL), streptavidin-cychrome (BD Biosciences), and streptavidin-allophycocyanin (APC; Molecular Probes, Leiden, The Netherlands) were used as secondary reagents to reveal bound biotin-conjugated mAbs. Relative fluorescence intensities were measured using a FACScalibur and analyzed with CellQuest software (BD Biosciences).
Cell sorting and culture
From total DN thymocytes, prepared as previously described,14 DN1 cells were sorted as CD117highCD25–CD44+, DN2 as CD117highCD25+CD44+, and DN3 as CD25+CD44– cells using a FACSAria sorter (BD Biosciences). For limiting dilution assays, the indicated numbers of sorted cells were added to wells of a 96-well plate containing 3000 rad γ-irradiated cloned BM stromal cells. The frequencies of cells generating B, macrophage, or NK cells were determined using either ST-2 or OP9 stromal cells supplemented with 100 U/mL IL-7 with or without IL-2 in the form of 10% supernatant of myeloma cells transfected with the IL-2 gene36 for NK cell growth. To determine the inhibition of macrophage and NK cell growth by anti-IL-7 receptor α (anti-IL-7Rα) antibody, sorted DN1 and DN2 cells were cultured in 96-well flat-bottomed plates at 20 cells/well on stromal cells in IMDM with or without 1 μg/mL anti-IL-7Rα antibody.37 After 2 to 3 weeks, the percentage of cultures having macrophage or NK colonies was determined using an inverted microscope (Leica Microsystems AG, Glattbrugg, Switzerland).
FTOCs
Thymic lobes dissected from 14-day-old C57BL/6-Ly5.1 mouse embryos were treated with deoxyguanosine (Sigma, St Louis, MO) as described.38 Washed lobes were then reconstituted with 2-5 × 10⁴ sorted Ly5.2+ cells in hanging drops and after 24 hours transferred to standard FTOC conditions and cultured for up to 3 weeks. For staining, reconstituted lobes were incubated in 1 mg/mL collagenase type 4 (Worthington Biochemical, Lakewood, NJ) in phosphate-buffered saline (PBS) at 37°C for 10 minutes, passed through a 26-gauge needle, washed in IMDM, and subsequently stained with the indicated fluorochrome-labeled antibodies.
PCR analysis of TCRβ gene rearrangement
Polymerase chain reaction (PCR) analysis was performed as described.39 gDNA from macrophage colonies grown in 96-well plates and washed once with PBS was isolated by adding 30 μL1 × PCR buffer (Sigma) containing 2 mg/mL proteinase K (Roche Molecular Biochemicals, Rotkreuz, Switzerland). Plates were then incubated at 60°C for 40 minutes followed by a 10-minute incubation at 94°C to inactivate proteinase K. Extracted DNA was used directly for nested PCR. Oligonucleotide primers used for the analysis were the same as described.39 The first PCR was performed using 3 μL of the lysate in 10-cycle touchdown PCR (10 seconds at 94°, 30 seconds at 68-63°C, 2 minutes at 72°C) followed by 15-cycle PCR (10 seconds at 94°, 30 seconds at 63°C, 2 minutes at 72°C) with external primers to either Dβ1.1 and Jβ1.7, or Dβ2.1, and Jβ2.7. A 1-μL and aliquot from the first amplification was subjected to a second PCR with the corresponding nested Dβ and Jβ primers and amplified for 35 cycles. The amplicons were separated on a 1.5% agarose gel and visualized by ethidium bromide staining.
Quantitative RT-PCR
Sorted thymocyte populations were lysed in Tri Reagent (Molecular Research Center, Luzern, Switzerland) and total RNA isolated and treated with DNaseQ (Promega, Wallisellen, Switzerland) following the manufacturer's instructions. cDNA was prepared using SuperScript II (Invitrogen, Carlsbad, CA) and random hexamer primers. For negative amplification control, RNA was subjected to reverse transcriptase (RT) conditions without addition of the enzyme. Oligonucleotide primers used for Pax-5, pTα, and macrophage colony stimulating factor receptor (M-CSFR) were previously described.40 CD3ϵ primers were: 5′-CGTCCGCCATCTTGGTAGA-3′ and 5′-AAAGTGTTCCACCGCATCCT-3′.
The final concentration of amplification primers was 0.1 μM. Quantitative PCR was conducted using 2 × SYBR Green PCR Master Mix (Applied Biosystems, Foster City, CA) and ABI Prism 7700 Sequence Detector (Applied Biosystems). Amplification conditions were 50°C 2 minutes, 95°C 10 minutes, cycled 42 times at 95°C, 20 seconds and 60°C 2 minutes. Relative mRNA expression values were normalized to the housekeeping gene HPRT.
Macrophage phagocytosis assay
Macrophage colonies were resuspended by strong pipetting and incubated with fluorescein isothiocyanate (FITC)–labeled 1- to 2-μm diameter polystyrene microparticle latex beads (Polysciences Europe, Eppelheim, Germany) coupled to green fluorescence protein in IMDM at 37°C for 2 hours, washed in PBS, and examined using a fluorescence microscope (Zeiss, Zurich, Switzerland).
NK cell cytotoxicity assay
To determine NK cell activity, 2 × 10⁵/mL YAC-1 cells in IMDM/10% FBS were labeled overnight with 2 μCi/mL (0.074 MBq) 3H-thymidine and washed 3 times, and 104 labeled target cells were incubated for 6 hours at 37°C with the indicated effector cells. Thereafter, cells were harvested with a Betaplate 96-well harvester (model 1295-004; Wallac Oy, Turku, Finland) and counted. Percent specific lysis was calculated from counts per minute as (100 × (total counts – experimental counts)/total counts). Total counts were determined in the absence of effector cells.
Results
DN1 thymocytes contain subpopulations of different precursor cells
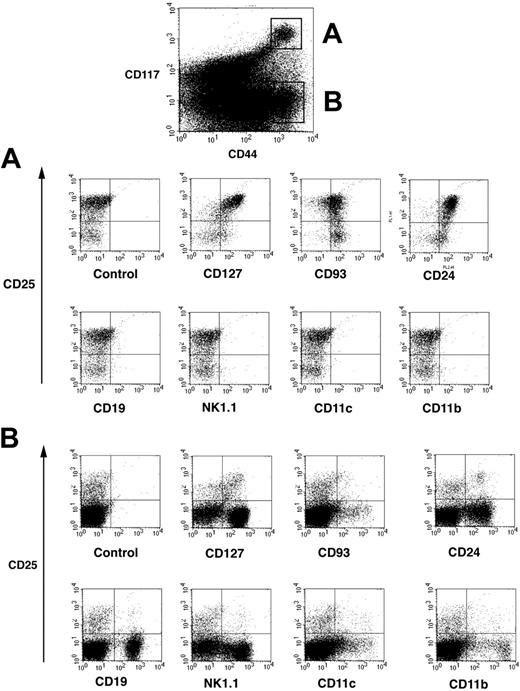
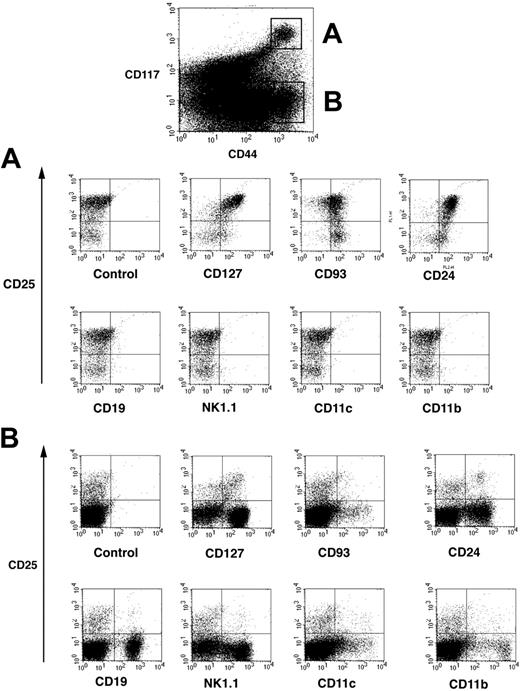
Thymocyte maturation steps are defined according expression of the surface markers CD4 and CD8.13,14 Thymocytes negative for both CD4 and CD8 are called double negative (DN) and contain the most immature cells in the thymus. As a population, DN thymocytes are heterogeneous and can be further subdivided into DN1 (CD25–CD44+), DN2 (CD25+CD44–), DN3 (CD25+CD44+), and DN4 (CD25–CD44–) cells, corresponding to their developmental progression from early immature to more mature thymocytes. As discussed,14 addition of the CD117 marker refines the analysis of DN subsets but has not been generally adopted. DN1 and DN2 thymocytes express high levels of CD117,19,39 whereas expression decreases on DN3 cells. DN thymocytes were 4-color stained for CD44PE, CD117APC, CD25FITC, and a panel of markers. Cytogram displays depicted in Figure 1 showed that CD117high cells (population A) and CD117– cells (population B) could be clearly identified among CD44+ cells (top panel). Population A could be clearly separated into a major subpopulation (70%-80%) of CD25+ DN2 and 20%-30% DN1 cells.
Four-color analysis of DN thymocytes by flow cytometry. Isolated DN thymocytes were 4-color stained for CD117-APC, and CD44-cychrome, CD25-FITC, and additional markers revealed by streptavidin-PE. CD44+ cells were separated into CD117 highly positive cells and CD117– cells and these populations defined as populations A and B. (A) Representative flow cytometric profile of cells from population A that were further analyzed according their expression of CD25 and lineage-specific as well as hematopoietic development common surface markers. (B) Representative flow cytometric profile of cells from population B.
Four-color analysis of DN thymocytes by flow cytometry. Isolated DN thymocytes were 4-color stained for CD117-APC, and CD44-cychrome, CD25-FITC, and additional markers revealed by streptavidin-PE. CD44+ cells were separated into CD117 highly positive cells and CD117– cells and these populations defined as populations A and B. (A) Representative flow cytometric profile of cells from population A that were further analyzed according their expression of CD25 and lineage-specific as well as hematopoietic development common surface markers. (B) Representative flow cytometric profile of cells from population B.
Surprisingly, lineage marker expression was strikingly different between population A and population B. Importantly, population A, containing both DN1 and DN2 cells, did not express CD19, NK1.1, CD11c, or CD11b, markers used to identify B, NK, dendritic, and macrophages, respectively (Figure 1A). However, CD44+CD117– population B (Figure 1B) expressed a broad array of these lineage-specific markers. Whereas DN1 and DN2 cells do not express any lineage-specific markers, they are CD127+ (IL-7Rα), CD93+, and CD24+ (Figure 1A upper cytograms). Expression of CD127 and CD24 is higher and CD93 is slightly lower on DN2 versus DN1 cells. Thus, CD117high DN1 and DN2 cells were relatively homogenous and were negative for lineage-specific markers, whereas CD44+CD117– DN cells were quite heterogeneous, containing a mixture of different lymphoid and nonlymphoid cells.
DN1 and DN2 thymocytes progress sequentially through the T-cell developmental stages in FTOCs
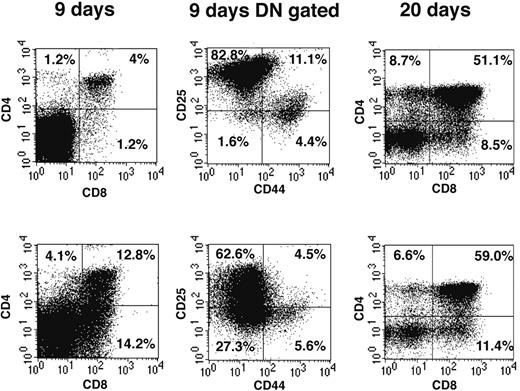
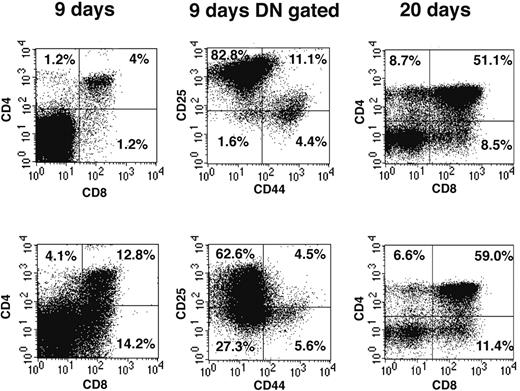
We have used reconstitution of FTOCs to test the T-lineage potential of DN1 and DN2 thymocytes. Thus adult DN1 and DN2 thymocytes were sorted and directly seeded into FTOCs and analyzed after 9 and 20 days. At day 9, FTOCs seeded with DN2 cells contained 13% CD4+CD8+ double-positive (DP) cells (Figure 2 left panels), whereas cultures seeded with the same number of DN1 thymocytes contained only 4% DP cells. The increased proportion of DP cells in cultures seeded with DN2 cells suggests they are more advanced in their development than DN1 cells. This difference in development was confirmed by analysis of CD44 and CD25 expression on gated DN cells (Figure 2 middle panels). Thus, whereas DN1-seeded FTOCs contained 82.8% CD25+CD44– DN3 cells and only 1.6% CD25–CD44– DN4 cells (Figure 2 upper panel), DN2-seeded FTOCs contained only 62.6% DN3 but 27.3% DN4 cells (Figure 2 lower panel). At 20 days, DN1-seeded FTOCs still contained 32% DN cells, whereas those from DN2-seeded cultures only contained 23% DN cells. Taken together our FTOC experiments confirmed that both CD117high DN1 and DN2 thymocytes contained T-progenitor activity, giving rise to more mature CD4+CD8+ DP and CD4+ or CD8+ single-positive (SP) cells in FTOCs and, moreover, that DN2 cells were developmentally more advanced than DN1 cells. Despite the fact that reconstitution of FTOCs with BM-derived CD117+B220+ cells generated a few CD19+ B cells, none were seen in FTOCs reconstituted with DN1, DN2, or DN3 cells (unpublished data, February 2003).
DN thymocytes sequentially progress through DN1, 2, 3, and 4 developmental stages in FTOCs. Sorted DN1 (top row) and DN2 (bottom row) thymocyte populations were seeded into FTOCs and analyzed at either 9 or 20 days. Cells were stained for expression of CD4 and CD8 surface markers. CD4 and CD8 DN cells at day 9 of culture were further analyzed for CD44 and CD25 expression. Percentages represent cell number in each quadrant.
DN thymocytes sequentially progress through DN1, 2, 3, and 4 developmental stages in FTOCs. Sorted DN1 (top row) and DN2 (bottom row) thymocyte populations were seeded into FTOCs and analyzed at either 9 or 20 days. Cells were stained for expression of CD4 and CD8 surface markers. CD4 and CD8 DN cells at day 9 of culture were further analyzed for CD44 and CD25 expression. Percentages represent cell number in each quadrant.
DN1 and DN2 thymocytes retain macrophage but not B-cell potential
The in vitro culture of immature lymphoid cells is dependent on a supporting stromal feeder cell layer. To test B-lymphoid potential, the ST-2 BM stromal cell line, previously shown to efficiently support the growth and development of B cells,34 was used. Surprisingly, on ST-2 stromal cells and in the presence of IL-7, DN1 and DN2 thymocytes developed to macrophages (Figure 3A), expressing both CD11b and F4.80 molecules, markers normally used to define macrophage populations (Figure 3B-C); that these were functional macrophages was demonstrated by the fact that they could very efficiently phagocytose fluorescent latex beads (Figure 3D). In contrast, DN3 thymocytes displayed very limited growth on ST-2 stromal cells and had lost the ability to develop into macrophages (data not shown). Taken together, these results suggested that DN1 and DN2 but not DN3 thymocytes still retained myeloid potential.
DN1 and DN2 thymocytes develop to functional macrophages. Sorted DN1 and DN2 thymocytes were plated at 20 cells/well of 96-well plates on ST-2 stromal cells in the presence of IL-7. (A) Light microscopy photograph of macrophage-like–looking cells derived from DN2 thymocytes after 3 weeks in culture. Image was obtained using Diavert (Leica Microsystems AG, Glattbrugg, Switzerland), inverted microscope 40 ×, 10/0.25, air, no stain, camera Nikon DXM 1200F, Japan. (B-C) Flow cytometric analysis of cultures shown in panel A with no antibody staining and stained with anti-CD11c together with anti-F4.80 fluorochrome-labeled mAb. (D) Fluorescence microscopy photograph of macrophage colonies derived from DN2 thymocytes that have ingested fluorescent latex beads. Image was obtained using Axioskop (Zeiss, Zurich, Switzerland) fluorescence microscope, 250 ×,25 × 12 × 0.63 water, no stain, camera Nikon DXM 1200F, Japan.
DN1 and DN2 thymocytes develop to functional macrophages. Sorted DN1 and DN2 thymocytes were plated at 20 cells/well of 96-well plates on ST-2 stromal cells in the presence of IL-7. (A) Light microscopy photograph of macrophage-like–looking cells derived from DN2 thymocytes after 3 weeks in culture. Image was obtained using Diavert (Leica Microsystems AG, Glattbrugg, Switzerland), inverted microscope 40 ×, 10/0.25, air, no stain, camera Nikon DXM 1200F, Japan. (B-C) Flow cytometric analysis of cultures shown in panel A with no antibody staining and stained with anti-CD11c together with anti-F4.80 fluorochrome-labeled mAb. (D) Fluorescence microscopy photograph of macrophage colonies derived from DN2 thymocytes that have ingested fluorescent latex beads. Image was obtained using Axioskop (Zeiss, Zurich, Switzerland) fluorescence microscope, 250 ×,25 × 12 × 0.63 water, no stain, camera Nikon DXM 1200F, Japan.
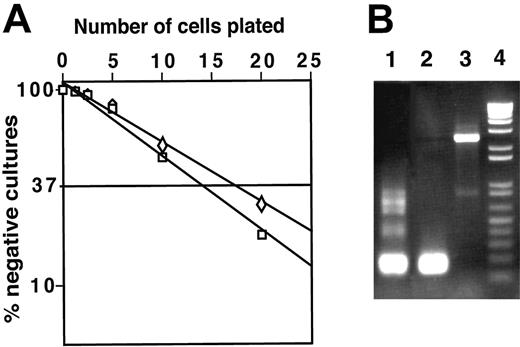
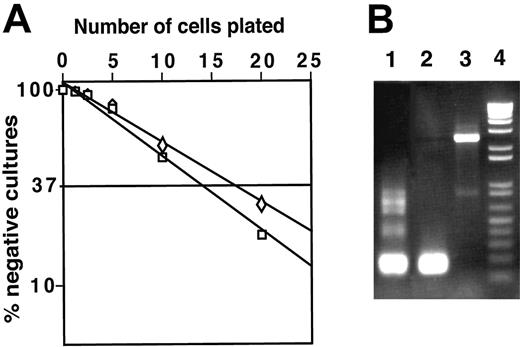
To determine the frequency of cells capable of generating macrophages from DN1 and DN2 thymocytes, we performed limiting dilution assays. Both CD117high DN1 and DN2 thymocytes were plated on irradiated ST-2 stromal cells in the presence of IL-7 and the frequency of macrophage colonies was 1 in 14 for DN1 and 1 in 17 for DN2 cells. Sorted DN3 cells did not generate macrophage colonies (data not shown).
It has been reported that granulocyte/macrophage (G/M) colonies derived from DN cells of mice bearing a human IL-2Rβ chain transgene contained DJβ1 but not DJβ2 rearrangements, whereas no TCRβ gene rearrangements were observed in G/M cells sorted from the BM of nontransgenic mice.39 Therefore, we tested whether macrophages derived from normal DN1 and DN2 thymocytes also had TCRβ gene rearrangements. We found that 8 of 260 (∼3%) macrophage clones derived from DN2-cultured thymocytes had Dβ1-Jβ1 rearrangements but none had Dβ2-Jβ2 gene rearrangements (Figure 4B) indicating that early thymocytes have begun to rearrange their TCRβ genes yet still retain the potential to develop into functional macrophages. In corollary, the presence of genomic Dβ-Jβ rearrangements does not constitute a sign of T-cell commitment.
DN1 and DN2 thymocytes develop to macrophages with high frequency, which can contain rearranged TCRβ genes. (A) Limiting dilution assay of DN1 (□) and DN2 (⋄) thymocytes. Replicate cultures containing 2.5, 5, 10, and 20 sorted cells were plated in 96-well plates on ST-2 stromal cells in the presence of IL-7. After 3 weeks, the number of wells containing macrophage colonies was counted under an inverted light microscope. (B) gDNA isolated from DN2 thymocyte-derived macrophage colonies was assayed by PCR for TCRβ chain rearrangement. Lane 1, TCR Dβ1-Jβ1 rearrangement of gDNA isolated from total thymocytes; lane 2, TCR Dβ1-Jβ1 rearrangement observed in a single macrophage colony; lane 3, macrophage colony with TCRβ locus in germline configuration; and lane 4, molecular weight marker.
DN1 and DN2 thymocytes develop to macrophages with high frequency, which can contain rearranged TCRβ genes. (A) Limiting dilution assay of DN1 (□) and DN2 (⋄) thymocytes. Replicate cultures containing 2.5, 5, 10, and 20 sorted cells were plated in 96-well plates on ST-2 stromal cells in the presence of IL-7. After 3 weeks, the number of wells containing macrophage colonies was counted under an inverted light microscope. (B) gDNA isolated from DN2 thymocyte-derived macrophage colonies was assayed by PCR for TCRβ chain rearrangement. Lane 1, TCR Dβ1-Jβ1 rearrangement of gDNA isolated from total thymocytes; lane 2, TCR Dβ1-Jβ1 rearrangement observed in a single macrophage colony; lane 3, macrophage colony with TCRβ locus in germline configuration; and lane 4, molecular weight marker.
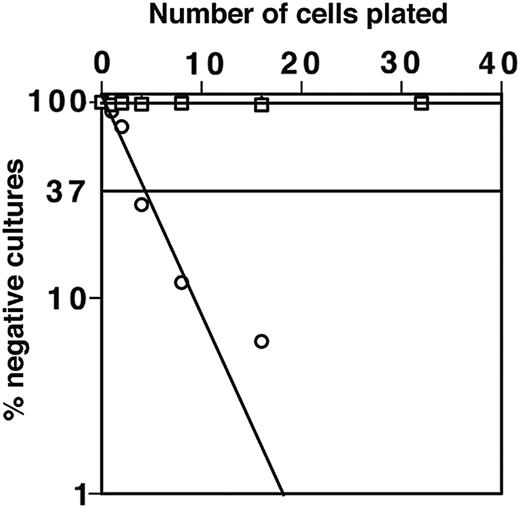
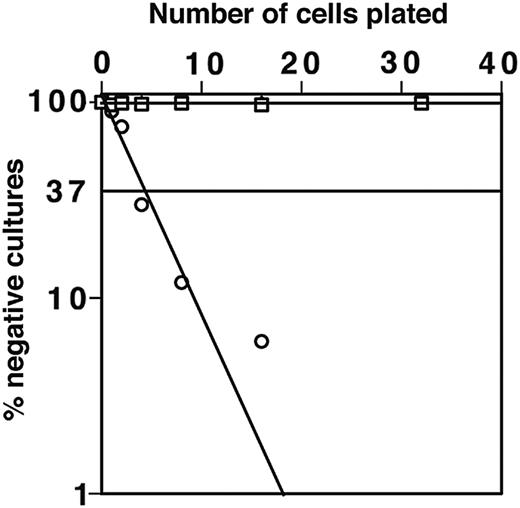
ST-2 stromal cells express low levels of macrophage colony-stimulating factor (M-CSF) and with IL-7 support both B and myeloid cell development.34,41 As expected, macrophage colony growth from DN1 and DN2 thymocytes was not observed on the M-CSF–nonsecreting OP9 stromal cell line.35 OP9 stromal cells can also support B-cell development; indeed, 1 in 5 sorted B220+CD117+ BM cells could generate B-cell colonies on OP9 (Figure 5). By using OP9 stromal cells we have tested the potential of CD117high DN1 and DN2 cells to generate B cells in the absence of possible interference from developing myeloid cells. Importantly, despite this high plating efficiency for cells with known B-progenitor activity, in many repeated experiments, DN1, DN2, and DN3 thymocytes showed no B-lymphocyte progenitor activity when cultured on OP9. This was true whether cells were cultured in bulk or at limiting dilution. To test whether the adult thymus contained cells with B-cell developmental potential, total DN cells were plated on OP-9 in the presence of IL-7. No B-lineage cells were detectable in these cultures irrespective of their duration. These findings confirm previous results28 indicating that the adult thymus is devoid of cells with B-cell progenitor activity.
DN1 and DN2 thymocytes do not develop to B cells on OP9 stoma in the presence of IL-7. Limiting dilution assay for sorted DN1 (▪) and DN2 (□) thymocytes and CD117+B220+ BM cells (○) was performed. Closed and open square symbols overlap demonstrating that both DN1 and DN2 thymocytes do not develop to B cells.
DN1 and DN2 thymocytes do not develop to B cells on OP9 stoma in the presence of IL-7. Limiting dilution assay for sorted DN1 (▪) and DN2 (□) thymocytes and CD117+B220+ BM cells (○) was performed. Closed and open square symbols overlap demonstrating that both DN1 and DN2 thymocytes do not develop to B cells.
DN thymocytes express T cell- and macrophage- but not B cell–specific genes
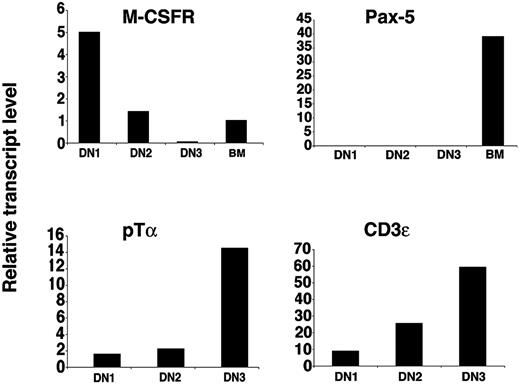
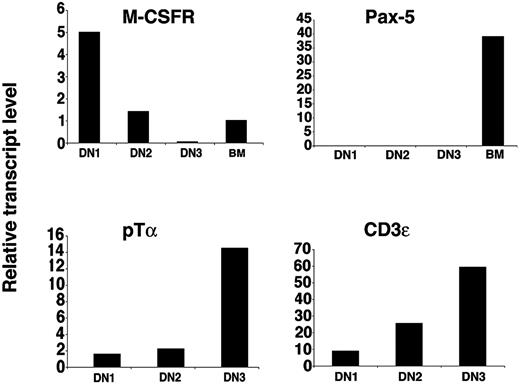
By cell culture experiments we have demonstrated that CD117high DN1 and DN2 thymocytes retain T and macrophage potential but have lost B-cell potential. Next we determined the levels of mRNA transcripts encoding genes characteristic of these lineages by quantitative real-time RT-PCR. Pre-T-cell receptor α chain (pTα) transcripts were detected at low levels in DN1 thymocytes and their expression increased during subsequent development42 (Figure 6). pTα mRNA levels were below the detection limit in B220+ BM cell-derived samples (data not shown). Expression of another T cell-specific gene, CD3ϵ, increased with thymocyte developmental progression43 (Figure 6). When normalized to HPRT, the relative amount of the macrophage-specific gene M-CSF receptor mRNA was almost 4 times higher in DN1 than in DN2 thymocytes and barely detectable in DN3 cells, correlating with their higher macrophage potential in vitro (Figure 4). Importantly, transcripts for the B cell-specific gene Pax-5 were not detectable in DN1, DN2, or DN3 thymocytes although a strong amplification signal was obtained in the control samples obtained from BM B220+ cells.
Real-time PCR analysis of gene transcripts in thymocyte subpopulations. Relative expression levels of indicated transcripts from the specified cell populations. For M-CSFR and Pax-5, cDNA from sorted CD117+B220+ BM cells was used as amplification control.
Real-time PCR analysis of gene transcripts in thymocyte subpopulations. Relative expression levels of indicated transcripts from the specified cell populations. For M-CSFR and Pax-5, cDNA from sorted CD117+B220+ BM cells was used as amplification control.
DN1 and DN2 thymocytes have a potential to develop to functional NK cells
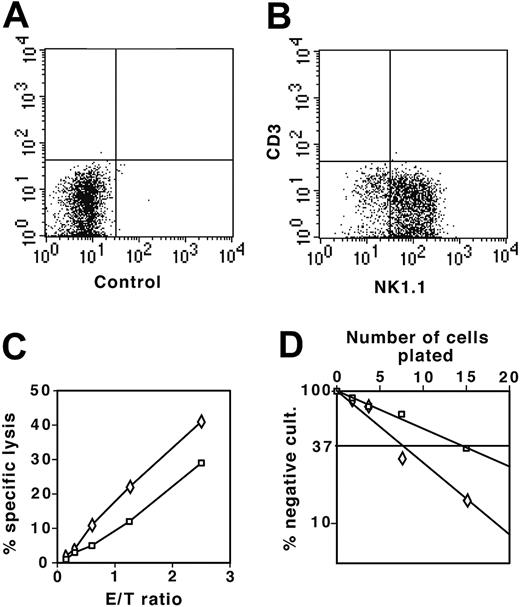
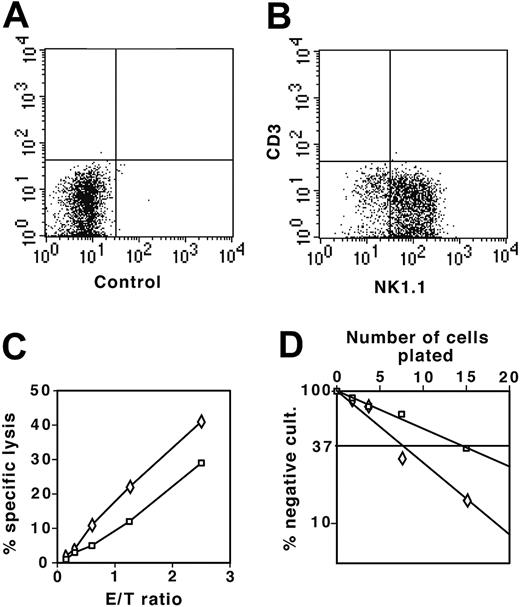
To test the NK potential of DN thymocytes, we cultured DN1 and DN2 thymocytes from the NK1.1+ mouse strain C57BL/6 on OP9 stromal cells in the presence of both IL-7 and IL-2. After 2 weeks, cells were stained for NK1.1 and CD3ϵ to distinguish between CD3ϵ– NK44 and CD3ϵlow NK-T cells.45 In the presence of IL-2, most DN1 and DN2 thymocytes had developed to CD3–NK1.1+ NK cells (Figure 7A-B). As shown in Figure 7C, both DN1- and DN2-derived cells efficiently lysed YAC-1 cells, indicating that they were functional NK cells. Limiting dilution assays demonstrated that 1 in 15 DN1 and 1 in 7 DN2 thymocytes developed into NK cells (Figure 7D). Thus, despite the absence of NK1.1 expression (Figure 1A), a marker that appears relatively late on NK lineage cells,44 sorted DN1 and DN2 thymocytes still retained potent NK cell potential.
DN1 and DN2 thymocytes develop to functional NK cells. (A) Flow cytometric analysis of control sample of NK cell colonies derived from DN1 and DN2 thymocytes cultured on OP9 stromal cells in the presence of IL-7 and IL-2 not stained with antibody. (B) DN1 and DN2 thymocyte-derived NK colonies stained with combination of anti-NK1.1 and anti-CD3ϵ fluorochrome-labeled antibodies. (C) YAC-1 cells (104) labeled with 3H-thymidine were cultured together with increasing numbers of NK1.1+ cells derived from DN1 (□) and DN2 (⋄) thymocytes. NK-mediated specific lysis was determined as the percentage of lysed cells, with background counts representing 100% lysis. (D) Limiting dilution assay of DN1 (□) and DN2 (⋄) thymocytes plated at 2.5, 5, 10, and 20 cells in 96-well plates on OP9 stromal cells in the presence of IL-7 and IL-2. Number of NK cell negative wells was determined after 2 weeks of culture under an inverted light microscope. E/T indicates effector-target cell ratio.
DN1 and DN2 thymocytes develop to functional NK cells. (A) Flow cytometric analysis of control sample of NK cell colonies derived from DN1 and DN2 thymocytes cultured on OP9 stromal cells in the presence of IL-7 and IL-2 not stained with antibody. (B) DN1 and DN2 thymocyte-derived NK colonies stained with combination of anti-NK1.1 and anti-CD3ϵ fluorochrome-labeled antibodies. (C) YAC-1 cells (104) labeled with 3H-thymidine were cultured together with increasing numbers of NK1.1+ cells derived from DN1 (□) and DN2 (⋄) thymocytes. NK-mediated specific lysis was determined as the percentage of lysed cells, with background counts representing 100% lysis. (D) Limiting dilution assay of DN1 (□) and DN2 (⋄) thymocytes plated at 2.5, 5, 10, and 20 cells in 96-well plates on OP9 stromal cells in the presence of IL-7 and IL-2. Number of NK cell negative wells was determined after 2 weeks of culture under an inverted light microscope. E/T indicates effector-target cell ratio.
The IL-7 requirement for the differentiation of DN1 and DN2 thymocytes to macrophages and NK cells
To determine whether macrophage and NK cell development was dependent on IL-7, 96 replicate cultures of freshly sorted DN1 and DN2 thymocytes were plated at 20 cells/well (a number chosen from limiting dilution experiments such that most positive cultures would be clonal) on irradiated stromal cells with IL-7 as positive control, without IL-7, or without IL-7 and in the presence of 1 μg/mL anti-IL-7Rα mAb. All cultures measuring NK growth also contained IL-2. Table 1 shows the results of a typical experiment where for each cell type the number of colonies obtained with IL-7 is normalized to 100%. For DN1 cells, the number of macrophage colonies was slightly (10%) reduced in the absence of IL-7, but reduced further to 64% in the presence of 1 μg/mL anti-IL-7Rα mAb, used to block residual IL-7 produced by stromal cells. Development of NK cells from DN1 cells was less dependent on IL-7, only decreasing to 87% of control in the absence of IL-7 and presence of anti-IL-7Rα mAb (Table 1 right column). For DN2 cells, this order of IL-7 dependence was the same with growth of macrophages being more IL-7 dependent than for NK cells. Thus, development of macrophage growth was more IL-7 dependent than for NK cells and development of both cell types from DN2 cells was more IL-7 dependent than from DN1 and correlates with differences in IL-7R expression as determined by fluorescence-activated cell sorting (FACS; Figure 1).
Discussion
In this report, we have addressed the issue of the developmental potential of phenotypically defined subpopulations of DN thymocytes. Using limiting dilution analysis whereby the frequency of B, macrophage, and NK cells among a particular subpopulation can be determined, our results clearly show that the earliest subpopulation of DN cells, defined as CD117highCD44+CD25–, or DN1 cells, although containing potent T-cell developmental potential and relatively potent myeloid and NK potential does not have any residual B-cell potential. Myeloid and NK potential are retained by CD117highCD44+CD25+ DN2 cells, but both are lost once cells become DN3 cells. Development of DN1, and to a greater extent DN2, cells to myeloid and NK cells is IL-7 dependent. Molecular analysis confirms that DN1 cells express transcripts for T and myeloid cell–specific genes but not the B cell–specific gene Pax-5. Taken together, our results provide new information on the commitment status of progenitor thymocytes.
There has been a lack of consensus as to how to correctly identify mouse progenitor thymocytes.14 As initially proposed by Godfrey et al,19 CD117 expression is required to correctly identify DN1 and DN2 thymocytes and to define the transition from DN2 to DN3.14 Our 4-color flow cytometric analysis demonstrated that DN1 cells were more heterogeneous than other DN populations, containing CD117+ and CD117– subpopulations, the latter containing CD19+, NK1.1+, CD11c+, and CD11b+ cells, markers of the B, NK, dendritic cells, and macrophages lineages, respectively.
Recently, it was demonstrated that CD44+CD25– DN1 cells, defined without using CD117 expression, contained some cells responsive to IL-7.46 Analysis of IL-7Rα (CD127) expression shows that many CD117– DN1 cells are brightly CD127+ and comprise a mixture of NKT and NK cells.47 For CD117high DN1 and DN2 cells, CD127 expression was weak on the former but brighter on the latter.48 This difference in CD127 expression correlated with the IL-7 responsiveness of DN1 and DN2 cells in macrophage and NK cell cultures (Table 1) with DN2 cells being more IL-7 responsive than DN1. Our results show that both the growth and lineage development of DN1 and DN2 cells is dependent on IL-7. Myeloid development was more IL-7 dependent than NK cell development and for both lineages DN2 were more IL-7 dependent than DN1 cells.
The growth factor requirement of DN1 and DN2 cells, reported by Moore and Zlotnik,20,49 was used as an indirect indicator of their lineage relationship. By monitoring the kinetics of reconstituting FTOCs with purified DN1 and DN2 cells, we show that DN1 cells develop into DN2 cells and reconstitute the T-cell lineage more slowly than DN2 cells. Recently, a culture system was described whereby OP9 stromal cells expressing the Notch ligand delta-like 1 (so-called OP9-DL1) could support the development of T-cell progenitors isolated from the fetal liver50 or cultures of embryonic stem cells.51 It will be interesting to compare the T-cell developmental potential of sorted DN subpopulations in FTOCs with that obtained using the OP9-DL1 culture system.41
CD117+ DN1 thymocytes are generally considered to represent the earliest cells found in thymus14 and comprise 1% ± 0.2% of total DN cells,47 or about 2 × 10⁴ cells/thymus. The earliest thymic precursor population described by Wu et al15 was CD4low-CD44highCD25–; neither expression of CD117 and CD127 nor in vitro growth requirements was considered at that time. These DN1 cells were shown to be capable of differentiating not only into T cells but also to NK cells,16,32 lymphoid dendritic cells,17,52 macrophages,18,39 and B cells.15 In search of lymphoid-committed progenitor, IL-7R+ Thy-1–Sca-1low CD117low cells, called CLPs, were identified in the BM and their growth was dependent on IL-7.21 These cells had prominent T- and B-cell but not myeloid reconstitution potential; however, their presence in the normal adult mouse thymus was not directly demonstrated. The absence of B-cell potential by DN1 cells indicates that they are not CLPs.
Recently, CD117highCD127neg/lo ETP cells were identified in the thymus30 and their developmental potential compared with CLPs. Mice reconstituted with 2 × 10³ thymic ETPs contained only about 2 × 10⁴ B cells, whereas the same number of CLPs generated 106 B cells. When injected intrathymically, ETP and CLP cells appeared to have similar T-cell developmental potential. Thus, ETP cells more closely resembled HSCs than CLP cells, were not responsive to IL-7 in vitro, and could not easily be assimilated into schemes where DN1 cells were considered to be IL-7 responsive, suggesting that thymopoiesis was independent of CLPs.30 Even though CD117high DN1 cells were only weakly CD127+ (Figure 1), functional assays showed that they were partially IL-7 dependent. Therefore, ETPs and our DN1 cells could be identical.
The B-lymphocyte potential of progenitor thymocytes and whether the thymus is colonized by CLPs have been the subjects of considerable debate. CLPs in the BM clearly had B-progenitor activity.21,53 We show that CD117+ DN1 and DN2 thymocytes, although containing potent T and significant myeloid and NK potential had no B-lymphocyte developmental potential. That B-lymphocyte development of DN1, DN2, and DN3 cells was masked by simultaneous myeloid development was ruled out by culturing cells on OP9 stromal cells either in bulk cultures (unpublished data, November 2003) or at limiting dilution. There is no dispute that committed B-cell progenitors, if present in the circulation as is the case in young mice,28 can enter the thymus and that the thymus is capable of supporting their further development. Thus, mouse age is a crucial parameter in studies concerning thymic B-cell development.28 However, in normal adult mice, no B-cell progenitors can be found in the thymus. Cell types other then T progenitors can enter the thymus following irradiation, for example.54
Using a modified FTOC system, Katsura and colleagues revealed the existence among fetal DN1 cells of bipotential myeloid-T, myeloid-B but not T-B cells subpopulations3,32,33 and proposed a model of progressive lymphoid lineage commitment3,55 whereby the T-B lineage dichotomy was a relatively early event and the myeloid-T and myeloid-B a relatively late event. Our results are most easily interpreted in the context of the Katsura model of progressive lymphoid lineage commitment.
Prepublished online as Blood First Edition Paper, November 2, 2004; DOI 10.1182/blood-2004-08-3087.
Supported by grants from the Swiss National Science Foundation. R.C. is supported by INSERM. A.G.R. is holder of the Chair in Immunology endowed by F. Hoffman-La Roche Ltd, Basel, Switzerland.
The publication costs of this article were defrayed in part by page charge payment. Therefore, and solely to indicate this fact, this article is hereby marked “advertisement” in accordance with 18 U.S.C. section 1734.

