Abstract
Kaposi sarcoma–associated herpesvirus (KSHV) infects endothelial cells within KS tumors, and these cells express the KSHV latent-cycle gene k-cyclin (kCYC) as well as vascular endothelial growth factor receptor 3 (VEGFR-3), a marker for lymphatic endothelium. To further understand KSHV-mediated pathogenesis, we generated transgenic mice expressing kCYC under the control of the VEGFR-3 promoter. kCYC mRNA and functional protein expression within tissue correlated with VEGFR-3 expression and were most abundantly detected within lung tissue. Clinically, most transgenic mice died within 6 months of age secondary to progressive accumulation of chylous pleural fluid. In skin, edema was detected by magnetic resonance imaging and mice demonstrated persistent erythema of the ears following trauma. Histologically, erythematous skin showed extravasation of erythrocytes and accumulation of erythrocytes within lymphatic lumens. In addition, lymphatic drainage of injected contrast dyes was markedly impaired in transgenic mice. Karyomegaly, a feature observed in kCYC-expressing cells in vitro, was detected in many tissues, and selectively occurred within lymphatic endothelial cells expressing kCYC mRNA by in situ hybridization. In summary, kCYC expression within VEGFR-3+ cells of mice causes marked impairment of lymphatic function. kCYC may contribute to the development of certain clinical and histologic features of KS, including localized edema and retention of extravasated erythrocytes within KS tumors.
Introduction
Kaposi sarcoma (KS) is the most common cancer in individuals with AIDS as well as the most common cancer in the general population of many sub-Saharan countries where Kaposi sarcoma-associated herpesvirus (KSHV) infection is endemic.1 Clinically, KS most commonly involves the skin, where lesions appear as dark red-to-purple patches, plaques, nodules, and tumors. Skin lesions are often preceded by or accompanied by localized tissue edema, especially when they are present on the lower extremities. Histologically, KS tumor cells within skin are localized to the dermis where they demonstrate a spindle cell morphology and form irregular, slitlike vascular structures. Numerous inflammatory cells and extravasated erythrocytes are also commonly present within KS tumors. To date, KS tumor cells have been shown to express specific markers for lymphatic endothelium, including vascular endothelial growth factor receptor 3 (VEGFR-3),2-6 podoplanin,5,7 D2-40,8 LYVE-1,9 and Prox-1.9,10
In all clinical forms of KS, tumor cells are infected with the γ-herpesvirus KSHV.3,11-14 Although the KSHV genome encompasses over 80 open reading frames (ORFs),15 the expression of KSHV genes in the vast majority of KS tumor spindle cells is restricted to relatively few latent-cycle genes, including latency-associated nuclear antigen (LANA), k-cyclin (kCYC), and viral FLICE inhibitory protein (vFLIP).3,16-20 kCYC, which is encoded by ORF72, is a cellular cyclin D2 homologue that possesses a number of functional properties believed to be important in KS pathogenesis. It interacts with all types of cyclin-dependent kinases (Cdks), although it preferentially binds to Cdk6.21-24 kCYC/Cdk6 complexes phosphorylate and inactivate both retinoblastoma (Rb) protein24,25 and the Cdk inhibitor p27,26,27 which leads to unregulated progression through the cell cycle. In the presence of normal p53 function, kCYC also sensitizes cells to undergo apoptosis,24,28,29 whereas in the absence of p53, kCYC promotes cell survival.29 Thus, kCYC is believed to play a number of key pathogenic roles in KS and other KSHV-associated diseases.
Although it is critical to study and to fully understand the in vivo function of KSHV genes, there have been relatively few reports of mice that express KSHV transgenes.29-33 To best determine the pathogenic roles that KSHV latent-cycle genes play in vivo, it is important to express KSHV transgenes of interest in cells relevant to KS pathogenesis. Verschuren et al29,33 expressed kCYC under the control of the Eμ promoter, which allows for transgene expression in T and B cells, but not in endothelial cells. By contrast, in this study, we generated transgenic mice that express kCYC within lymphatic endothelial cells under the control of the VEGFR-3 promoter (kCYC+/- mice). Interestingly, our mice developed marked lymphatic dysfunction. Moreover, skin of mice developed persistent erythema following trauma, which demonstrated certain histologic features of KS, including extravasation of erythrocytes and accumulation of erythrocytes within lymphatic lumens.
Materials and methods
Generation of transgenic mice
A 336–base pair (bp) 5′ end fragment of murine VEGFR3 cDNA34 was generated from total RNA derived from BALB/c mouse liver by 5′ rapid amplification of cDNA ends method. This fragment was inserted into the EMBL3 SP6/T7 vector (Clontech, San Diego, CA), radiolabeled with 32P-dCTP, and hybridized to a genomic DNA (gDNA) library derived from adult BALB/c male liver. After 3 rounds of screening 6.0 × 10⁶ phage plaques, positive plaques were isolated and phage DNA was purified using the Lambda Mini Kit (Qiagen, Valencia, CA). Restriction DNA fragments derived from positive phage plaques were subcloned into pUC19 plasmids and sequenced twice in both directions by the deoxynucleotide chain termination method. The nucleotide sequence of an 8920-bp HindIII fragment containing 4.1-kilobase (kb) promoter, 56-bp exon 1, and 4.7-kb intron 1 was deposited in the GenBank database (accession no. AY048674).
To generate the kCYC reporter plasmid, 2 restriction sites (EcoRI and HindIII) at both ends of pUC19 multiple cloning sites were changed to NotI sites, and an SV40 polyA cassette was inserted into the unique KpnI site of pUC19. The unique SalI sites at multiple cloning sites were deleted. Next, a 3.8-kb SmaI-HindIII fragment from the murine VEGFR3 intron 1 was blunt-ended with T4 DNA polymerase and subcloned into the unique site of the polyA-pUC19. A 4.0-kb HindIII-SmaI fragment from the VEGFR-3 promoter was similarly prepared and cloned into the unique site of the VEGFR3 intron 1 (3.8 kb)–polyA-pUC19. The 817-bp SmaI fragment from the 5′ region of VEGFR3 intron 1 was then subcloned into the unique SmaI site of another pUC19 vector. A chemically synthesized 169-bp HpaI fragment, in which the 56-bp exon 1 had been replaced with a SalI site (for insertion of the kCYC gene), was ligated into the unique HpaI site of the 817-bp SmaI fragment-pUC19. The sequence of the 169-bp HpaI fragment was 5′-GTTAACGAATTcccgggCCGCCTCGGCTCCGCCcccgggCCGCTGACCGGTCCGCGCCCCGCCGGCGCCTCTGCGCGCGCTCTCACTCCCAGCCGGGAGCTGTGCCGCGCAGGTCCCACCCGCGCCCAGGGGCCGGAGTCGACAGCCCAACCTCCGCTCCCGGTTAAC-3′ (SalI site is underlined, SmaI sites are lowercase letters). The 982-bp SmaI fragment was produced with polymerase chain reaction (PCR) using 2 primers (5′-GGGCCGCCTCGGCTCCGCCCCCGGGCCGCTGACCGGTCCGCGCCCCGCCG-3′ and 5′-GGGACGCCCTGGCCCTTCACCTCGACGTGGATCGGTCTGAAACTAGGGAC-3′) and the 169-bp HpaI-817 bp SmaI-pUC19 as a template. The 982-bp SmaI fragment was introduced into the unique SmaI site of VEGFR3 intron1 (3.8 kb)–polyA-pUC19 with HindIII-SmaI (4.0 kb). Full-length DNA sequence for kCYC was generated by PCR amplification using the KSHV λ phage library L54 (National Institutes of Health AIDS Research and Reference Reagent Program, Rockville, MD) as a template.35 kCYC was cloned into the SalI site and the transgene was separated from pUC19 by NotI digestion and purified by sucrose-gradient centrifugation prior to microinjection. Transgenic mice were generated by microinjection of fertilized oocytes of the FVB/N strain mouse and the injected zygotes were reimplanted into oviducts of pseudo-pregnant C57BL/6 X C3H/He F1 mice. The Animal Care and Use Committee of the National Cancer Institute approved all aspects of this study.
Genotyping and transgene expression analyses
Mice were genotyped by PCR using DNA extracted from tails. The following kCYC primers were used to genotype mice by PCR: forward, 5′-CTTCTGGATCCCACGCTATG-3′ and reverse, 5′-TCTGTTCGCCACGCCAACTT-3′. To detect and quantify transgene mRNA expression in a variety of tissues, real-time reverse transcription (RT)–PCR (7700 Sequence Detection System; Applied Biosystems, Weiterstadt, Germany) was performed using the following primers: kCYC forward, 5′-CAGAAGCCTCACGCCTATTTCT-3′ and reverse, 5′-CTTGGCGGGAAAAGGAGTCT-3′; VEGFR3 forward, 5′-CGAGCCCCACTTGTCCAA-3′ and reverse, 5′-TGTAGCATACAAGGTCTTCCATGGT-3′); and rodent glyceraldehyde phosphate dehydrogenase (GAPDH; Applied Biosystems).
Immunoprecipitation and kinase assays
Lungs were homogenized into lysis buffer containing phosphate-buffered saline (PBS), 10% glycerol, 0.5 mM EDTA (ethylenediaminetetraacetic acid), 0.2% Triton X-100, 1 mM dithiothreitol (DTT), 1 mM NaF, and 1:500 protease inhibitor cocktail. Extracts were immunoprecipitated with anti-Cdk2,36 anti-Cdk4 (clone 3517-1; Clontech/BD PharMingen, San Diego, CA), and anti-Cdk636 antibodies and loaded onto 12.5% Criterion gels (Bio-Rad Laboratories, Hercules, CA). Sheep anti-KSHV cyclin polyclonal antibody (Exalpha Biologicals, Watertown, MA) was used to detect kCYC/Cdk complexes. Kinase assays using GST-Rb or histone H1 were performed as described.24
In situ hybridization
Routine staining, whole-mount staining, and immunohistochemistry
During necropsy, tissues were obtained from numerous organs, fixed in 10% formalin, embedded in paraffin, and processed for routine hematoxylin and eosin (H and E) staining. Whole ears of mice were stained using a rat antimouse CD31 monoclonal antibody (mAb; BD PharMingen), a hamster antimouse podoplanin mAb (clone 8.1.1, Developmental Studies Hybridoma Bank; Department of Biological Studies, The University of Iowa, Iowa City), and corresponding secondary antibodies labeled with Alexa-Fluor 488 or Alexa-Fluor 594 (Molecular Probes, Eugene, OR) as described.37 Frozen tissue sections (7 μm) were fixed with 4% paraformaldehyde and stained with the antibodies as listed or goat antimouse VEGFR3 polyclonal antibody (R&D Systems, Minneapolis, MN). All images were captured with a Nikon Eclipse TE2000-U microscope, a Nikon digital DXM 1200 camera, and Nikon ACT-1 imaging software version 2.20.
CT and MRI
For computed tomography (CT), mice were induced with 5% isoflurane and then maintained at 1.5% to 2.5% by means of an anesthesia mask for the duration of the scan. During CT scanning, a ventilator providing a controlled flow of anesthetic gases and 90 breaths/min was used. The anesthetic air was warmed by means of a disposable hand warmer, which was wrapped around the anesthesia lines near the anesthesia mask. Although mice were not intubated, this was an effective method for maintaining adequate breathing and anesthetic levels. CT images were acquired with the x-ray source biased at 57 kilovoltage peak (kVp) and 900 μA. The settings for the camera were as follows: transaxial length, 1024; axial length, 800; bin factors, 2; and shutter speed, 450 ms. All scans consisted of 360 degrees with 720 projections and total scan time was about 17 minutes with real-time reconstruction. Scans were acquired using the MicroCAT II (ImTek, Knoxville, TN) and reconstructed images were analyzed using Amira software (TGS, San Diego, CA). Three-dimensional images of lung air space, created by selecting black or “negative” areas and defining them as air, were used for volumetric measurement of air space.
For magnetic resonance imaging (MRI), mice were anesthetized with an intraperitoneal injection of 1.15 mg/0.23 mL sodium pentobarbital (Dainabot, Tokyo, Japan). The PAMAM-G8 dendrimer-based contrast agent (abbreviated as G8; Dendritech, Midland, MI) was prepared as described.38 Over 98% of the amine groups on the dendrimer reacted with the 1B4M as determined by 153Gd (NEN DuPont, Boston, MA) labeling of aliquots as previously described.38 A replacement assay using 153Gd determined that 80% of the 1B4M on the PAMAM-G8 dendrimer-1B4M conjugate was indeed chelating Gd(III) atoms as previously described.38
Micro-MR images were obtained using a 1.5-T superconductive magnet unit (Signa LX; General Electric Medical System, Jupiter, FL). Using a water-enhanced 2-dimensional fast-inversion recovery method as described,39 pleural effusions and skin edema were serially detected and quantified without injection of contrast agent. Briefly, the following machine settings were used: repetition time/echo time, 8000/96 ms; inversion time, 150 ms; 2 excitations; coronal view; field of view, 8 × 4 cm; in-plane matrix, 512 × 256, 1.5-mm section thickness without a gap; 16 slices; and scan time, 2 minutes 16 seconds. To estimate the water content in skin, 2 regions of interest (ROIs) containing consecutive 10 boxels were set on the skin at the bilateral lower neck and the signal intensity values obtained from each ROI were averaged. To evaluate lymphatic flow, mice were given subcutaneous injections of 0.025 μmol Gd/5 μL G8 into the dorsal feet of hind limbs bilaterally (n = 8 in 4 mice) and a 3-dimensional–fast spoiled gradient echo method was used as described.38,39 Briefly, the following machine settings were used: repetition time/echo time, 28.5/7.9 milliseconds; inversion time, 65 milliseconds; flip angle, 30 degrees; 4 excitations; coronal view; field of view, 6 × 3 cm; in-plane matrix, 512 × 256, 0.6-mm section thickness with a 0.3-mm overlap; 72 slices; and scan time, 7 minutes and 36 seconds. Chemical fat suppression was used at 5, 15, 30, 45, and 60 minutes after injection of the contrast agents. To evaluate the opacity of thoracic ducts and abdominal lymph nodes, slice data were processed into 3-dimensional images using the maximum intensity projection method (Advantage Windows version 3.0, General Electric Medical Systems). Three kCYC+/- mice and 3 wild-type (WT) littermate control mice of the same age were studied for each type of experiment.
Dye injection study
Eight mg/mL fluorescein isothiocyanate (FITC)–dextran (molecular weight [MW] = 2000 kDa; Sigma, St Louis, MO) was injected intradermally into mouse ears and lymphatic vessels were analyzed by fluorescence microscopy as described.40 To quantify lymphatic drainage, 5 mg/mL Evans blue dye (Sigma) was injected into footpads of hind limbs, popliteal lymph nodes were harvested 10 minutes after injection, and dye content was quantified as described.41
Statistical analysis
Data were compared using the 2-tailed Student t test unless described otherwise. The null hypothesis was rejected at P values of less than .05.
Results
Generation of kCYC+/- transgenic mice using murine VEGFR-3 promoter
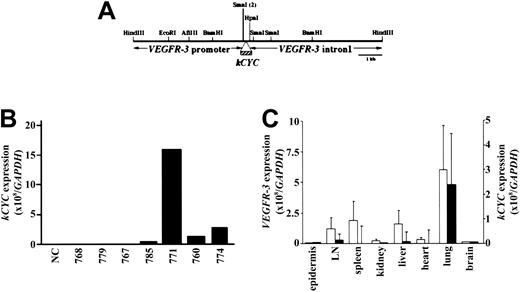
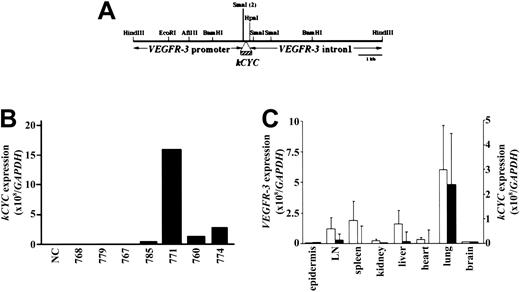
KSHV kCYC was inserted downstream of the murine VEGFR-3 promoter in place of VEGFR3 exon 1 (Figure 1A) and used to generate 11 kCYC+/- mice that were positive for kCYC DNA by Southern hybridization (data not shown). Following mating with FVB/N mice (WT), 7 of these 11 founder mice had kCYC DNA+ offspring by PCR. F1 mice generated from these 7 founder mice were then screened for phenotypes and for kCYC mRNA expression using RNA extracted from lung tissue and quantitative real-time RT-PCR. F1 heterozygous mice generated from the founder mouse 771 died prematurely (see “Premature death and pleural effusion in kCYC+/- transgenic mice”) and expressed markedly higher levels of kCYC mRNA when compared to F1 mice generated from other founder mice (Figure 1B). All further experiments described here were carried out in 771 kCYC heterozygous (kCYC+/-) transgenic mice and WT littermates from 5 to 14 weeks of age. We next determined tissue-specific expression of kCYC and VEGFR3 mRNA. VEGFR3 mRNA was expressed highest in lungs and modestly in lymph nodes, spleen, and liver (Figure 1C). The expression pattern of kCYC mRNA in different tissues correlated with that of VEGFR3 mRNA (Figure 1C), suggesting, as expected, that kCYC mRNA was expressed at sites of VEGFR3 mRNA expression.
Generation of kCYC+/- transgenic mice using murine VEGFR-3 promoter. (A) Construct design used for generation of mice. (B) kCYC-specific mRNA expression by real-time RT-PCR using lung tissue from different founder lines. (C) Real-time RT-PCR for VEGFR3 (□, left y-axis) and kCYC (▪, right y-axis) mRNA in different tissues (mean ± SD, n = 5). LN, lymph node.
Generation of kCYC+/- transgenic mice using murine VEGFR-3 promoter. (A) Construct design used for generation of mice. (B) kCYC-specific mRNA expression by real-time RT-PCR using lung tissue from different founder lines. (C) Real-time RT-PCR for VEGFR3 (□, left y-axis) and kCYC (▪, right y-axis) mRNA in different tissues (mean ± SD, n = 5). LN, lymph node.
Functional kCYC protein expression in lungs of kCYC+/- transgenic mice
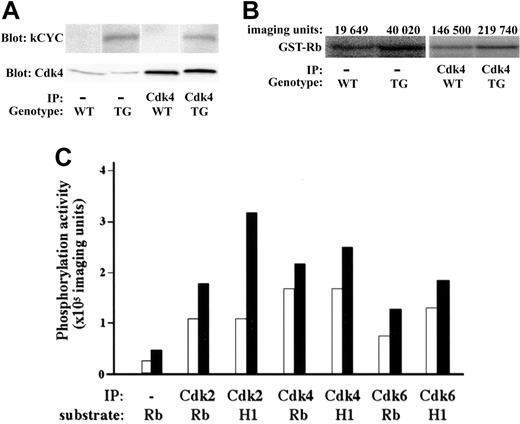
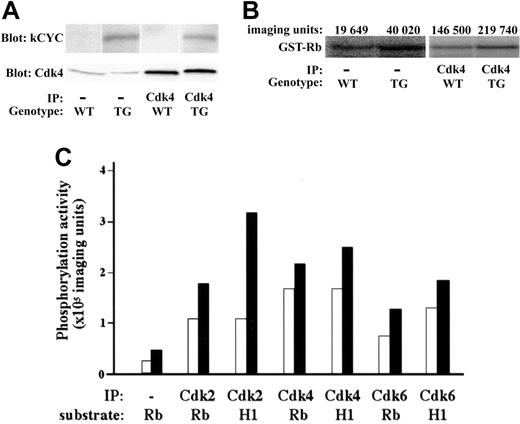
We then checked the expression and function of kCYC protein in lungs of transgenic mice. kCYC was detected in the lung of kCYC+/- mice and immunoprecipitated with anti-Cdk2, 4, and 6 antibodies (Figure 2A and data not shown), proving that kCYC protein was expressed in our transgenic mice and that it was bound to cellular Cdk complexes, consistent with previous in vitro studies on kCYC.21-24 We also demonstrated that kCYC/Cdk complexes were functionally active because they were able to phosphorylate both Rb and histone H1 (Figure 2B-C), again consistent with previous in vitro studies.24,25
Functional kCYC protein expression in lungs of kCYC+/- transgenic mice. (A) Western blotting using total protein and immunoprecipitated protein (using anti-Cdk4 antibodies) isolated from lung tissue. IP indicates immunoprecipitation; TG, kCYC+/- mice. (B) Kinase assay using lung tissue and GST-Rb as a substrate. (C) Quantitative summary of kinase assays. WT (□) and TG (▪) mice (n = 2). H1 indicates histone H1.
Functional kCYC protein expression in lungs of kCYC+/- transgenic mice. (A) Western blotting using total protein and immunoprecipitated protein (using anti-Cdk4 antibodies) isolated from lung tissue. IP indicates immunoprecipitation; TG, kCYC+/- mice. (B) Kinase assay using lung tissue and GST-Rb as a substrate. (C) Quantitative summary of kinase assays. WT (□) and TG (▪) mice (n = 2). H1 indicates histone H1.
Premature death and pleural effusion in kCYC+/- transgenic mice
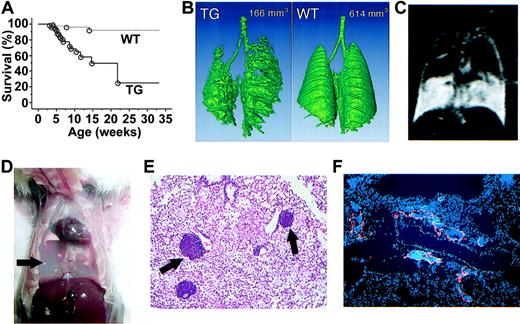
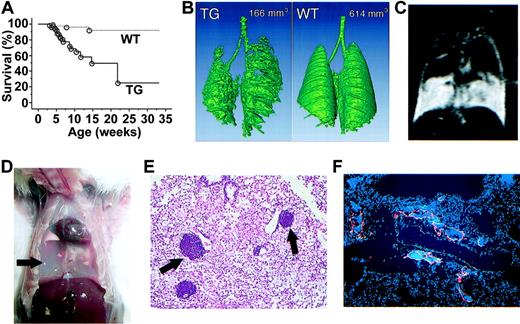
kCYC+/- transgenic mice died prematurely starting at 3 weeks of age; approximately 80% of mice were dead by 6 months of age (P < .001; Figure 3A). kCYC+/- mice were significantly heavier than WT littermates at both 3 (11.3 ± 0.8 g versus 10.1 ± 0.9 g; P < .005) and 5 weeks of age (18.0 ± 2.3 g versus 17.1 ± 1.9 g; P < .04), suggesting fluid accumulation in transgenic mice. Indeed, with water-enhanced images, MRI showed that the water content in skin was higher in kCYC+/- mice when compared to WT littermates (1693 ± 131 versus 1265 ± 83; P < .001). Importantly, we regularly observed labored breathing in kCYC+/- mice within 1 week of death. CT and MRI scans of the lungs prior to death demonstrated progressive accumulation of fluid within pleural cavities that significantly compromised air spaces (Figure 3B-C). Necropsies revealed 0.25 to 1.5 mL chylous fluid within pleural cavities in nearly all mice that died prematurely (Figure 3D). Pleural fluid contained approximately 90% lymphocytes and 10% monocytes, but no tumor cells or infectious organisms, suggesting that pleural fluid accumulation was secondary to impaired reabsorption of fluid. Histologically, lungs showed marked congestion and infiltration of macrophages and lymphocytes, with collections of lymphocytes often localized to vascular structures adjacent to blood vessels (Figure 3E). These dilated vessels packed with lymphocytes were VEGFR-3+ (Figure 3F), suggesting they were lymphatics.
Premature death and pleural effusion in kCYC+/- transgenic mice. (A) Kaplan-Meier survival curves for transgenic (TG) mice (solid line, n = 77) and WT littermates (dotted line, n = 94). (B) A 3-dimensional reconstituted CT image of a TG mouse and a WT littermate with numbers showing air space content. (C) Chylothorax detected by water-enhanced MR images. (D) Chylous fluid (arrow) in pleural cavity following removal of the lungs. (E) H and E staining of lung tissue showing lymphocytes contained within vascular structures near blood vessels (arrows) (× 100). (F) Anti-VEGFR-3 for lymphatics (red) and DAPI (4,6 diamidino-2-phenylindole) staining for nuclei (blue) in lung tissue showing lymphatics filled with cells (× 100).
Premature death and pleural effusion in kCYC+/- transgenic mice. (A) Kaplan-Meier survival curves for transgenic (TG) mice (solid line, n = 77) and WT littermates (dotted line, n = 94). (B) A 3-dimensional reconstituted CT image of a TG mouse and a WT littermate with numbers showing air space content. (C) Chylothorax detected by water-enhanced MR images. (D) Chylous fluid (arrow) in pleural cavity following removal of the lungs. (E) H and E staining of lung tissue showing lymphocytes contained within vascular structures near blood vessels (arrows) (× 100). (F) Anti-VEGFR-3 for lymphatics (red) and DAPI (4,6 diamidino-2-phenylindole) staining for nuclei (blue) in lung tissue showing lymphatics filled with cells (× 100).
Erythematous ears and erythrocyte-filled dermal lymphatics in kCYC+/- transgenic mice
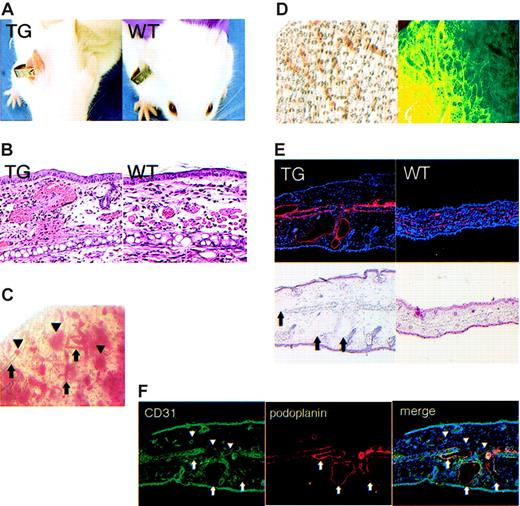
The ears of all kCYC+/- mice that had been tagged with identification labels were diffusely erythematous within 1 week following tagging (Figure 4A). This phenotype was not observed in tagged ears of WT littermates (Figure 4A), and thus served as a reliable, visible, and relatively noninvasive marker for identification of kCYC+/- transgenic mice. In fact, blinded genotyping of mice by PCR was always positive in mice with tagged erythematous ears and always negative in tagged ears of mice without erythema (data not shown). This phenotype was most prominent 1 week following tagging and lasted several months, with the ears gradually returning to normal color. Histologically, tagged erythematous ears of transgenic mice showed numerous extravasated erythrocytes within the dermis and dilation of dermal vascular structures that contained erythrocytes, whereas histologic features in tagged ears of WT mice were unremarkable (Figure 4B). These features were also not observed in nontagged ears of transgenic mice (data not shown). Whole-mount visualization of unstained tagged ears of transgenic mice revealed blood within and outside of vascular structures (Figure 4C), which was consistent with the histologic findings. Whole-mount staining of tagged ears with antibodies directed against podoplanin, a lymphatic-specific marker, revealed the blood-filled vascular structures to be lymphatics (Figure 4D). We also confirmed this result by immunohistochemistry, which showed that the dilated dermal vascular structures were podoplanin positive and contained erythrocytes (Figure 4E). Lastly, in double-labeling experiments, we demonstrated that the dilated vascular structures in tagged ears were CD31 (also known as platelet endothelial cell adhesion molecule [PECAM]) dimly positive and podoplanin positive, whereas the nondilated blood vessels were CD31 strongly positive and podoplanin negative (Figure 3F). We also confirmed that the dilated dermal vessels in tagged ears of transgenic mice were VEGFR-3+, which is another specific marker for lymphatics (data not shown). Thus, although it is not typical to find erythrocytes within dermal lymphatics, this was clearly the case following trauma to the skin in our kCYC+/- transgenic mice.
Erythematous ears and blood-filled dermal lymphatics in kCYC+/- transgenic mice. (A) Erythematous ear 1 week after tagging in a TG (left), but not WT (right), mouse. (B) H and E staining of skin from tagged ears showing extravasated erythrocytes and erythrocytes filling vascular structures in TG (left), but not in WT (right), skin (× 100). (C) Whole-mount visualization of an unstained tagged TG mouse ear showing blood within (arrows) and outside of (arrowheads) vascular structures. (D) Whole-mount visualization of a tagged TG ear by light (left) and immunofluorescence (right, podoplanin staining in green) microscopy showing lymphatics filled with blood. (E) Antipodoplanin (red) and H and E staining on serial sections of a tagged TG ear showing dilated lymphatics filled with erythrocytes (arrows) (× 40). (F) Anti-CD31 (green) and antipodoplanin (red) staining of tagged TG ear showing that dilated vessels are CD31 dimly positive and podoplanin positive (arrows), which is consistent with a lymphatic phenotype. By contrast, the nondilated blood vessels are CD31+ and podoplanin negative (arrowheads) (× 40).
Erythematous ears and blood-filled dermal lymphatics in kCYC+/- transgenic mice. (A) Erythematous ear 1 week after tagging in a TG (left), but not WT (right), mouse. (B) H and E staining of skin from tagged ears showing extravasated erythrocytes and erythrocytes filling vascular structures in TG (left), but not in WT (right), skin (× 100). (C) Whole-mount visualization of an unstained tagged TG mouse ear showing blood within (arrows) and outside of (arrowheads) vascular structures. (D) Whole-mount visualization of a tagged TG ear by light (left) and immunofluorescence (right, podoplanin staining in green) microscopy showing lymphatics filled with blood. (E) Antipodoplanin (red) and H and E staining on serial sections of a tagged TG ear showing dilated lymphatics filled with erythrocytes (arrows) (× 40). (F) Anti-CD31 (green) and antipodoplanin (red) staining of tagged TG ear showing that dilated vessels are CD31 dimly positive and podoplanin positive (arrows), which is consistent with a lymphatic phenotype. By contrast, the nondilated blood vessels are CD31+ and podoplanin negative (arrowheads) (× 40).
Karyomegaly and kCYC mRNA positivity in nuclei of lymphatic endothelial cells in kCYC+/- transgenic mice
Other than the gross and histologic changes observed in lung and tagged ear skin as described, necropsy surveys of a wide array of transgenic mouse tissues, including the lung, skin, heart, gastrointestinal tract, and liver, consistently revealed the presence of karyomegaly in endothelial cells (Figure 5A). The lung and skin demonstrated the highest number of these karyomegalic cells. These cells were never observed in tissues isolated from WT littermate mice. Interestingly, karyomegaly, which is caused by nuclear division without concomitant cellular division, has been described in cells that express kCYC in vitro29 as well as cells that overexpress cellular cyclins.42,43 Approximately half of the karyomegalic cells were Ki-67+ (data not shown), suggesting DNA replication was occurring in those cells. In most cases, karyomegalic endothelial cells lined dilated vascular structures that contained erythrocytes. To further characterize the nature of the karyomegalic endothelial cells, we stained the tissues with antipodoplanin and anti-VEGFR-3 antibodies. These cells stained positively for both podoplanin and VEGFR-3 (Figure 5B), indicating they were lymphatic endothelial cells. Importantly, in situ hybridization experiments using radiolabeled antisense probes revealed prominent kCYC mRNA signals localized to karyomegalic lymphatic endothelial cells in tagged transgenic ear skin (Figure 5C). Human cutaneous KS served as a positive control and tagged transgenic ear skin using radiolabeled sense probes served as a negative control for the in situ hybridization experiments (Figure 5C and data not shown). These experiments provided direct proof that transgene expression was localized to lymphatic endothelial cells and that high levels of kCYC expression were directly responsible for inducing karyomegaly in vivo.
Karyomegaly and kCYC mRNA positivity in nuclei of cells lining dilated vascular structures that express podoplanin and VEGFR-3 in kCYC+/- transgenic mice. (A) H and E staining of TG lung (left) and tagged TG ear skin (right) showing karyomegaly of endothelial cells (arrows). These cells were never observed in tissue obtained from WT mice (data not shown) (× 100-200). (B) Karyomegaly of endothelial cells (arrows and blue DAPI stain) lining vascular structures in tagged TG ear skin that contain erythrocytes and express podoplanin (red) and VEGFR-3 (green) (× 200). (C) In situ hybridizations for kCYC mRNA in tagged TG ear skin of 2 different mice both showing positive antisense signals in karyomegalic cells that line dilated vascular structures and contain erythrocytes. Dark field (i) and bright field (ii) from a single mouse processed with 35S-radiolabeled antisense probes for 7 days. Lower panels show serial sections of tissue from a second mouse processed with 35S-radiolabeled antisense (AS, left) or sense (S, right) control probes. Signals above background were never observed in tissues obtained from WT mice (data not shown) (× 200).
Karyomegaly and kCYC mRNA positivity in nuclei of cells lining dilated vascular structures that express podoplanin and VEGFR-3 in kCYC+/- transgenic mice. (A) H and E staining of TG lung (left) and tagged TG ear skin (right) showing karyomegaly of endothelial cells (arrows). These cells were never observed in tissue obtained from WT mice (data not shown) (× 100-200). (B) Karyomegaly of endothelial cells (arrows and blue DAPI stain) lining vascular structures in tagged TG ear skin that contain erythrocytes and express podoplanin (red) and VEGFR-3 (green) (× 200). (C) In situ hybridizations for kCYC mRNA in tagged TG ear skin of 2 different mice both showing positive antisense signals in karyomegalic cells that line dilated vascular structures and contain erythrocytes. Dark field (i) and bright field (ii) from a single mouse processed with 35S-radiolabeled antisense probes for 7 days. Lower panels show serial sections of tissue from a second mouse processed with 35S-radiolabeled antisense (AS, left) or sense (S, right) control probes. Signals above background were never observed in tissues obtained from WT mice (data not shown) (× 200).
Abnormal lymphatic architecture and function in kCYC+/- transgenic mice
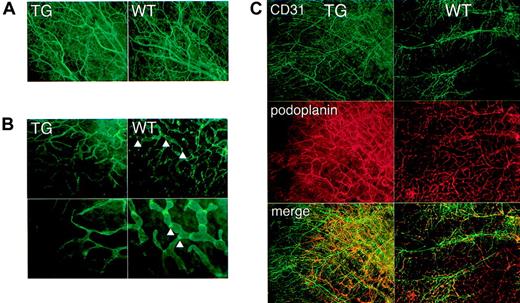
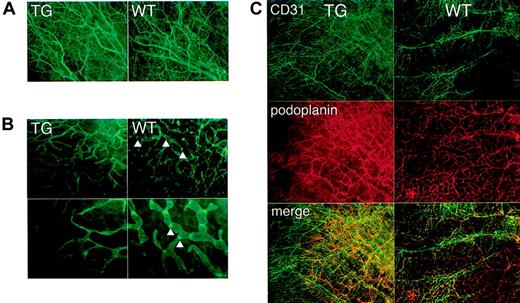
Increased body weight, accumulation of chylous fluid in pleural cavities, and collection of erythrocytes and lymphocytes in dilated lymphatics were clinical and histologic features that suggested lymphatic dysfunction in kCYC+/- mice. To prove this more directly, we first characterized the lymphatic architecture of transgenic mice by immunofluorescence staining. Whole-mount staining for CD31 of nontagged ears revealed no remarkable differences between kCYC+/- mice and WT littermates (Figure 6A), suggesting that blood endothelial cells and blood vessels were grossly normal in transgenic mice. By contrast, whole-mount staining for podoplanin, a lymphatic-specific marker, of nontagged ears revealed marked abnormalities in transgenic mice. Lymphatics were thinner and more tapered when compared to lymphatics in normal mice (Figure 6B). They also were devoid of nodelike structures, which we believe may be lymphatic valves (Figure 6B). Double staining for CD31 and podoplanin confirmed the results of the single-staining experiments (Figure 6C). Thus, the results suggested that blood vessel architecture was preserved, whereas lymphatic architecture was affected in transgenic mice, which are consistent with lymphatic endothelial cell-specific expression of kCYC.
Abnormal lymphatic architecture in skin of kCYC+/- transgenic mice. Whole-mount staining of nontagged TG (left panels) and WT (right panels) ear skin for CD31 (A,C) and podoplanin (B-C) showing normal blood vessel number and architecture (A,C) and abnormal lymphatic architecture (B-C) in TG mice, that is, lymphatics of TG mice are lacking valvelike structures (arrowheads) (× 200-400).
Abnormal lymphatic architecture in skin of kCYC+/- transgenic mice. Whole-mount staining of nontagged TG (left panels) and WT (right panels) ear skin for CD31 (A,C) and podoplanin (B-C) showing normal blood vessel number and architecture (A,C) and abnormal lymphatic architecture (B-C) in TG mice, that is, lymphatics of TG mice are lacking valvelike structures (arrowheads) (× 200-400).
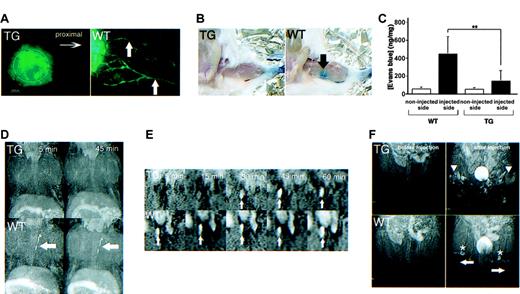
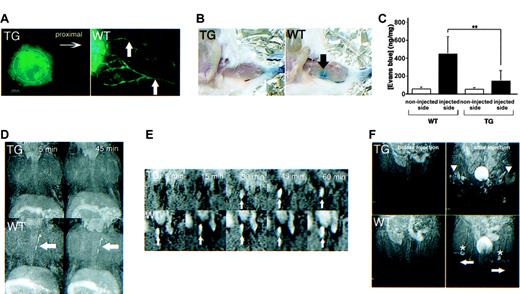
As demonstrated by a number of assays, lymphatics of kCYC transgenic mice were also markedly abnormal in function. First, we observed little to no lymphatic drainage in nontagged ears of transgenic mice 5 minutes following intradermal injection of FITC-dextran (Figure 7A). To quantify lymphatic drainage, we next injected Evans blue dye into the footpads of mice and measured dye content in ipsilateral popliteal lymph nodes. Gross examination of popliteal lymph nodes of WT littermates, but not those from transgenic mice, showed blue staining 10 minutes following Evans blue dye injection into the footpad (Figure 7B). Accordingly, popliteal lymph nodes of WT mice contained significantly higher dye content compared to lymph nodes from transgenic mice (P < .003, Figure 7C).
Abnormal lymphatic function in kCYC+/- transgenic mice. (A) Fluorescence microscopy of whole-mounted nontagged ear 5 minutes following intradermal injection of FITC-dextran showing lack of lymphatic drainage in TG mice (left); lymphatics (arrows) are easily visualized in WT mice (right) (× 200). (B) Evans blue dye accumulation in popliteal lymph node (arrow) 10 minutes following dermal injection into footpad is not detected in TG mice (left), whereas the popliteal lymph node is easily visualized in WT mice (right). (C) Quantification (mean ± SD) of Evans blue dye content in popliteal lymph nodes after dermal injection into footpad (n = 8). MRI lymphangiograms showing (D) no thoracic duct enhancement (arrows) 5 and 45 minutes following injection of the dendrimer G8 bilaterally into the midphalangeal areas of TG mice (top row), whereas enhancement is observed in WT mice as early as 5 minutes following injection of G8 (bottom row); (E) delayed detection of the right external iliac node (arrows) in TG (top row), compared to WT (bottom row), mice following injection of the dendrimer G8 bilaterally into the midphalangeal areas; and (F) poor visualization of popliteal lymph nodes (asterisks) and evidence of backflow (arrowheads) in superficial lymphatics of the lower extremities (arrows) in TG (upper), but not WT (lower), mice 15 minutes following G8 injection bilaterally into the midphalangeal areas.
Abnormal lymphatic function in kCYC+/- transgenic mice. (A) Fluorescence microscopy of whole-mounted nontagged ear 5 minutes following intradermal injection of FITC-dextran showing lack of lymphatic drainage in TG mice (left); lymphatics (arrows) are easily visualized in WT mice (right) (× 200). (B) Evans blue dye accumulation in popliteal lymph node (arrow) 10 minutes following dermal injection into footpad is not detected in TG mice (left), whereas the popliteal lymph node is easily visualized in WT mice (right). (C) Quantification (mean ± SD) of Evans blue dye content in popliteal lymph nodes after dermal injection into footpad (n = 8). MRI lymphangiograms showing (D) no thoracic duct enhancement (arrows) 5 and 45 minutes following injection of the dendrimer G8 bilaterally into the midphalangeal areas of TG mice (top row), whereas enhancement is observed in WT mice as early as 5 minutes following injection of G8 (bottom row); (E) delayed detection of the right external iliac node (arrows) in TG (top row), compared to WT (bottom row), mice following injection of the dendrimer G8 bilaterally into the midphalangeal areas; and (F) poor visualization of popliteal lymph nodes (asterisks) and evidence of backflow (arrowheads) in superficial lymphatics of the lower extremities (arrows) in TG (upper), but not WT (lower), mice 15 minutes following G8 injection bilaterally into the midphalangeal areas.
Lastly, we performed a series of lymphangiogram studies using dynamic MRI with a dendrimer contrast agent, abbreviated G8.39,44 Following subcutaneous injection of G8 into the dorsal midphalangeal area of the lower extremities bilaterally, the thoracic duct was visualized as early as 5 minutes following injection in WT mice, whereas the thoracic duct was not visualized at either 5 or 45 minutes after injection in the transgenic mice (Figure 7D). Because necropsy revealed the anatomic presence of thoracic ducts in transgenic mice (data not shown), this result was attributed to lymphatic dysfunction. Using the same injection procedure, we also visualized the external iliac node of WT mice 5 minutes following injection, whereas enhancement was first observed 30 minutes following injection in transgenic mice (Figure 7E). Similarly, popliteal lymph nodes were clearly visualized in WT mice, but obscured in transgenic mice, 15 minutes following injection (Figure 7F). The lymphatics of transgenic mice also demonstrated signs of “backflow,” defined as the filling of more superficial lymphatics with G8 following initial filling of the deeper lymphatics. Thus, these studies collectively revealed that lymphatic flow in kCYC+/- transgenic mice was markedly impaired.
Discussion
Transgenic mice that expressed KSHV kCYC within lymphatic endothelial cells developed marked lymphatic dysfunction as well as erythematous skin at sites of trauma. These mice did not develop KS-like skin lesions or other types of cancer, which was not surprising because we expressed a single KSHV latent-cycle gene. Several other latent-cycle genes are expressed in KS tumor cells, including LANA and vFLIP.3,16,18,20 It is likely that interactions between the latent-cycle gene products are essential for tumorigenesis. For example, phosphorylation of Rb by kCYC activates the p53 pathway,24,28,29 whereas LANA can bind p53 and interfere with its function.45 Verschuren et al29,33 have described the development of lymphomas in transgenic mice that express kCYC in lymphocytes, but only in the context of a p53-null genetic background. We are now mating kCYC+/- mice with p53-/- mice to determine whether lymphatic endothelial cell proliferation and cancer are more likely to occur in this context.
KSHV lytic-cycle genes (eg, G-protein–coupled receptor [vGPCR]) expressed in a small proportion of tumor cells or surrounding inflammatory cells may also be necessary for endothelial cells to form tumors.30,31 Montaner et al31 reported that mice infected with an endothelial cell-specific recombinant virus expressing vGPCR demonstrated angioproliferative tumors that resembled human KS. They also showed that injection of small number of endothelial cells expressing vGPCR combined with endothelial cells expressing kCYC and vFLIP were able to form large tumors in nude mice, suggesting a cooperative role among viral latent-cycle and lytic-cycle genes in the formation of KS tumors. We are planning to crossbreed kCYC+/- mice with vGPCR transgenic mice to study this possibility further.
Commonly, the presence of erythrocytes within the lumen of a vessel has been used as a key histologic feature to identify blood vessels (as opposed to lymphatic vessels). Similarly, in KS, the histologic presence of slitlike vascular spaces that contain erythrocytes has been used as evidence that these spaces represent blood vessels. Interestingly, our kCYC+/- mice developed persistent trauma-induced erythema (Figure 4A), which histologically showed numerous erythrocytes both inside and outside of dilated vessels that expressed lymphatic endothelial cell markers (Figure 4B,E,F). Thus, our study suggests that the presence of erythrocytes within lumens of vessels should not be used as a criterion to distinguish blood vessels from lymphatics. This may be a particularly important point for pathologists involved in the classification of vascular tumors.
Although VEGFR-3 is useful for distinguishing lymphatic endothelial cells from blood vessel endothelial cells in adults, it is important to note that VEGFR-3 is expressed in both types of endothelial cells during embryogenesis.46 Thus, it is likely that kCYC was expressed in embryonic blood endothelium of our kCYC+/- transgenic mice. We did not observe, however, either clinical or histologic phenotypes that suggested abnormalities of blood vessels. In fact, the number and structure of blood vessels appeared normal in our mice (Figures 4 and 6). To exert noticeable functional effects, our data suggest that kCYC expression within endothelium needs to occur over a sustained (ie, several weeks) period of time. Because blood vessels appeared normal in our mice, our data also suggest that brief expression of kCYC during embryogenesis did not lead to lymphatic reprogramming of blood vessels, as recently described in KSHV-infected blood endothelial cells.9,10 Functional studies on both lymphatic and blood vessel endothelial cells isolated from our kCYC+/- transgenic mice may be useful to investigate this issue further.
Almost all of the kCYC+/- transgenic mice died due to progressive accumulation of pleural fluid and secondary respiratory insufficiency. Pajusola and colleagues previously showed that lungs of fetal mice expressed the highest levels of VEGFR3 mRNA,47 and the results from our quantitative real-time RT-PCR experiments confirmed this finding (Figure 1C). The nonspecific lymphocyte-rich chylous pleural effusions suggested that pleural fluid accumulation in our mice was caused by impaired reabsorption of lymph in the pleural cavity and not from malignancy or infection. The lymphocyte-filled lymphatics (Figure 3E-F) likely reflect a markedly impaired flow rate within pleural lymphatics. This finding is analogous to the erythrocyte-filled skin lymphatics (Figure 4), which did not function well enough to clear these cells from the dermis following trauma. Although further study is required to determine the precise mechanism involved in lymphatic dysfunction, we showed that lymphatic endothelial cells were karyomegalic, suggesting that kCYC was directly involved in causing disruption of lymphatic architecture and function.
Of further note, we used several new technologies to evaluate lymphatic function in our mice. The volumes of the lung air space were calculated by reconstituting 3-dimensional CT images (Figure 3B), which could be readily adapted to study additional types of lung disease in model mice. Lymphangiography with MRI was also used in our study. Using this technology, we were clearly able to show water accumulation within tissue and delayed lymphatic flow within kCYC+/- transgenic mice (Figure 7). Interestingly, patients with KS often develop localized edema at the site of skin tumors, whereas patients with KSHV-associated primary effusion lymphoma (PEL) commonly present with pleural effusion. Our study suggests that both localized edema within KS tumors and pleural effusion in patients with PEL may represent evidence that lymphatics within skin and lung, respectively, are functionally impaired. Further examination of lymphatic structure and function would be an interesting research area to pursue in patients with KS and other KSHV-associated diseases.
Prepublished online as Blood First Edition Paper, November 9, 2004; DOI 10.1182/blood-2004-08-3364.
Supported in part by the National Institutes of Health intramural program. M. Sugaya and T.W. contributed equally to this work. The authors declare that they have no competing financial interests.
The publication costs of this article were defrayed in part by page charge payment. Therefore, and solely to indicate this fact, this article is hereby marked “advertisement” in accordance with 18 U.S.C. section 1734.
We thank L. Feigenbaum (National Cancer Institute) for derivation of the transgenic mice and J. Vogel (National Cancer Institute), M. Udey (National Cancer Institute), A. Moses (Oregon Health & Science University), and X.-J. Wang (Oregon Health & Science University) for many helpful discussions and critical review of the manuscript.

