Abstract
Down-regulation of immune responses by regulatory T (Treg) cells is an important mechanism involved in the induction of tolerance to allo-antigens (Ags). Recently, a novel subset of Ag-specific T-cell receptor (TCR)αβ+ CD4-CD8- (double-negative [DN]) Treg cells has been found to be able to prevent the rejection of skin and heart allografts by specifically inhibiting the function of antigraft-specific CD8+ T cells. Here we demonstrate that peripheral DN Treg cells are present in humans, where they constitute about 1% of total CD3+ T cells, and consist of both naïve and Ag-experienced cells. Similar to murine DN Treg cells, human DN Treg cells are able to acquire peptide–HLA-A2 complexes from antigen-presenting cells by cell contact-dependent mechanisms. Furthermore, such acquired peptide-HLA complexes appear to be functionally active, in that CD8+ T cells specific for the HLA-A2–restricted self-peptide, Melan-A, became sensitive to apoptosis by neighboring DN T cells after acquisition of Melan-A–HLA-A2 complexes and revealed a reduced proliferative response. These results demonstrate for the first time that a sizable population of peripheral DN Treg cells, which are able to suppress Ag-specific T cells, exists in humans. DN Treg cells may serve to limit clonal expansion of allo-Ag–specific T cells after transplantation.
Introduction
Compelling evidence indicates that regulatory T (Treg) cells play an important role in the maintenance of immune tolerance to self- and foreign antigens (Ags).1-3 In mice and humans, various subsets of T lymphocytes that have the ability to down-regulate the proliferation of autoimmune effector cells have been isolated.4-6 CD4+CD25+ T cells are the most extensively studied Treg cells. Eliminating CD4+CD25+ T cells from the periphery of mice leads to the development of systemic autoimmune diseases, and adding them back can ameliorate experimentally induced autoimmune diseases and graft-versus-host disease after allogeneic bone marrow transplantation.7,8 Other Treg cells, including CD4+CD45Rblow, CD4+DX5+ T cells,9 CD8+ T cells,10 T-cell receptor (TCR)γδ+ cells,11 and TCRαβ+ CD3+CD4-CD8- double-negative (DN) T cells12,13 have also been demonstrated to have a potent role in down-regulating immune responses.
The majority of peripheral TCRαβ+ CD3+ T cells in normal mice express either CD4 or CD8 molecules. However, approximately 1% to 3% of peripheral CD3+ T cells express TCRαβ but neither CD4 nor CD8 and are thus DN T cells. Strober et al14 were the first to describe a natural suppressor activity of DN T cells that was not major histocompatibility complex (MHC) restricted. In humans and mice, DN T cells are detected in lymphoid and nonlymphoid tissues (for a review, see Reimann15 ). Clonal or oligoclonal expansion of DN T cells in humans has been reported in healthy individuals16 and in patients with either autoimmune diseases15,17 or combined immunodeficiency with features of autologous graft-versus-host disease.18
Zhang and colleagues12 were the first to identify and characterize Ag-specific DN Treg cells. They initially demonstrated, in mice, that DN Treg cells have a unique phenotype that makes the DN Treg cells different from any previously described T cell. They further demonstrated that (1) DN Treg cells, as a novel subset of Treg cells, can specifically down-regulate immune responses toward allo-Ags both in vitro and in vivo12 ; (2) both primary activated and cloned DN Treg cells can specifically kill activated CD4+ and CD8+ T cells with the same TCR specificity12,19,20 ; and (3) infusion of in vitro–activated DN Treg cells leads to significant prolongation of donor-specific skin12 and heart graft survival.21 Others have shown that DN Treg cells also play an immune regulatory role in autoimmune and infectious diseases.13
In vitro studies have identified a unique mechanism by which DN Treg cells mediate an Ag-specific suppression of syngeneic responder cells. Studies showed that DN Treg cells can use their TCR to acquire allo-MHC peptides from antigen-presenting cells (APCs) and use them to specifically trap and kill CD4+ or CD8+ T cells that recognize the same allo-MHC peptides through a process that requires cell-to-cell contact and Fas/FasL interaction.12
Although it has been evident that the DN Treg cell population constitutes a unique lineage of professional Treg cells crucial in preventing graft rejection and graft-versus-host disease in mice,22 it was unclear whether DN T cells with similar functional properties are naturally present in humans. In the present study we show that this indeed is the case and that the DN T cells in the peripheral blood of healthy adult volunteers are not extrathymically differentiated T cells but rather intrathymically matured Treg cells that exhibit functional properties similar to those discovered in mice.
Materials and methods
Culture medium, cytokines, and peptides
Cells were cultured in supplemented RPMI 1640 medium (M′ medium). The following recombinant human cytokines were used: 100 U/mL interleukin 2 (IL-2; Chiron, Muenchen, Germany), 800 U/mL granulocyte-macrophage colony-stimulating factor (GM-CSF; Schering-Plough, Brussels, Belgium), 500 U/mL IL-4, 10 ng/mL IL-1β, 1000 U/mL IL-6, 10 ng/mL tumor necrosis factor α (TNF-α; all from PromoCell, Heidelberg, Germany), and 1 μg/mL prostaglandin E2 (PGE2; Pharmacia, Erlangen, Germany). Preparation of T-cell growth factor (TCGF) was described previously.23
The following HLA-A2–binding peptides were prepared by Clinalfa (Laeufelingen, Switzerland): modified Melan-A26-35 (ELAGIGILTV) and gp100280-288 (YLEPGPVTA). The identity of each peptide was confirmed by mass spectral analysis.
MHC peptide multimers and mAbs
Phycoerythrin-conjugated (PE)–labeled HLA-A*0201 multimer that had been folded around Melan-A26-35 was synthesized by Beckman Coulter (Fullerton, CA). Monoclonal antibodies (mAbs) were from Becton Dickinson (San Jose, CA), except anti–CD95-fluorescein isothiocyanate (FITC), anti–CTLA-4-PE (PharMingen, San Diego, CA), anti–CD27-FITC, anti–CD28-FITC, anti–CD45RA-allophycocyanin (Caltag, Burlingame, CA), anti–CD57-PE, anti–TCRαβ-PC5 (Immunotech, Marseille, France), anti–perforin-PE, anti–granzyme B-FITC (Hoelzel Diagnostika, Cologne, Germany), anti–CCR7-FITC (R&D Systems, Abingdon, United Kingdom), anti–HLA class I (W6/32), and anti–HLA-A2 (clone BB7-2; American Type Culture Collection, Manassas, VA). FITC-labeled annexin V was purchased from PharMingen. For TCR Vβ-repertoire analysis the IOTest Beta Mark kit (Beckman Coulter) was used. Flow cytometry was performed on a FACSCalibur and data were analyzed with CellQuest (Becton Dickinson).
Complementarity-determining region 3 size analysis of TCR Vβ transcripts
The complementarity-determining region 3 (CDR3) of the polymerase chain reaction (PCR)–amplified TCR Vβ1-24 transcripts was analyzed using a run-off procedure.24 The run-off products were run on an automated sequencer in the presence of fluorescent size markers. The length of DNA fragments and the fluorescence intensity of the bands were analyzed by GENESCAN672 software (Applied Biosystems, Foster City, CA).
Blood samples and preparation of T cells from LN biopsies
Heparinized blood samples were obtained from 20 healthy donors. Peripheral blood mononuclear cells (PBMCs) were isolated by Ficoll density gradient centrifugation. Fresh lymph nodes (LNs) from patients with nonmalignant lymphadenopathy were obtained from the surgery department of the University of Regensburg, Germany. The LNs were mechanically dispersed into single-cell suspensions. PBMCs and cells isolated from the LNs were stained directly with anti-CD3, anti-CD4, anti-CD8, anti-TCRαβ, and anti-TCRγδ mAbs and analyzed by flow cytometry. The study was approved by the University of Regensburg institutional review board. Informed consent was provided according to the Declaration of Helsinki.
Isolation of human T-cell subpopulations, generation of DN T-cell clones, and differentiation of DCs
T cells were isolated from leukapheresis products (obtained from healthy donors after informed consent was given) by Ficoll density gradient centrifugation. DN T cells were pre-enriched (up to 70%) from PBMCs by depletion of CD4+, CD8+, CD14+, CD19+, and CD56+ cells with magnetic cell sorting (Dynabeads; Dynal Biotech, Hamburg, Germany). Cells were then stained with FITC-conjugated anti-CD4, anti-CD8, and Cy-Chrome–conjugated anti-TCRαβ mAbs. The TCRαβ+ DN T cells were sorted by using a cell sorter (FACStar plus; Becton Dickinson). Isolation of CD4+ and CD8+ T cells was performed by flow cytometric sorting. T-cell populations were reanalyzed after cell sorting and showed more than 95% purity. DN T-cell clones were generated by limiting dilution (0.3 and 1 cell/well) in 96-well V-shaped plates in the presence of irradiated allogeneic Epstein-Barr virus (EBV)–transformed B cells (60 Gy, 1.5 × 10⁴ cells/well), PBMCs (35 Gy, 7 × 10⁴ cells/well), and TCGF (2%).
Dendritic cells (DCs) were generated from leukapheresis products as described previously.25 Briefly, monocytes were enriched by counter-current elutriation and then cultured with M′ medium plus 2% autologous serum, supplemented with GM-CSF and IL-4. On day 6, fresh medium containing GM-CSF, IL-4, TNF-α, IL-6, IL-1β, and PGE2 was added to the culture. The culture was continued for an additional 48 hours, and nonadherent cells were harvested and used for the different experiments.
Proliferation assays
To assess proliferation of different T-cell subpopulations, 105 freshly purified DN, CD4+, and CD8+ T cells were cocultured in 96-well U-bottom plates either with 105 irradiated (30 Gy) allogeneic PBMCs in the presence or absence of IL-2 (100 U/mL) or IL-2 alone. Cultures were incubated for 4 days, labeled with 1.0 μCi/well (0.037 MBq) [3H]thymidine for the last 18 hours, and harvested on filter plates (Perkin Elmer, Rodgau-Juegesheim, Germany) and [3H]thymidine incorporation was measured by liquid scintillation counting (Top Count; Perkin Elmer).
Acquisition of MHC molecules from APCs by DN T cells
Sorted DN and CD8+ T cells from HLA-A2- donors were cocultured with mature HLA-A2+ DCs at a ratio of 1:1. At various time points cells were stained with an anti–HLA-A2 mAb (BB7-1). The expression of HLA-A2 on gated DN or CD8+ T cells was analyzed using a flow cytometer. Transwell experiments were performed in Transwell chambers (0.4-μm pore size; Costar-Corning, Acton, MA) on 24-well plates.
Generation of Melan-A–specific CTL lines from PBMCs
Melan-A–specific cytotoxic T lymphocyte (CTL) lines were generated as described previously.25 Briefly, CD8+ T lymphocytes were enriched from PBMCs by magnetically activated cell sorting (MACS; Miltenyi Biotec, Bergisch-Gladbach, Germany). DCs were pulsed with the Melan-A peptide (30 μg/mL) and human β2-microglobulin (10 μg/mL). Then, 2 to 5 × 10⁴ effector cells/well and 5 × 10³ peptide-pulsed autologous DCs/well were cocultured in 96-well U-bottom plates in M′ medium plus 10% human AB serum and 1% to 2% TCGF. After 4 cycles of stimulation, phenotypic and functional analysis of T cells was performed.
Assay for recognition of acquired peptide–MHC class I complexes by Ag-specific CTLs
Freshly purified DN T cells or DN T-cell clones from an HLA-A2- healthy donor (donor A) were cocultured with HLA-A2+ mature DCs (donor B) pulsed with Melan-A or glycoprotein 100 (gp100) (control) peptides overnight (DN/DC ratio, 5:1). DN T cells were then separated from DCs by cell sorting and used as effector cells against Melan-A–specific CTLs generated from donor B either for induction of apoptosis or suppression of proliferation/cytotoxicity of Melan-A–specific CTLs.
Recognition of acquired peptide–MHC complexes on DN T cells by Ag-specific CTLs was analyzed either by the onset of apoptosis of the Melan-A–specific CTLs, measured by combined Melan-A multimer-annexin V or annexin V–propidium iodide (PI; Calbiochem, Bad Soden, Germany) staining on CD8+ T cells or by detection of interferon γ (IFN-γ)–secreting Melan-A–specific CTLs (IFN-γ secretion assay; Miltenyi Biotec).25
For proliferation experiments, 5 × 10⁴ Melan-A–specific CTLs were cocultured in 96-well U-bottom plates either with 5 × 10⁴ irradiated (30 Gy) Melan-A–primed DN T cells or Melan-A–pulsed DCs. Cultures were incubated for 24 hours and labeled with 1.0 μCi/well (0.037 MBq) [3H]thymidine for the last 18 hours. The cytotoxic activity of Melan-A–specific CTLs was measured by a conventional 4-hour 51Cr-release assay as described.25
Detection of secreted cytokines by DN T cells
Supernatants of DN T cells stimulated for 12, 24, and 48 hours either polyclonally with plate-bound anti-CD3 (100 ng/mL, OKT3; Ortho Biotech, Neuss, Germany) and anti-CD28 (100 ng/mL, CD28.2; Becton Dickinson) mAbs or with allogeneic mature DCs were analyzed simultaneously for IL-2, IL-4, IL-5, IL-10, and IFN-γ secretion using the human Th1/Th2 cytokine cytometric bead array kit (PharMingen, San Diego, CA).
Analysis of TRECs by QRT-PCR
High-molecular-weight DNA was extracted from the encoded samples of sorted T cells using the QIAamp DNA mini kit (Qiagen, Hilden, Germany). The number of T-cell receptor excision circles (TRECs) was determined by quantitative real-time PCR (QRT-PCR) using the ABI PRISM 7700 Sequence Detector TaqMan (Applied Biosystems, Foster City, CA) as described previously.26
Results
Frequencies of TCRαβ+ CD3+ CD4-CD8- DN T cells in the peripheral blood and LNs of healthy adults
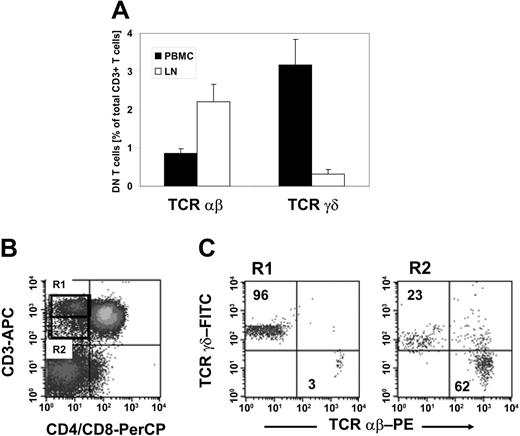
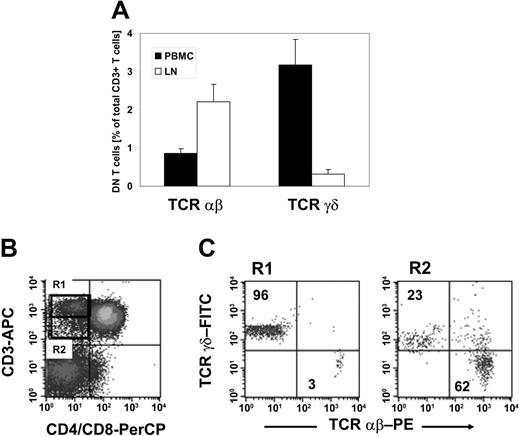
To validate if DN Treg cells that exhibit similar functional properties to those found in mice12 are naturally present in humans, we first examined whether mature DN T cells exist in humans. PBMCs were collected from 20 healthy donors and stained with anti-CD3, anti-CD4, anti-CD8, anti-TCRαβ, and anti-TCRγδ mAbs. We observed a resident population of DN T cells that represented 4.1% (range, 1.9%-7.7%) of CD3+ T cells. Further classification of the DN T-cell pool with regard to the TCRαβ or TCRγδ chain expression revealed a predominant population of TCRγδ+ T cells representing on average 3.2% (range, 2.1%-3.6%) as compared to 0.9% (range, 0.4%-1.9%) TCRαβ+ T cells within CD3+ T cells (Figure 1A). In contrast, analysis of the DN T-cell pool of nonmalignant LNs (n = 5) demonstrated a predominance of TCRαβ+ T cells representing on average 2.2% as compared to 0.3% TCRγδ+ T cells within CD3+ T cells (Figure 1A).
TCRαβ+ DN T cells in healthy individuals. Lymphocytes isolated either from PBMCs or LNs of healthy donors were stained with anti–CD3-allophycocyanin (APC), anti–CD4-peridinin chlorophyll protein (PerCP), anti–CD8-PerCP, and anti–TCRαβ-PE or anti–TCRγδ-FITC mAbs and analyzed by flow cytometry. The cells were gated on DN T lymphocytes via their forward and side scatter properties and their CD3+, CD4-, and CD8- expression profile. (A) Results represent mean percentages (± SD) of TCRαβ+ and TCRγδ+ DN T cells within total CD3+ T cells isolated either from peripheral blood (▪) or LNs (□). (B-C) CD3+ CD4-CD8- DN T cells from peripheral blood lymphocytes can be separated in CD3high TCRγδ and CD3intermediate TCRαβ T cells. (B) The dot plots show staining with APC-conjugated anti-CD3 mAb and PerCP-conjugated anti-CD4/CD8 mAb. The region R1 indicates the population of CD3high DN T cells; the region R2 shows CD3intermediate T cells. (C) Dot plots show staining for anti-TCRαβ or anti-TCRγδ mAbs for cells of R1 (left plot) and R2 (right plot). Numbers in the upper left and lower right quadrants represent percentages of TCRαβ+ and TCRγδ+ cells within CD3+ DN T cells, respectively. One set of representative results of 20 healthy donors is shown.
TCRαβ+ DN T cells in healthy individuals. Lymphocytes isolated either from PBMCs or LNs of healthy donors were stained with anti–CD3-allophycocyanin (APC), anti–CD4-peridinin chlorophyll protein (PerCP), anti–CD8-PerCP, and anti–TCRαβ-PE or anti–TCRγδ-FITC mAbs and analyzed by flow cytometry. The cells were gated on DN T lymphocytes via their forward and side scatter properties and their CD3+, CD4-, and CD8- expression profile. (A) Results represent mean percentages (± SD) of TCRαβ+ and TCRγδ+ DN T cells within total CD3+ T cells isolated either from peripheral blood (▪) or LNs (□). (B-C) CD3+ CD4-CD8- DN T cells from peripheral blood lymphocytes can be separated in CD3high TCRγδ and CD3intermediate TCRαβ T cells. (B) The dot plots show staining with APC-conjugated anti-CD3 mAb and PerCP-conjugated anti-CD4/CD8 mAb. The region R1 indicates the population of CD3high DN T cells; the region R2 shows CD3intermediate T cells. (C) Dot plots show staining for anti-TCRαβ or anti-TCRγδ mAbs for cells of R1 (left plot) and R2 (right plot). Numbers in the upper left and lower right quadrants represent percentages of TCRαβ+ and TCRγδ+ cells within CD3+ DN T cells, respectively. One set of representative results of 20 healthy donors is shown.
As shown in Figure 1B-C, TCRαβ+ DN T cells showed a slightly lower CD3 expression level than TCRγδ+ DN T cells, which allowed the separation of CD3high TCRγδ+ and CD3intermediate TCRαβ+ DN T cells (Figure 1B-C). Human γδ T cells have been shown to express a higher TCR/CD3 complex density than αβ T cells.27 Comparative analysis of the expression of the TCR/CD3 complex on TCRαβ+ DN T cells with TCRαβ+ CD4+CD8+ T cells revealed a similar density (data not shown), suggesting that DN T cells are not composed of low TCR-affinity T cells.
Together, TCRαβ+ DN T cells comprised 1% to 2% of total CD3+ T cells in the blood and LNs of healthy donors, which is comparable to that seen in normal mice.4
Phenotypic analysis of TCRαβ+ DN T cells
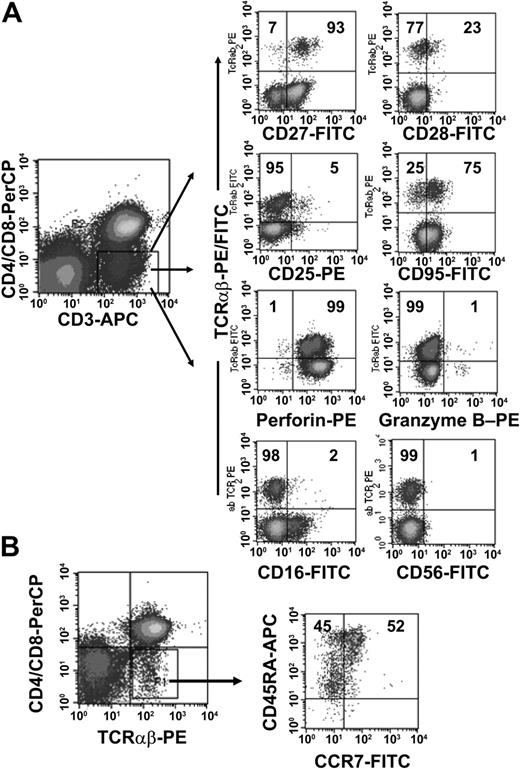
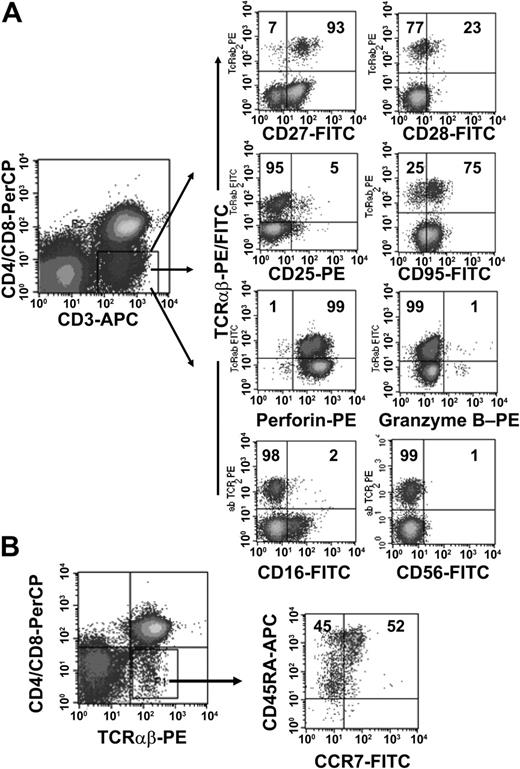
To further characterize the phenotype of the TCRαβ+ DN T-cell population we obtained PBMCs from 10 healthy donors and analyzed the expression of CD16, CD25, CD27, CD28, CD45RA, CD56, CD57, CD69, CD95, CCR7, and CTL antigen 4 (CTLA-4) on the DN cell population. As shown in Figure 2B, TCRαβ+ DN T cells consisted of both CD45RAbrightCCR7+ naïve cells and Ag-experienced cells with a CD45RAlowCCR7- phenotype.28 The majority of TCRαβ+ DN T cells were in the intermediate (CD27+CD28-) maturation stage,29,30 highly expressed CD95, but were negative for activation markers such as CD25 and CD69 (Figure 2A and data not shown). We also analyzed the intracellular expression of perforin and granzyme B, 2 effector molecules in cytolytic activity.31 The majority of the DN T cells expressed perforin but not granzyme B (Figure 2A). Furthermore, DN T cells were negative for natural killer (NK) cell markers such as CD16 and CD56 (Figure 2A) and lacked CTLA-4 expression (data not shown).
Phenotypic analyses of freshly isolated peripheral TCRαβ+ DN T cells. PBMCs from healthy donors were stained with anti–CD3-APC, anti–CD4-PerCP, anti–CD8-PerCP, and anti–TCRαβ mAbs and combinations of mAbs against surface Ag and intracellular proteins. (A) Cells were gated for CD3+ CD4-CD8- DN T cells. The right 8 dot plots show staining with FITC/PE-conjugated anti-TCRαβ+ mAbs and FITC/PE-conjugated mAbs against CD27, CD28, CD25, CD95, CD16, CD56, and intracellular proteins (granzyme B, perforin). (B) CCR7/CD45RA phenotype of TCRαβ+ DN T cells. Numbers in the quadrants are the percentages of TCRαβ+ DN T cells with the corresponding phenotype. Representative data from one of 10 healthy donors are shown.
Phenotypic analyses of freshly isolated peripheral TCRαβ+ DN T cells. PBMCs from healthy donors were stained with anti–CD3-APC, anti–CD4-PerCP, anti–CD8-PerCP, and anti–TCRαβ mAbs and combinations of mAbs against surface Ag and intracellular proteins. (A) Cells were gated for CD3+ CD4-CD8- DN T cells. The right 8 dot plots show staining with FITC/PE-conjugated anti-TCRαβ+ mAbs and FITC/PE-conjugated mAbs against CD27, CD28, CD25, CD95, CD16, CD56, and intracellular proteins (granzyme B, perforin). (B) CCR7/CD45RA phenotype of TCRαβ+ DN T cells. Numbers in the quadrants are the percentages of TCRαβ+ DN T cells with the corresponding phenotype. Representative data from one of 10 healthy donors are shown.
Purification of DN T cells via magnetic beads and flow cytometric sorting and TCR Vβ repertoire of purified DN T cells
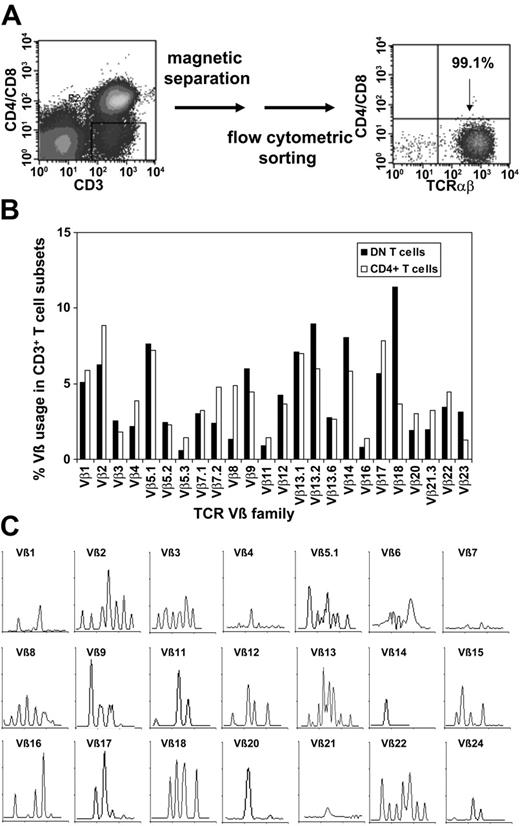
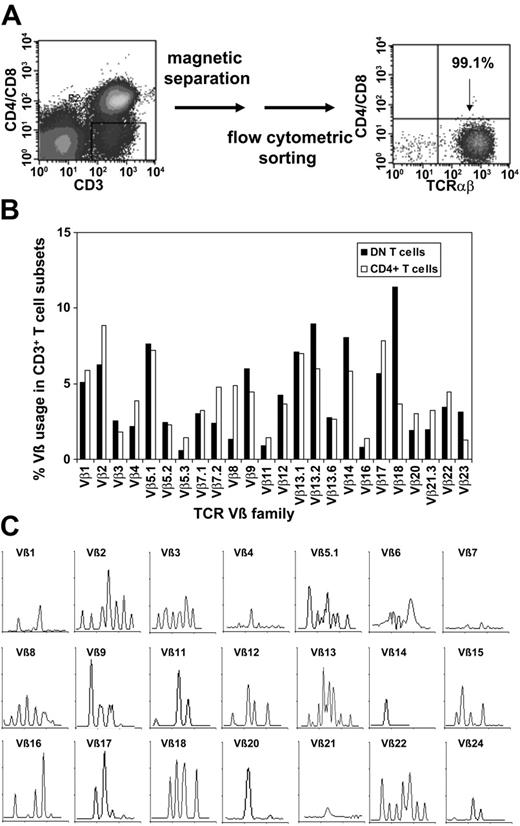
To purify TCRαβ+ DN T cells, we used a magnetic depletion system to eliminate CD4+, CD8+, CD14+, CD19+, and CD56+ cells, as well as flow cytometric sorting with anti-TCRαβ, anti-CD4, and anti-CD8 mAbs (Figure 3A) and were able to obtain more than 95% pure populations of DN T cells (Figure 3A). To assess whether or not the DN T cells consist of polyclonal or clonally amplified T cells, analysis of TCR Vβ gene segment usage was performed on sorted DN and CD4+ T cells from 5 healthy donors. As shown in Figure 3B for a representative donor, TCR Vβ usage in DN and CD4+ T cells was similar. Molecular analysis of CDR3 distribution of the TCRVβ families in sorted DN cells revealed a polyclonal pattern for most Vβ subfamilies (Figure 3C). However, the molecular pattern was not gaussian as was expected for CD4+ T cells, which might be relevant in the context of Ag specificity of the DN T-cell subset.
Purification of TCRαβ+ DN T cells via magnetic beads and flow cytometric sorting and TCR Vβ repertoire of purified DN T cells. (A) Purification of TCRαβ+ DN T cells using a Dynabeads-based depletion system to eliminate CD4+, CD8+, CD14+, CD19+, and CD56+ cells, as well as flow cytometric sorting with anti-TCRαβ, anti-CD4, and anti-CD8 mAbs. (B) Comparative analysis of the TCR Vβ repertoire of purified DN and CD4+ T cells. (C) Total RNA from sorted DN T cells was extracted, reverse transcribed, and amplified by reverse transcription-PCR (RT-PCR) using Vβ primers. Amplified cDNA was copied with a fluorescent Cβ primer in a run-off reaction and subjected to electrophoresis on an automated sequencer. The patterns obtained show the size in amino acids of the CDR3 region (x-axis) and the relative fluorescence intensity (y-axis) of in-frame Vβ-Cβ amplification products.
Purification of TCRαβ+ DN T cells via magnetic beads and flow cytometric sorting and TCR Vβ repertoire of purified DN T cells. (A) Purification of TCRαβ+ DN T cells using a Dynabeads-based depletion system to eliminate CD4+, CD8+, CD14+, CD19+, and CD56+ cells, as well as flow cytometric sorting with anti-TCRαβ, anti-CD4, and anti-CD8 mAbs. (B) Comparative analysis of the TCR Vβ repertoire of purified DN and CD4+ T cells. (C) Total RNA from sorted DN T cells was extracted, reverse transcribed, and amplified by reverse transcription-PCR (RT-PCR) using Vβ primers. Amplified cDNA was copied with a fluorescent Cβ primer in a run-off reaction and subjected to electrophoresis on an automated sequencer. The patterns obtained show the size in amino acids of the CDR3 region (x-axis) and the relative fluorescence intensity (y-axis) of in-frame Vβ-Cβ amplification products.
Cytokine profile and proliferation of DN T cells
Next we analyzed the cytokine profiles of sorted DN and CD4+ T cells after stimulation with either allogeneic mature DCs or with plate-bound anti-CD3/anti-CD28 mAbs. CD4+ T cells stimulated with allogeneic DCs revealed the classical Th1 cytokine profile with high production of IFN-γ and IL-2 but no production of IL-4 or IL-10 (Figure 4A). In contrast, DN T cells secreted 3 to 4 times more IFN-γ but no IL-2, with some IL-5, and marginal levels of IL-4 and IL-10 (Figure 4A). No IL-2 production in DN T cells could be detected at earlier time points (12 and 24 hours) after allogeneic stimulation (data not shown). Similar results were obtained after stimulation with anti-CD3/CD28 mAbs (data not shown). This cytokine profile is similar to that seen in mouse DN Treg cells.
Cytokine secretion and proliferation after allogeneic stimulation of highly purified peripheral T-cell subsets from healthy adults. (A) Cytokine profile of purified DN (▪) and CD4+ (□) T cells stimulated with allogeneic mature DCs for 48 hours. A representative result (± SD) of 3 independent experiments is shown. (B) Sorted DN (▪), CD4+ (□), and CD8+ T cells (▦) were stimulated with irradiated allogeneic PBMCs in the presence or absence of IL-2 (100 U/mL) or IL-2 alone. [3H]TdR incorporation was measured after 4 days of culture. Bars represent the means (± SD) of triplicate cultures. Data represents one of 3 experiments with similar results using cells from 3 different donors.
Cytokine secretion and proliferation after allogeneic stimulation of highly purified peripheral T-cell subsets from healthy adults. (A) Cytokine profile of purified DN (▪) and CD4+ (□) T cells stimulated with allogeneic mature DCs for 48 hours. A representative result (± SD) of 3 independent experiments is shown. (B) Sorted DN (▪), CD4+ (□), and CD8+ T cells (▦) were stimulated with irradiated allogeneic PBMCs in the presence or absence of IL-2 (100 U/mL) or IL-2 alone. [3H]TdR incorporation was measured after 4 days of culture. Bars represent the means (± SD) of triplicate cultures. Data represents one of 3 experiments with similar results using cells from 3 different donors.
A low proliferative potential has been shown to be characteristic of Treg cells, such as CD4+CD25+ Treg cells.32-34 To analyze the proliferative capacity of human DN, CD4+, and CD8+ T cells, cells were sorted and stimulated in vitro. As shown in Figure 4B, DN T cells exhibited a strong proliferative response on stimulation with allogeneic PBMCs, similar to CD4+ and CD8+ T cells. Proliferation of the T-cell subpopulations could be further enhanced by the addition of IL-2, whereas stimulation with IL-2 alone only had a marginal effect.
Peripheral DN T cells have a long proliferative history
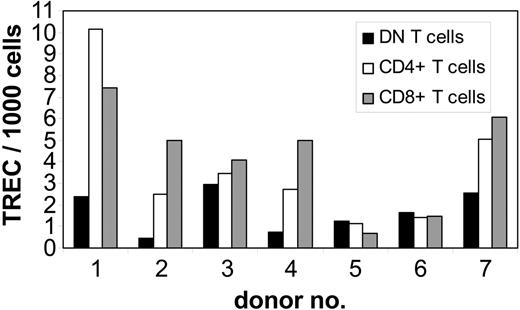
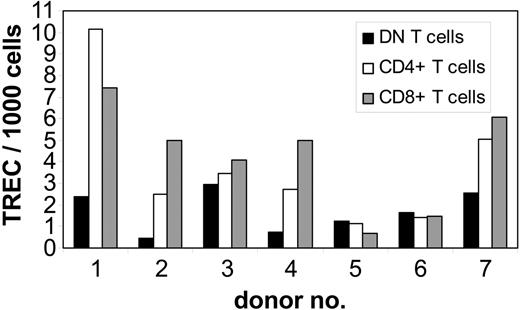
To study whether DN T cells are derived from the same intrathymic maturation pathway as CD4+ and CD8+ T cells, we performed QRT-PCR analysis of TREC numbers, as a marker for recent thymic emigrants, in purified DN T cells from 7 healthy adult donors. As controls, autologous purified CD4+ and CD8+ T cells were also analyzed for TREC numbers. In 4 of 7 donors the TREC numbers in DN T cells were 2 to 6 times lower than that in CD8+ and CD4+ T cells, whereas in the other 3 individuals the TREC numbers were comparable in all T-cell subpopulations (Figure 5). No differences in TREC numbers were observed between the CD4+ and CD8+ subsets (Figure 5). As found in studies done by us and others,35,36 marked interindividual variability indicates that the analysis of differences in TREC numbers among cell subsets is more informative when compared within the same individual as opposed to the analysis of the absolute TREC counts. The TREC counts decrease logarithmically with each cell division; therefore, the difference in the number of cell divisions between 2 T-cell subsets can be calculated using the formula N1 - N2 = log2(T1 - T2), where N is the number of cell divisions and T the TREC content. Comparison of proliferation rates of analyzed T-cell subsets revealed a 1- to 4-times higher number of cell divisions for DN T cells than for CD4+ and CD8+ cells in 4 of 7 donors (data not shown). However, in 3 donors no significant difference (< 1 division) was observed. These results indicate that DN T cells are not recent thymic emigrants but rather an expanded T-cell subset.
Quantification of TREC content in highly purified peripheral T-cell subsets from healthy adults. gDNA of sorted subpopulations from 7 healthy adults was isolated from freshly isolated DN (▪), CD4+ (□), and CD8+ (▦) T cells and the number of TRECs was determined by QRT-PCR. TREC counts per 1000 cells in individual samples; 1-7 indicate the number of the individual healthy donor.
Quantification of TREC content in highly purified peripheral T-cell subsets from healthy adults. gDNA of sorted subpopulations from 7 healthy adults was isolated from freshly isolated DN (▪), CD4+ (□), and CD8+ (▦) T cells and the number of TRECs was determined by QRT-PCR. TREC counts per 1000 cells in individual samples; 1-7 indicate the number of the individual healthy donor.
Transfer of peptide-MHC molecules from APCs to DN T cells
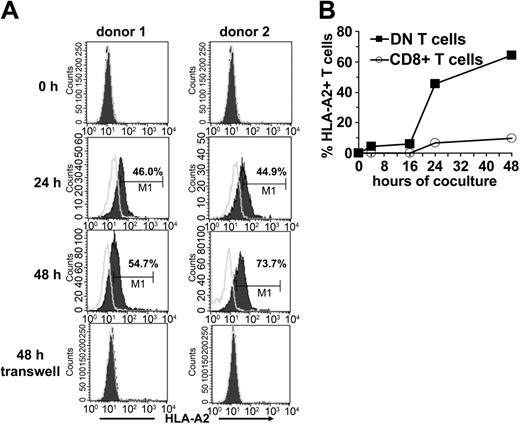
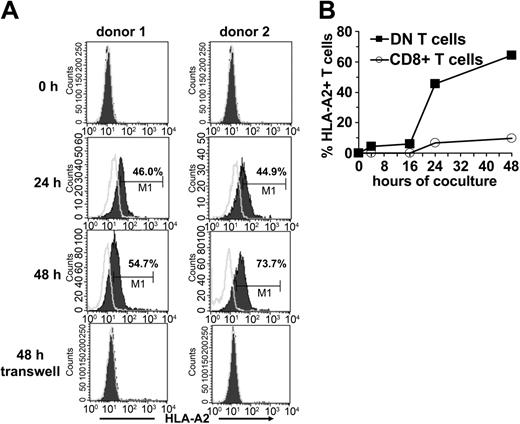
Because one of the important characteristics of DN Treg cells in mice is their ability to acquire allogeneic MHC molecules from APCs,12 we examined whether the same was true for human DN T cells. Sorted DN and CD8+ T cells from an HLA-A2- individual were incubated with HLA-A2+ DCs. Acquisition and expression of HLA-A2 molecules on gated DN and CD8+ T cells was monitored by flow cytometry. A proportion of DN T cells started to express surface HLA-A2 as early as 2 hours following incubation with HLA-A2+ DCs (data not shown). The mean fluorescence intensity of HLA-A2 on DN T cells increased steadily between 24 and 48 hours (Figure 6A-B). Contrary to DN T cells, only a small proportion of CD8+ T cells expressed HLA-A2 after incubation with DCs (Figure 6B). The acquisition of these molecules seems to be an accumulative process because it correlates with the duration of coincubation with APCs. Comparative analysis of different APC subsets demonstrated that mature DCs are much more potent peptide-MHC donors than immature DCs and monocytes (data not shown).
Transfer of HLA-A2 molecules from HLA-A2+ DCs to HLA-A2-DN and CD8+ T-cells. FACS-sorted DN and CD8+ T cells from an HLA-A2- donor were cocultured with mature HLA-A2+ DCs at a ratio of 1:1. At indicated time points cells were harvested and analyzed for the expression of HLA-A2 on forward/side scatter (FSC/SSC)–gated lymphocytes. (A) Histograms show the kinetics (before, 24 hours, and 48 hours after coculture) of HLA-A2 expression (solid lines) on DN T cells from 2 healthy donors (left column, donor no. 1; right column, donor no. 2) after coculture or in a transwell system. Open lines indicate isotype control. (B) Percentage of HLA-A2+ DN (▪) and CD8+ T cells (○) from HLA-A2- donors at different time points of coincubation with HLA-A2+ DCs are shown.
Transfer of HLA-A2 molecules from HLA-A2+ DCs to HLA-A2-DN and CD8+ T-cells. FACS-sorted DN and CD8+ T cells from an HLA-A2- donor were cocultured with mature HLA-A2+ DCs at a ratio of 1:1. At indicated time points cells were harvested and analyzed for the expression of HLA-A2 on forward/side scatter (FSC/SSC)–gated lymphocytes. (A) Histograms show the kinetics (before, 24 hours, and 48 hours after coculture) of HLA-A2 expression (solid lines) on DN T cells from 2 healthy donors (left column, donor no. 1; right column, donor no. 2) after coculture or in a transwell system. Open lines indicate isotype control. (B) Percentage of HLA-A2+ DN (▪) and CD8+ T cells (○) from HLA-A2- donors at different time points of coincubation with HLA-A2+ DCs are shown.
To define the transfer of peptide-MHC molecules in more detail, we next asked if the transfer requires cell-to-cell contact. When HLA-A2- DN T cells were cocultured with HLA-A2+ DCs in a transwell system to prevent direct cell-to-cell contact but maintain diffusion of secreted soluble factors, no MHC transfer was observed (Figure 6A). These results demonstrate that the acquisition of MHC molecules by DN T cells requires cell-to-cell contact.
The ability of DN T cells to present the acquired HLA-A2–Melan-A complexes to Melan-A–specific CTLs could be demonstrated by the specific IFN-γ secretion of Melan-A–specific CTLs on coculture of both T-cell subsets (data not shown).
Peptide-MHC complexes that are acquired by DN T cells induce apoptosis and suppress proliferation of Ag-specific CTLs
Murine data have demonstrated that DN Treg cells can present acquired allo-Ag to activated CD8+ T cells and subsequently send death signals to CD8+ T cells.12 To determine whether the presentation of acquired peptide-MHC complexes by human DN T cells would have a similar effect, we tested the activity of DN Treg cells through their ability to induce apoptosis of Ag-specific CTLs. Sorted DN Treg cells or DN T-cell clones from an HLA-A2- donor were cocultured overnight with allogeneic mature HLA-A2+ DCs that had been pulsed with the HLA-A2–binding peptides Melan-A or glycoprotein 100 (gp100) as a control, respectively. DN T cells were then separated from the cocultures by cell sorting and used as effector cells against Melan-A–specific CTLs. As shown in Figure 7A, staining with annexin V revealed a marked increase in the fraction of Melan-A–specific CTLs undergoing apoptosis when in the presence of Melan-A–primed DN T cells. At a suppressor-to-target cell ratio of 1:1, 68% of total CD8+ T cells became positive for annexin V when cocultured with Melan-A–primed DN T cells as compared to 29% annexin V+ T cells cocultured with gp100-primed DN T cells. Interestingly, we found a down-regulation of Melan-A multimer staining on specific interaction between DN T cells and Melan-A–specific CTLs (Figure 7A left panels), which has been shown to provide indirect evidence for the specificity of the peptide-MHC/TCR interaction.25,37 Calculation of the percentage of apoptotic cells (annexin V/PI staining) demonstrated that 63% of total CD8+ T cells underwent apoptosis at a suppressor-to-target ratio of 5:1 as compared to 12% of CD8+ T cells in the presence of gp100-specific DN T cells (Figure 7B).
Peptide-MHC complexes acquired by DN Treg cells induce apoptosis and suppress proliferation of Ag-specific CTLs. DN T cells from an HLA-A2- donor (donor A) were cocultured with HLA-A2+ mature DCs (donor B) pulsed with either Melan-A or gp100 (control) peptides overnight. DN T cells were then separated from DCs by cell sorting and used as effector cells against Melan-A–specific CTLs generated from donor B. Induction of apoptosis of Melan-A–specific T cells was measured by combined Melan-A–multimer, annexin V, and PI staining on CD8-gated T cells. (A) Dot plot of annexin V-FITC/Melan-A multimer staining of CD3+CD8+-gated Melan-A–specific CTLs after 4 hours of coincubation with DN T cells stimulated either with Melan-A–pulsed DCs (left panel) or gp100-pulsed DCs (right panel) at different E/T ratios from 0 to 5:1. Numbers in the cross represent percentages of cells in the different quadrants within CD8+ T cells. One of 3 independent experiments is shown. (B) Percentage of different apoptotic target cell subpopulations (▪, DN-A2–Melan-A; ○, DN-A2–gp100) calculated from annexin V/PI staining. (C) Melan-A–specific CTL (CTLresp) were cultured either with peptide-pulsed DCs or Melan-A–primed or unprimed DN T cells at a ratio of 1:1. [3H]TdR incorporation was measured after 24 hours of culture. Panels show one of at least 3 different experiments; bars represent the means (± SD) of triplicate wells.
Peptide-MHC complexes acquired by DN Treg cells induce apoptosis and suppress proliferation of Ag-specific CTLs. DN T cells from an HLA-A2- donor (donor A) were cocultured with HLA-A2+ mature DCs (donor B) pulsed with either Melan-A or gp100 (control) peptides overnight. DN T cells were then separated from DCs by cell sorting and used as effector cells against Melan-A–specific CTLs generated from donor B. Induction of apoptosis of Melan-A–specific T cells was measured by combined Melan-A–multimer, annexin V, and PI staining on CD8-gated T cells. (A) Dot plot of annexin V-FITC/Melan-A multimer staining of CD3+CD8+-gated Melan-A–specific CTLs after 4 hours of coincubation with DN T cells stimulated either with Melan-A–pulsed DCs (left panel) or gp100-pulsed DCs (right panel) at different E/T ratios from 0 to 5:1. Numbers in the cross represent percentages of cells in the different quadrants within CD8+ T cells. One of 3 independent experiments is shown. (B) Percentage of different apoptotic target cell subpopulations (▪, DN-A2–Melan-A; ○, DN-A2–gp100) calculated from annexin V/PI staining. (C) Melan-A–specific CTL (CTLresp) were cultured either with peptide-pulsed DCs or Melan-A–primed or unprimed DN T cells at a ratio of 1:1. [3H]TdR incorporation was measured after 24 hours of culture. Panels show one of at least 3 different experiments; bars represent the means (± SD) of triplicate wells.
In a next step we asked whether DN T cells that had acquired the Melan-A–HLA-A2 complexes from DCs were also able to inhibit the proliferation of Melan-A–specific CTLs. Activated Melan-A–specific responder CTLs, in contrast to irradiated (30 Gy) DN T cells, showed a vigorous proliferative response that could be further enhanced by restimulation with Melan-A–pulsed APCs (Figure 7C). Proliferation of Melan-A–specific CTLs was inhibited up to 50% at a 1:1 ratio on coculture with Melan-A–primed DN T cells.
We next asked whether DN T cells can inhibit the cytotoxic activity of Melan-A–specific CTLs against HLA-A2+ Melan-A–expressing target cells. Cytotoxicity of Melan-A–specific CTLs against Melan-A–expressing target cells (effector-target [E/T] ratio, 1:1) was not significantly inhibited on coculture with Melan-A–primed DN T cells (data not shown). However, quantification of the suppressive activity of Treg cells with the 51Cr-release assay is critical because of its low sensitivity.
Taken together, our findings indicate that similar to DN Treg cells identified in mice, TCRαβ+ DN T cells also exist in humans, are able to acquire allo-Ag from APCs, induce apoptosis, and suppress proliferation of Ag-specific CTLs.
Discussion
Treg cells, also referred to as suppressor T cells, have been implicated as important mediators of immune tolerance. It is now clear that Treg cells consist of many distinct T-cell subsets, including CD4+CD25+, Tr1, Th3, CD8+, TCRγδ+, and TCRαβ+ DN cells. Based on in vitro studies, several mechanisms have been implicated in Treg cell-mediated suppression. For instance, CD4+CD25+ Treg cell-mediated suppression appears to act by inhibiting IL-2 gene transcription and IL-2 production in the responder cells, which can be reversed by the addition of exogenous IL-2.38,39 Some Treg cells, including, Tr1, Th3, and γδ-TCR+ cells can suppress immune responses through the secretion of cytokines, such as transforming growth factor β (TGF-β), IL-10, and IL-4, which may modify costimulatory molecule expression on T cells or APCs.5,40 Other Treg cells, such as NKT cells, and possibly subtypes of CD4+ Treg cells, have been shown to suppress immune responses through a nonspecific cytotoxic mechanism. Competition with Ag-specific T cells for local IL-2 or surface area on APCs is yet another mechanism that may be involved in Treg cell-mediated suppression.13,41
Treg cells have been shown to down-regulate immune responses in various disease models. DN Treg cells have been found to be able to prevent the rejection of skin and heart allografts by specifically inhibiting CD8+ T cells that carry antigraft TCR specificity.12 Here we demonstrate that human DN T cells that previously had been considered to represent extrathymically differentiated T cells42 in fact appear to be the human counterpart of the DN Treg cells that have been studied in mice. We were able to isolate the DN Treg cells from PBMCs of adult healthy volunteers in sizable quantities (about 1% of total CD3+ T cells). Furthermore, we show that TCRαβ+ DN T cells consist of both naïve and Ag-experienced T cells. This is confirmed by quantitative TREC analysis, revealing lower (more cell divisions) or similar TREC counts in the DN Treg subset as compared to CD4+ and CD8+ T cells.36 Together, our data indicate that the DN Treg cells are not recent thymic emigrants and in 3 of 7 healthy donors even have a longer proliferative history than either CD4+ or CD8+ T cells.
The cytokine profile of human DN Treg cells appears to be identical to the murine counterpart possessing a unique array that differs from Th1, Th2, or Th3/Tr1 cells.43,44 Others have described either a similar18 or a Th1 or Th2-like phenotype of DN T cells.15,45 In contrast to other Treg cells,32 DN Treg cells showed a marked proliferation in response to allogeneic mononuclear cells (MNCs). Unlike other Treg cells, DN Treg cell–mediated suppression is Ag-specific. Similar to murine DN T cells12 human DN Treg cells lack CTLA-4 expression, suggesting that they do not perform their suppressive function through this pathway but through other mechanisms that involve cell-to-cell contact. Zhang et al12 have identified a unique mechanism by which DN Treg cells mediate Ag-specific suppression of syngeneic responder cells. They have shown that murine DN Treg cells can use their TCR to acquire allo-MHC peptides from APCs, and then use them to specifically trap and kill CD4+ or CD8+ T cells that recognize the same allo-MHC peptides through a process that requires cell contact and Fas/FasL interaction.12,20 There have been several descriptions of the transfer of molecules, including MHC molecules, from APCs to T cells. It has been demonstrated that CD4+ T cells can directly acquire peptide-MHC class II complexes from APCs.46-48 Furthermore, such acquired peptide-MHC complexes appeared to be functional because T cells became hyporesponsive and apoptotic after interaction with neighboring T cells following the acquisition of peptide-MHC class II complexes.48 In addition, Huang et al49 reported that CD8+ T cells can also acquire peptide-MHC class I complexes through TCR-mediated endocytosis. During this process those CD8+ T cells were sensitized to peptide-specific lysis by neighboring CD8+ T cells, which then killed each other.49
Like their murine counterparts human DN Treg cells are also able to acquire peptide-MHC class I complexes from APCs. The mechanism is unclear; however, our data clearly indicate that it requires cell contact. Of interest, the acquisition of peptide-MHC molecules on DN Treg cells seems to be an accumulative process: CD8+ T cells maintained the expression of acquired MHC molecules for only 2 hours,49 in contrast to DN Treg cells on which acquired allo-MHC molecules could be detected for longer than 48 hours. The fact that human DN T cells use the acquired peptide-MHC complexes to induce apoptosis and suppress the proliferative activity of Ag-specific CTLs recognizing the cognate peptide, but not controls, suggests the involvement of specific Ag recognition during suppression. This is in contrast to other Treg cells; although CD4+CD25+ Treg cells require activation via the TCR to exert their regulatory function, once activated their suppressive activity is Ag nonspecific.50 Moreover, it indicates that DN T cell-mediated suppression is neither due to competition with CD8+ T cells for the surface area on APCs nor for growth factors. If human DN Treg cells use a similar molecular pathway to control immune responses as their murine counterpart, it has to be defined in further studies.
Studies on the in vivo role of human DN T cells in regulating immune responses are limited. It is well known that Treg cells also play an important role in preventing autoimmune diseases.4-6 Various studies have shown that autoimmune diseases develop because of a lack of or a malfunction of Treg cells.1,2,7,9 Interestingly, several murine and human autoimmune disease phenotypes show an increase in the percentage of DN T cells within the T-cell population (summarized by Reimann15 ). For example, DN T cells are present at unusually high frequency and produce IL-4 and IFN-γ in patients with systemic lupus erythematosus.51 In autoimmune lymphoproliferative syndrome (ALPS) type Ia, patients have an accumulation of TCRαβ+ DN T cells in the periphery as a result of inherited defects in apoptosis.52,53 Recently, somatic Fas mutations were detected in DN T cells from patients with ALPS.54
The function and ontogeny of DN T cells in autoimmune diseases have remained elusive. However, our data indicate that DN T cells may be increased in some autoimmune diseases in an attempt to control autoreactive effector cells.
In summary, a new subset of human Treg cells that down-regulate Ag-specific immune responses in vitro was identified. The identification and characterization of human DN Treg cells will allow for their monitoring in various disease states and may have important implications for understanding and treating autoimmunity and graft rejection.
Prepublished online as Blood First Edition Paper, November 30, 2004; DOI 10.1182/blood-2004-07-2583.
Supported by the Deutsche Forschungsgemeinschaft (DFG) (MA 1351/5-1), Alfried Krupp von Bohlen und Halbach Stiftung (G.K.P and C.A.S.), and the Committee for Scientific Research, Poland (KBN 2P05A 05726; G.K.P.).
The publication costs of this article were defrayed in part by page charge payment. Therefore, and solely to indicate this fact, this article is hereby marked “advertisement” in accordance with 18 U.S.C. section 1734.
We thank Ms Sandra Vogl, Annegret Rehm, and Jeanette Bahr for excellent technical assistance and Petra Hoffmann for her critical reading of the manuscript.

![Figure 4. Cytokine secretion and proliferation after allogeneic stimulation of highly purified peripheral T-cell subsets from healthy adults. (A) Cytokine profile of purified DN (▪) and CD4+ (□) T cells stimulated with allogeneic mature DCs for 48 hours. A representative result (± SD) of 3 independent experiments is shown. (B) Sorted DN (▪), CD4+ (□), and CD8+ T cells (▦) were stimulated with irradiated allogeneic PBMCs in the presence or absence of IL-2 (100 U/mL) or IL-2 alone. [3H]TdR incorporation was measured after 4 days of culture. Bars represent the means (± SD) of triplicate cultures. Data represents one of 3 experiments with similar results using cells from 3 different donors.](https://ash.silverchair-cdn.com/ash/content_public/journal/blood/105/7/10.1182_blood-2004-07-2583/6/m_zh80070576350004.jpeg?Expires=1767993718&Signature=weRMvLbY095~XjV7Zm-duHoffIuQKhR5BzXbgcM4U-5Gy2cvXkzJI4TAumB5i8agUcIsvNfsR1Zil92ke0-d5AMhXLK7ig1pgMvsomXh5nJY37uhsO4wGt~UD8cQ62IcO1jTRe1cWdAbXWiXoG6GSvKmgBU9z5c4wtSi~4Mwy2p3LooR0cPdFXFaMOd5cflScb5AoZTB-eK6nJfZrugVoOMpoEQpvl-b1qLB0qgXpF3BpXEcKdCFEw9nYQGMU8794BV6qdG61LhSV2u9qXuo4rsjWY8SliU1N9IFwuTk8hkLKH-TE~q0KS9ARieovgxF3A5urWRtigXlsc417mtMZg__&Key-Pair-Id=APKAIE5G5CRDK6RD3PGA)
![Figure 7. Peptide-MHC complexes acquired by DN Treg cells induce apoptosis and suppress proliferation of Ag-specific CTLs. DN T cells from an HLA-A2- donor (donor A) were cocultured with HLA-A2+ mature DCs (donor B) pulsed with either Melan-A or gp100 (control) peptides overnight. DN T cells were then separated from DCs by cell sorting and used as effector cells against Melan-A–specific CTLs generated from donor B. Induction of apoptosis of Melan-A–specific T cells was measured by combined Melan-A–multimer, annexin V, and PI staining on CD8-gated T cells. (A) Dot plot of annexin V-FITC/Melan-A multimer staining of CD3+CD8+-gated Melan-A–specific CTLs after 4 hours of coincubation with DN T cells stimulated either with Melan-A–pulsed DCs (left panel) or gp100-pulsed DCs (right panel) at different E/T ratios from 0 to 5:1. Numbers in the cross represent percentages of cells in the different quadrants within CD8+ T cells. One of 3 independent experiments is shown. (B) Percentage of different apoptotic target cell subpopulations (▪, DN-A2–Melan-A; ○, DN-A2–gp100) calculated from annexin V/PI staining. (C) Melan-A–specific CTL (CTLresp) were cultured either with peptide-pulsed DCs or Melan-A–primed or unprimed DN T cells at a ratio of 1:1. [3H]TdR incorporation was measured after 24 hours of culture. Panels show one of at least 3 different experiments; bars represent the means (± SD) of triplicate wells.](https://ash.silverchair-cdn.com/ash/content_public/journal/blood/105/7/10.1182_blood-2004-07-2583/6/m_zh80070576350007.jpeg?Expires=1767993718&Signature=3-ouQN6SRND3WHBGh38kaoEYxOWGgxxrnW6BfjL2HRs7hFTY-pIJuS2yf7dvjO5O8bF3Jod~jOaQ1Yn7ZQUZzPU-K8rhAUX4~qaAUyYJZP-UoO3KGqq3qnJVf-LPY2~1PJM0KycbrxddVChvYcp39rdDH8lIdnP9KbjSG3RzKZRBbXzUgiP-OCE8I3HZElO5DqrH9WWSW8SvidOs2kXpAupfuh3jxKPrDdKYU2ygT3Ss413QS9H1ZTIyJxE0PkQLIBSaERhMNGOJxakbDjYuLlsL2rtdwecuMxGqTpwcHNtuPVuYtNQNF2AoRY9StQBk5Bo1~A9bzWkkMfvcGjszyA__&Key-Pair-Id=APKAIE5G5CRDK6RD3PGA)

![Figure 4. Cytokine secretion and proliferation after allogeneic stimulation of highly purified peripheral T-cell subsets from healthy adults. (A) Cytokine profile of purified DN (▪) and CD4+ (□) T cells stimulated with allogeneic mature DCs for 48 hours. A representative result (± SD) of 3 independent experiments is shown. (B) Sorted DN (▪), CD4+ (□), and CD8+ T cells (▦) were stimulated with irradiated allogeneic PBMCs in the presence or absence of IL-2 (100 U/mL) or IL-2 alone. [3H]TdR incorporation was measured after 4 days of culture. Bars represent the means (± SD) of triplicate cultures. Data represents one of 3 experiments with similar results using cells from 3 different donors.](https://ash.silverchair-cdn.com/ash/content_public/journal/blood/105/7/10.1182_blood-2004-07-2583/6/m_zh80070576350004.jpeg?Expires=1767993719&Signature=wCl8kPDPmfhXmPF-j4xp7xS5xhLz8aR6pmGb~-l7LPSbv-mZB7Irbx9ft1p0u~1cHwTvhbvFlVwlQrZmtkq-oEnT8KFQEpQNi94bOEACKinRrrvRtBNI~NoqNyyAJhqW9tAAH-vNtcOu-N3ehaQLwGh3vtetOLJZvJdLyekkLDQHiPgOkpxTlLzs6Z9w9z7lgETQW2ZjCa~UBg7MqU5tkSRVclfGmQtS6x2M1F0ZACMtNpjUeDOs2YgMtsI5rk4883H1WueYPMlSsP4OsyL89XcDTWV7I5qe222J5goJK4NhERAksln9NmHBlwtP1mD~toyuXRoGgRdKMwIw~v5V2Q__&Key-Pair-Id=APKAIE5G5CRDK6RD3PGA)
![Figure 7. Peptide-MHC complexes acquired by DN Treg cells induce apoptosis and suppress proliferation of Ag-specific CTLs. DN T cells from an HLA-A2- donor (donor A) were cocultured with HLA-A2+ mature DCs (donor B) pulsed with either Melan-A or gp100 (control) peptides overnight. DN T cells were then separated from DCs by cell sorting and used as effector cells against Melan-A–specific CTLs generated from donor B. Induction of apoptosis of Melan-A–specific T cells was measured by combined Melan-A–multimer, annexin V, and PI staining on CD8-gated T cells. (A) Dot plot of annexin V-FITC/Melan-A multimer staining of CD3+CD8+-gated Melan-A–specific CTLs after 4 hours of coincubation with DN T cells stimulated either with Melan-A–pulsed DCs (left panel) or gp100-pulsed DCs (right panel) at different E/T ratios from 0 to 5:1. Numbers in the cross represent percentages of cells in the different quadrants within CD8+ T cells. One of 3 independent experiments is shown. (B) Percentage of different apoptotic target cell subpopulations (▪, DN-A2–Melan-A; ○, DN-A2–gp100) calculated from annexin V/PI staining. (C) Melan-A–specific CTL (CTLresp) were cultured either with peptide-pulsed DCs or Melan-A–primed or unprimed DN T cells at a ratio of 1:1. [3H]TdR incorporation was measured after 24 hours of culture. Panels show one of at least 3 different experiments; bars represent the means (± SD) of triplicate wells.](https://ash.silverchair-cdn.com/ash/content_public/journal/blood/105/7/10.1182_blood-2004-07-2583/6/m_zh80070576350007.jpeg?Expires=1767993719&Signature=BGghm0X0Gm0G1nHLRNfO56RnjUj7qnyR~figsF~kmFYUYCaM0UJAFm7vkYTby9ATyNsth0xkH9nn~ib7fNb3FOkX0s0bEeeNcoHIrzBNJkCh6gZKOqXgKYPNhLve0PIel8BdaR9Y2-MbuGtZTnahenS-9Z0sc4Wf6TvKrFYpiNjq6zTRKscg7GyTM3aijtHhtsbQD-9OUYCqoycToYy5~PWK0s~PTNVEO-9V6ybCOmGPnMHz4-Kjm4U5H8Qs-zFvalTgMTbhsFW2Nua5j7ZD7QcptbJPKKBtnQrfvHUH5X4GLhkikqeETiPS-ux9EMAu4UCHac-VnijMGLTBelouLw__&Key-Pair-Id=APKAIE5G5CRDK6RD3PGA)