Abstract
It has been shown that mesenchymal stem cells (MSCs) induce T cells to become unresponsive. We characterized the phenotype of these T cells by dissecting the effect of MSCs on T-cell activation, proliferation, and effector function. For this purpose, an in vitro murine model was used in which T-cell responses were generated against the male HY minor histocompatibility antigen. In the presence of MSCs, the expression of early activation markers CD25 and CD69 was unaffected but interferon-γ (IFN-γ) production was reduced. The inhibitory effect of MSCs was directed mainly at the level of cell proliferation. Analysis of the cell cycle showed that T cells, stimulated in the presence of MSCs, were arrested at the G1 phase. At the molecular level, cyclin D2 expression was profoundly inhibited, whereas p27kip1 was up-regulated. When MSCs were removed from the cultures and restimulated with the cognate peptide, T cells produced IFN-γ but failed to proliferate. The addition of exogenous interleukin-2 (IL-2) did not restore proliferation. MSCs did not preferentially target any T-cell subset, and the inhibition was also extended to B cells. MSC-mediated inhibition induces an unresponsive T-cell profile that is fully consistent with that observed in division arrest anergy.
Introduction
In adult life, stem cells of mesenchymal lineage (MSCs) are mainly confined to the bone marrow, where they constitute a small proportion (0.1%-0.01%) of the general cell population. The growing evidence suggesting that they can recirculate and migrate to injured tissues to replace lost parenchymal cells, together with the possibility of rapidly expanding them ex vivo without loss of differentiation potential,1-4 make them of substantial clinical interest. Studies conducted in human and animal models have demonstrated that infused MSCs are capable of long-term engraftment and in vivo differentiation,5,6 and have already produced encouraging clinical results.7
Further interest in their clinical application has been raised by the observation that MSCs from various species can exert profound immunosuppression by inhibiting T-cell responses to polyclonal stimuli8,9 and to their cognate peptide.10 This property has already been exploited in the clinical setting and has proved of therapeutic usefulness for the treatment of graft-versus-host disease after allogeneic bone marrow transplantation.11 Inhibition does not appear to be antigen specific8 ; it targets primary and secondary T-cell responses10 but may still exert some selectivity because it appears to discriminate between cellular responses to alloantigens and recall antigens.12 The mechanisms underlying the immunosuppressive effect remain to be clarified. Although the use of different methods and different species to generate MSCs has produced conflicting results, overall data suggest that soluble factors9,13-15 and mechanisms mediated by cell contact10,12-15 are involved. In fact, inhibitory soluble factors could be released after or could be enhanced by an initial cell–cell interaction. This 2-step modality is also supported by an immunosuppressive effect that could be mediated by at least 2 actual mechanisms. One is indoleamine 2,3-dioxygenase (IDO), which, by catalyzing the conversion from tryptophan to kynurenine, exerts a major immunosuppressive effect on T-cell responses to autoantigens and fetal alloantigens in vivo. IDO has been shown to be produced by MSCs stimulated by the proinflammatory cytokines released during T-cell activation.15 The second, but not mutually exclusive, mechanism for MSC-induced inhibition also implies an indirect effect because it would involve CD8+ cells with suppressive properties generated in vitro after contact with MSCs.14 Furthermore, the suggested vetolike activity of human MSCs would again be consistent with a contact-dependent contribution.12
A possible insight into the understanding of the mechanisms of MSC-mediated immunosuppression could come from the characterization of MSC-induced unresponsive T cells. MSCs have been shown to inhibit T-cell proliferation in response to a variety of stimuli.8-10,12-15 Controversial data exist regarding their effect on cytotoxic T-cell function because the 2 studies addressing this question, although using the same system and conditions, came to completely different conclusions.12,16 Three fundamental mechanisms accounting for T-cell unresponsiveness have been described— peripheral clonal deletion,17 clonal anergy,18 and suppression/regulation19 —which can also produce different T-cell phenotypes. We have previously shown that the inhibitory effect of MSCs on T cells does not require CD4+/CD25+ regulatory T cells and is nondeletional because it appears to be reversible,10 thus suggesting that a mechanism of clonal anergy could be responsible. This does not necessarily conflict with a contribution from CD8+ suppressor cells.14
In this study, we have analyzed the effect of MSCs on T-cell activation, proliferation, and effector function. We observed that MSCs selectively and irreversibly inhibit the proliferation of T cells by down-regulating cyclin D2 expression without interfering with early T-cell activation. Although MSCs inhibit interferon-γ (IFN-γ) production and T-cell proliferation, their suppressive effect on T-cell function is only transient. We conclude that MSCs induce in T cells a state of division arrest tolerance.
Materials and methods
Mice
C57BL/6 (H2b), BALB.B (H2b), and CBA (H2k) mice were purchased from Olac Harlen (Bicester, United Kingdom). CBA/Ca and C3H.SW (H2b) mice were bred by the Center for Biological Services (CBS) at the Hammersmith Hospital (London, United Kingdom). Mice were used between 7 and 10 weeks of age.
C6 TCRhigh mice (C6) are transgenic for the Vα8 and Vβ11 T-cell receptor chains from the HY-specific CD8+ T-cell clone, C6, specific for the HY antigen–derived peptide TENSGKDI presented by H2Kk (HYKk).20,21 The strain is on a CBA/Ca background. Spleen cells from these mice were used as a source of HY-specific naive T cells. HY-specific memory T cells were obtained by immunizing C57BL/6 female mice by intraperitoneal injection of 5 × 10⁶ syngeneic male splenocytes.
Generation of MSCs
MSCs were generated from BALB.B (H2b) or C3H.SW (H2b) mice because we identified these strains as the best source of MSCs among the H2b haplotypes. Bone marrow (BM) cells, collected by flushing femurs and tibias with medium, were cultivated in 6-well plates or 25-cm2 flasks (Costar, Cambridge, MA) at a concentration of 106/mL nucleated cells in Dulbecco modified Eagle medium (DMEM), with a high glucose concentration, Glutamax I (Gibco BRL, Paisley, United Kingdom), 10% heat-inactivated adult bovine serum (Labtech International, Sussex, United Kingdom), 100 U/mL penicillin, and 100 μg/mL streptomycin (Gibco BRL). Cultures were incubated at 37°C in a 5% CO2 atmosphere. After 72 hours, nonadherent cells were removed. When they were 70% to 80% confluent, adherent cells were trypsinized (0.05% trypsin at 37°C for 5 minutes), harvested, and expanded in larger flasks. A homogenous cell population was obtained after 3 to 5 weeks of culture. Before further expansion and experimental use, MSCs were tested for their ability to differentiate into adipocytes and osteoblasts.22 Adipocytic differentiation was induced by 10-8 M dexamethasone, whereas 10-8 M dexamethasone, 50 μg/mL ascorbic acid, and 10 mM β-glycerophosphate were used for osteoblastic differentiation. Oil red O and von Kossa dyes were used to identify adipocytes and osteoblasts, respectively. More than 90% of the cells differentiated, depending on the time left in culture with the differentiating agent. The identity of MSCs was also confirmed by immunophenotypic criteria based on the expression of CD106 and the absence of hematopoietic (with anti-CD45, anti-CD14, and anti-CD11c antibodies) or endothelial cell (with anti-CD31 antibodies) markers. All antibodies were purchased from PharMingen (Oxford, United Kingdom).
T-cell cultures
All cultures were carried out in RPMI 1640 supplemented with 5 × 10⁻⁵ M 2-mercaptoethanol (2-ME), 10% fetal calf serum (FCS), Glutamax I (Gibco BRL), 100 U/mL penicillin, and 100 μg/mL streptomycin.
Antigenic peptides
Stimulator cells were pulsed with 1000 ng/mL Kk-restricted (TENSGKDI) HY peptide20 (encoded by the Smcy gene) or with the Db-restricted Smcy (KCSRNRQYL),23 the Uty (WMHHNMDLI)24 encoded, and the Ab-restricted Dby encoded (NAGFNSNRANSSRSS)25 HY peptides at 37°C for 2 hours. Unpulsed irradiated CBA or C57BL/6 female splenocytes were used as negative controls.
T-cell proliferation assay
T-cell proliferation assays were performed in 96-well round-bottom plates (Costar, Cambridge, MA) in a total volume of 0.2 mL RPMI 1640. A total of 0.5 μCi (1.85 × 10⁴ Bq) of [3H]-thymidine (ICN, Costa Mesa, CA) was added to each well 2 (naive transgenic T cells) or 3 (memory T cells) days later, as required, and cells were harvested onto glass fiber filters using an LKB 96-well harvester (Wallac Oy, Turku, Finland) after an additional 24 hours. [3H]-Thymidine uptake was measured on an LKB Betaplate counter (Wallac Oy). The results are expressed as mean counts per minute (cpm) for triplicate cultures (standard errors were routinely less than 10%).
Where specified, cell proliferation was also measured by the cell surface stain 5,6 carboxyfluorescein diacetate succinimidyl ester (CFSE). Splenocytes (5 × 10⁶/mL) were stained with 1.7 μM CFSE. After 8 minutes, cells were washed in FCS and phosphate-buffered saline (PBS) and were analyzed by flow cytometry.
Flow cytometric analysis
Antigen-specific T-cell responses were measured by enumerating IFN-γ–producing T cells in response to HY peptides. Irradiated syngeneic splenocytes, pulsed with 10 nM HY peptides at 37°C for 2 hours and then washed, were added to responder T cells at a 1:1 ratio. Before peptide pulsing, stimulator cells were depleted of T cells with antimouse pan-T Dynabeads (Dynal, Bromborough, United Kingdom). Nonpeptide-pulsed, T cell–depleted irradiated syngeneic splenocytes were used as the negative control. During the last 4 hours of stimulation, Brefeldin A (Sigma, St Louis, MO) was added at a concentration of 10 μg/mL to block cytokine secretion. At the end of the culture period, the cells were stained with anti-CD8, anti-CD4, anti-CD25, or anti-CD69 monoclonal antibodies (PharMingen). Cells were stained in 100 μL PBS for 15 minutes at 4°C and then were washed with PBS. Subsequently, the cells were fixed/permeabilized with a commercial solution (Becton Dickinson) for 10 minutes. After further washing, the cells were stained with anti–IFN-γ antibody (PharMingen) for 30 minutes at room temperature. At least 100 000 events in the lymphocyte gate were analyzed by FACScan (Becton-Dickinson, Oxford, United Kingdom). Controls consisted of immunoglobulins of irrelevant specificity matched for fluorochrome and isotype.
Intracellular protein and DNA content was identified using fluorescein isothiocyanate (FITC) and propidium iodine (PI), respectively. Aliquots of 2 × 10⁵ spleen cells were suspended in 90% ethanol for 16 hours to denature proteins. Cell cycle staining buffer consisted of 100 ng/mL FITC, 40 μg/mL PI, and 25 μg/mL RNase (Sigma) in PBS. Cell preparations were incubated in 1 mL buffer, incubated for 30 minutes at 4°C, and acquired on the FACScan.
Western blot
Splenocytes from C57BL/6 mice were stimulated with 10 μg/mL concanavalin A (ConA) in the presence or absence of MSCs for 24 and 48 hours. MSCs were removed from harvested cells using antimouse CD106 monoclonal antibody and Dynabeads. Cell suspensions were lysed in Nonidet P-40 lysis buffer (1% Nonidet P-40, 100 mM NaCl, 20 mM Tris-HCl, pH 7.4, 10 mM NaF, 1 mM sodium orthovanadate, 30 nM Na-glycerophosphate, and protease inhibitors [complete protease inhibitor mixture, as instructed by the manufacturer, Roche Applied Science]) on ice for 15 minutes. Protein concentration was determined by Bio-Rad Dc protein assay (Bio-Rad, Hercules, CA). Proteins (25 μg) were electrophoretically separated on 7% and 10% Tris glycine–sodium dodecyl sulfate–polyacrylamide gel electrophoresis (SDS-PAGE) gels (Invitrogen-Novex, Carlsbad, CA). Proteins were transferred onto Protran Nitrocellulose transfer membranes (Schleicher & Schuell, Dassel, Germany). Membranes were incubated with the following primary antibodies: cdk2 (M2), cdk4 (H22), cdk6 (C21), cyclin D2 (M20), cylin D3 (C-16), cyclin E (M20), and p27Kip1 (C-19) (Santa Cruz Biotechnology, Santa Cruz, CA). Immune complexes were detected using horseradish peroxidase–linked antimouse or antirabbit conjugates as appropriate (DAKO, Glostrup, Denmark) and were visualized using the enhanced chemiluminescence (ECL) detection system (Amersham Biosciences, Amersham, United Kingdom).
Statistical analysis
Results were expressed as mean ± SD. The unpaired Student t test was performed to compare 2 mean values. Probability of null hypothesis less than 5% (P < .05) was considered statistically significant.
Results
MSCs inhibit T-cell effector function but do not prevent T-cell activation
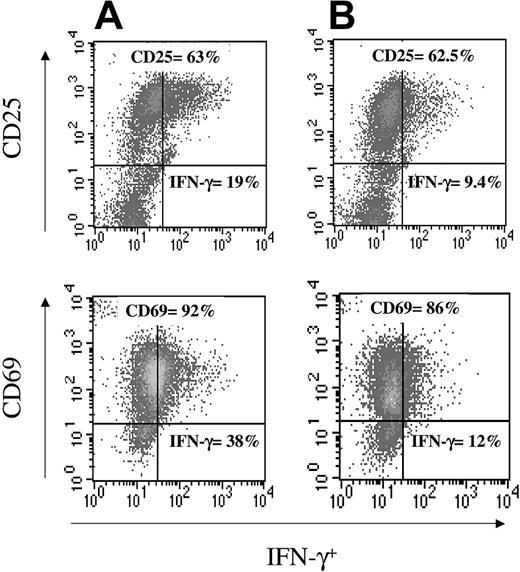
Antigen-stimulated T cells rapidly up-regulate activation markers CD25 and CD69 on their surfaces. To investigate whether MSCs interfere with this early event, splenocytes from C6 mice were stimulated with Kk-restricted HY peptide (HY KkSmcy)–pulsed syngeneic (CBA, H2k) female spleen cells in the presence or absence of MSCs. After 24 hours, T cells were harvested, and CD8+ cells were analyzed for the expression of CD25, CD69, and intracellular IFN-γ production. Figure 1 shows a representative staining. According to our previous experience,10 the proportion of CD8+ T cells expressing intracellular IFN-γ in response to their cognate antigen was significantly reduced in the presence of MSCs (22%± 5.3% [range, 13%-26%] compared with 9.8% ± 2.5% [range, 7%-13.4%]; P = .004) (mean values of IFN-γ staining refer to the upper panel). The presence of MSCs in the cultures did not affect the proportion of CD8+ cells that became CD25+ or CD69+. In fact, in the presence of MSCs, 52.8% ± 11.6% (range, 36%-67%) and 75% ± 12% (range, 55.5%-86%) of CD8+ T cells were also CD25+ or CD69+, respectively. In control cultures without MSCs, 63% ± 5.8% (range, 55%-69%) and 74% ± 15% (range, 56.5%-92%) of CD8+ T cells were also CD25+ or CD69+ (differences not statistically significant). All IFN-γ+ cells were also CD25+ or CD69+. Therefore, although IFN-γ production was impaired in T cells that were in contact with MSCs, the expression of CD25 and CD69 was completely unaffected.
MSCs inhibit T-cell effector function without interfering with T-cell activation. Splenocytes from C6 mice transgenic for a Kk-restricted HY-specific T-cell receptor (TCR) (5 × 10⁶) were stimulated for 24 hours with irradiated female syngeneic (CBA, H2k) spleen cells (5 × 10⁶) pulsed with the cognate HY KkSmcy (TENSGKDI) peptide in the absence (A) or the presence (B) of MSCs (1 × 10⁵). After 24 hours, CD8+ cells were analyzed for intracellular IFN-γ and for the expression of activation molecules using anti-CD25 or anti-CD69 monoclonal antibodies. For IFN-γ staining, T cells were treated with Brefeldin A for the last 4 hours of cultures. Cells were permeabilized, and the proportion of CD8+/IFN-γ+ T cells was quantified. The fluorescence-activated cell sorter (FACS) plot is representative of 1 of 6 experiments of identical design (see “Results” for mean ± SD values).
MSCs inhibit T-cell effector function without interfering with T-cell activation. Splenocytes from C6 mice transgenic for a Kk-restricted HY-specific T-cell receptor (TCR) (5 × 10⁶) were stimulated for 24 hours with irradiated female syngeneic (CBA, H2k) spleen cells (5 × 10⁶) pulsed with the cognate HY KkSmcy (TENSGKDI) peptide in the absence (A) or the presence (B) of MSCs (1 × 10⁵). After 24 hours, CD8+ cells were analyzed for intracellular IFN-γ and for the expression of activation molecules using anti-CD25 or anti-CD69 monoclonal antibodies. For IFN-γ staining, T cells were treated with Brefeldin A for the last 4 hours of cultures. Cells were permeabilized, and the proportion of CD8+/IFN-γ+ T cells was quantified. The fluorescence-activated cell sorter (FACS) plot is representative of 1 of 6 experiments of identical design (see “Results” for mean ± SD values).
MSCs completely abrogate T-cell proliferation
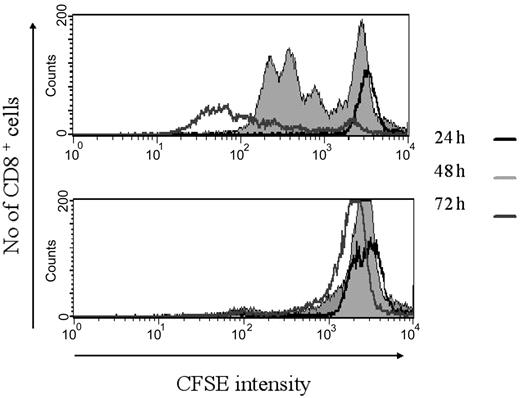
T cells undergo multiple rounds of clonal division after antigen stimulation. We and others have observed that MSCs inhibit T-cell proliferation in response to a variety of stimuli,8-10,12-15 but the analysis has been confined to the measurement of 3H-Tdr incorporation. To investigate the effect of MSCs on the number of cell divisions, C6 splenocytes were stained with the cell surface dye CFSE before antigen stimulation. After each round of T-cell division, the intensity of CFSE is reduced and can be quantitated using cytofluorometry. CFSE-labeled C6 splenocytes were stimulated with irradiated (CBA, H2k) syngeneic female spleen cells pulsed with the HY KkSmcy peptide in the presence or absence of MSCs. T-cell divisions were assessed after 24, 48, and 72 hours. No difference was detected at 24 hours from the beginning of cultures because, by this time, stimulation with cognate antigen had not resulted in cell division. However, differences became evident at 48 hours and persisted at 72 hours because no cell division of HY-specific T cells was detected in the presence of MSCs compared with HY-specific T-cell proliferation in their absence (Figure 2). These findings show that MSC immunosuppressive function affects T-cell proliferation rather than T-cell activation and IFN-γ+ production. However, the inhibitory effect measured on IFN-γ+ T cells 24 hours after in vitro antigen stimulation is not the result of reduced antigen-specific T-cell expansion because, at that particular time after exposure to antigen, T cells do not divide.
MSCs abrogate T-cell proliferation in response to antigen stimulation. C6 splenocytes (5 × 10⁶) were stained with 1.7 μM CFSE and were stimulated with Kk-restricted HY peptide (HY KkSmcy)–pulsed syngeneic APCs (5 × 10⁶) in the presence or absence of MSCs (1 × 10⁵). After 24, 48, and 72 hours, cells were harvested and T-cell proliferation was assessed using cytofluorometry with anti-CD8 mAb and CFSE intensity. FACS profiles are gated on CD8 T cells in the absence (A) or presence (B) of MSCs. FACS plot is representative of 1 of 3 experiments of identical design.
MSCs abrogate T-cell proliferation in response to antigen stimulation. C6 splenocytes (5 × 10⁶) were stained with 1.7 μM CFSE and were stimulated with Kk-restricted HY peptide (HY KkSmcy)–pulsed syngeneic APCs (5 × 10⁶) in the presence or absence of MSCs (1 × 10⁵). After 24, 48, and 72 hours, cells were harvested and T-cell proliferation was assessed using cytofluorometry with anti-CD8 mAb and CFSE intensity. FACS profiles are gated on CD8 T cells in the absence (A) or presence (B) of MSCs. FACS plot is representative of 1 of 3 experiments of identical design.
Inhibition of T-cell effector function, but not proliferation, can be reversed by MSC removal
We previously showed that MSC-induced inhibition of IFN-γ production is transient when MSCs are removed from the cultures after 24 hours.10 Therefore, we increased the time of exposure of T cells to MSCs and included in the analysis the antiproliferative effect. C6 splenocytes were stimulated with syngeneic (CBA, H2k) irradiated female spleen cells pulsed with HY KkSmcy peptide in the presence or absence of MSCs. Cells were harvested after 24 or 48 hours, and MSC were removed by immunomagnetic depletion using CD106. CD106- cultures were restimulated with similarly peptide-pulsed stimulator cells. Restimulated C6 transgenic splenocytes that were cultured in the absence of MSCs served as a control.
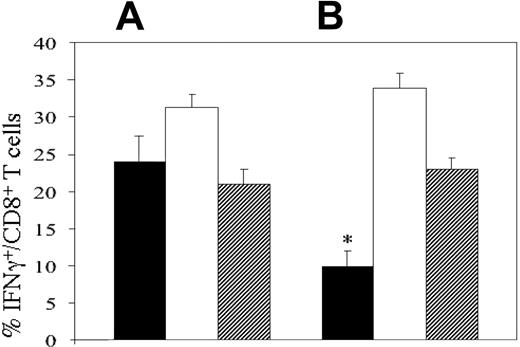
After 24 hours of secondary restimulation, IFN-γ+ T cells were enumerated. Although in primary cultures T cells stimulated in the presence of MSCs exhibited a 50% reduction in IFN-γ+/CD8+ cells compared with controls (24.75% ± 6.6% [range, 18%-36%] vs 11.5% ± 3.6% [range, 6%-17%]; P = .001), after the removal of MSCs and subsequent restimulation, CD8+ T cells resumed normal IFN-γ production (33% ± 9.3% [range, 19%-47.5%] vs 31% ± 7.7% [range, 22%-45%]; P = .78). The extension in the length of T-cell exposure to MSCs (48 hours) before their removal did not affect the ability of T cells to recover (22% ± 7.3% [range, 12%-32%] vs 25% ± 7% [range, 18%-36%]; P = .53) (Figure 3).
MSC-mediated inhibition of IFN-γ production is reversible. C6 splenocytes (5 × 10⁶) were stimulated with syngeneic KkSmcy HY peptide (TENSGKDI)–pulsed syngeneic female spleen cells (5 × 10⁶) in the absence (A) or presence (B) of MSCs (1 × 10⁵). An aliquot of the cultures (▪) was harvested after 24 hours and was directly evaluated for the number of IFN-γ+/CD8+ T cells, as per control. Another aliquot (□) was harvested at the same time, washed, and restimulated with the cognate peptide for another 24 hours. A third aliquot (▨) remained in culture for a total duration of 48 hours and then was harvested, washed, and restimulated for 24 hours before the enumeration of IFN-γ+/CD8+ T cells. T-cell cultures containing restimulated MSCs (B, □ and ▨) underwent immunomagnetic depletion with CD106 to remove MSCs before restimulation. Results are the average of 3 experiments of identical design; bars show the standard deviation (SD). *Statistically significant (P < .01).
MSC-mediated inhibition of IFN-γ production is reversible. C6 splenocytes (5 × 10⁶) were stimulated with syngeneic KkSmcy HY peptide (TENSGKDI)–pulsed syngeneic female spleen cells (5 × 10⁶) in the absence (A) or presence (B) of MSCs (1 × 10⁵). An aliquot of the cultures (▪) was harvested after 24 hours and was directly evaluated for the number of IFN-γ+/CD8+ T cells, as per control. Another aliquot (□) was harvested at the same time, washed, and restimulated with the cognate peptide for another 24 hours. A third aliquot (▨) remained in culture for a total duration of 48 hours and then was harvested, washed, and restimulated for 24 hours before the enumeration of IFN-γ+/CD8+ T cells. T-cell cultures containing restimulated MSCs (B, □ and ▨) underwent immunomagnetic depletion with CD106 to remove MSCs before restimulation. Results are the average of 3 experiments of identical design; bars show the standard deviation (SD). *Statistically significant (P < .01).
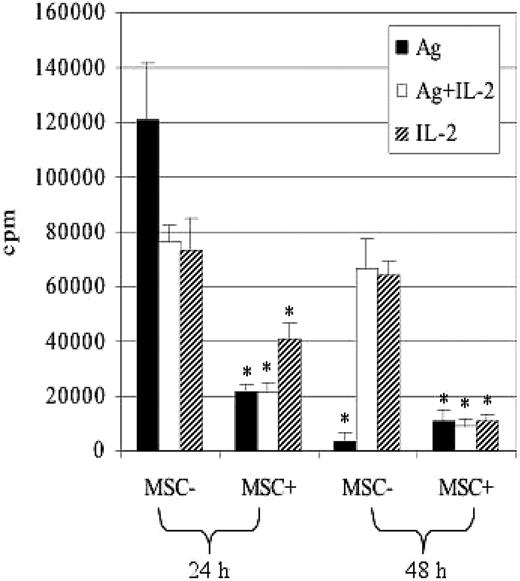
To evaluate the reversibility of the inhibition exerted on T-cell proliferation, the same experimental system and conditions were used. After the removal of MSCs, C6 T cells were restimulated with HY KkSmcy peptide–pulsed spleen cells, and T-cell proliferation was assessed by 3H-Tdr incorporation on day 3. The duration of secondary stimulation (3 days) should allow sufficient time for the T cells to recover from the MSC effect. When MSCs were removed, T cells did not regain their ability to proliferate in response to cognate peptide. This failure should not be ascribed to T cells being in a refractory period because in similar conditions antigen restimulation, after the removal of MSCs, results in IFN-γ production. As shown in the first section, MSCs do not prevent T cells from expressing interleukin-2 (IL-2) receptor (CD25). Therefore, we asked whether the addition of exogenous IL-2, after the removal of MSCs, could circumvent the block and restore the ability of T cells to respond. Neither IL-2 alone nor IL-2 and the antigen could reestablish T-cell proliferation. The lack of T-cell proliferation was even more pronounced when T cells were cultured with MSCs for 48 hours (Figure 4). Poor proliferation, observed when T cells were stimulated for 48 hours in the absence of MSCs and then restimulated, is expected because of the refractory period. Because this can be circumvented by the addition of IL-2, these cultures were used as positive controls.
MSC-mediated inhibition of T-cell proliferation is irreversible. C6 splenocytes (5 × 10⁶) were stimulated with syngeneic KkSmcy HY peptide (TENSGKDI)–pulsed APCs (Ag; 5 × 10⁶) in the presence or absence of MSCs (1 × 10⁵). After 24 or 48 hours, MSCs were removed from the culture by immunodepletion using anti-CD106 mAb, and the T cells (1 × 10⁵) were restimulated with 10 IU/mL IL-2 (▨), or with IL-2 and 5 × 10⁵ HY peptide–pulsed APCs (□), or HY peptide–pulsed APCs only (▪). T-cell proliferation was measured by 3H-Tdr incorporation on day 3. Results are the average of 3 experiments of identical design; bars show the SD. *Statistically significant (P < .01).
MSC-mediated inhibition of T-cell proliferation is irreversible. C6 splenocytes (5 × 10⁶) were stimulated with syngeneic KkSmcy HY peptide (TENSGKDI)–pulsed APCs (Ag; 5 × 10⁶) in the presence or absence of MSCs (1 × 10⁵). After 24 or 48 hours, MSCs were removed from the culture by immunodepletion using anti-CD106 mAb, and the T cells (1 × 10⁵) were restimulated with 10 IU/mL IL-2 (▨), or with IL-2 and 5 × 10⁵ HY peptide–pulsed APCs (□), or HY peptide–pulsed APCs only (▪). T-cell proliferation was measured by 3H-Tdr incorporation on day 3. Results are the average of 3 experiments of identical design; bars show the SD. *Statistically significant (P < .01).
MSCs allow initial protein synthesis but block subsequent DNA synthesis: T cells are arrested in G0/G1 phase of the cell cycle
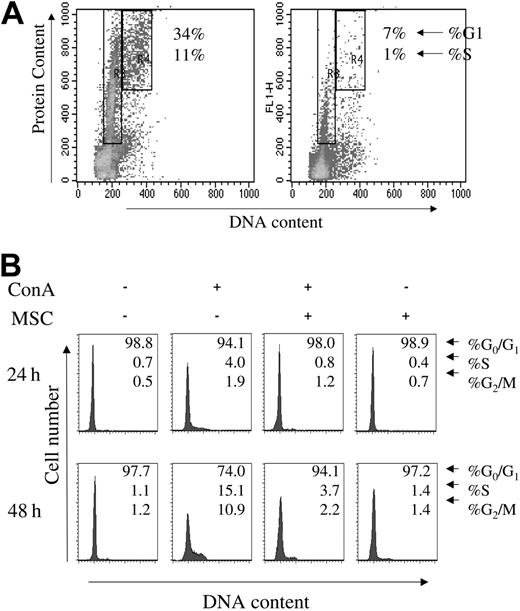
The results thus far described show that MSCs have a profound effect on general protein synthesis, though the T-cell activation and effect functions, which probably require protein synthesis, are preserved or at least inhibited only temporarily. To quantify this effect, intracellular protein and DNA content were measured in T cells using FITC and propidium iodide, respectively. C57BL/6 splenocytes were stimulated with ConA in the presence or absence of MSCs. After 48 hours, in the presence of MSCs, there is a partial increase in T-cell protein content but a complete block in DNA synthesis (Figure 5A). Analysis of the cell cycle showed that T cells enter the S phase already at 24 hours (4%); 48 hours after ConA stimulation, 15% are in the S phase, and 11% have entered the G2 phase. In the presence of MSCs, most (94%) T cells remain in the G0/G1 phase after 48 hours, like control unstimulated T cells (Figure 5B). The proportion of T cells in the S phase in the presence of MSCs at 48 hours is similar to that in the control cultures at 24 hours, thus suggesting that the MSC inhibitory effect might be a mere delay in T-cell entry in the cell cycle. This possibility can be excluded because at 72 hours there is no evidence of cell division at CFSE analysis (Figure 2).
Effect of MSCs on DNA protein synthesis and on the cell cycle. (A) C57BL/6 splenocytes (2.5 × 10⁶) were stimulated with 10 μg/mL ConA in the absence (left) or the presence (right) of MSCs (1 × 10⁵). After 48 hours, cells were harvested, and protein and DNA content were quantified using FITC and PI staining. FACS profiles show T-cell G1-phase protein content (FITC) and S-phase DNA synthesis (PI). (B) C57BL/6 splenocytes (2.5 × 10⁶) were stimulated with 10 μg/mL ConA for 24 and 48 hours in the presence or absence of MSCs (1 × 10⁵). Intracellular protein and DNA content were assessed using FITC and PI staining and were analyzed using cytofluorometry. FACS plots are representative of 1 of 3 experiments of identical design.
Effect of MSCs on DNA protein synthesis and on the cell cycle. (A) C57BL/6 splenocytes (2.5 × 10⁶) were stimulated with 10 μg/mL ConA in the absence (left) or the presence (right) of MSCs (1 × 10⁵). After 48 hours, cells were harvested, and protein and DNA content were quantified using FITC and PI staining. FACS profiles show T-cell G1-phase protein content (FITC) and S-phase DNA synthesis (PI). (B) C57BL/6 splenocytes (2.5 × 10⁶) were stimulated with 10 μg/mL ConA for 24 and 48 hours in the presence or absence of MSCs (1 × 10⁵). Intracellular protein and DNA content were assessed using FITC and PI staining and were analyzed using cytofluorometry. FACS plots are representative of 1 of 3 experiments of identical design.
MSCs irreversibly inhibit the expression of cyclin D2
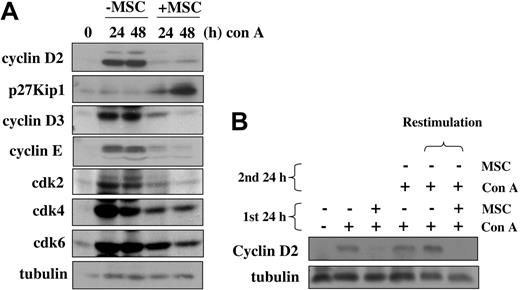
A previous study on T-cell cycle entry defined a commitment point at early G1 where cells decide whether to enter the cell cycle, and it is associated with the induction of cyclin D2 expression.26 To identify the specific point at which T-cell proliferation is arrested by MSCs, we evaluated the expression of the principal molecules involved in cell cycle regulation. For this purpose, C57BL/6 splenocytes were stimulated with ConA in the presence or absence of MSCs. After 24 and 48 hours, activated T cells were investigated by Western blot analysis for the expression of cyclin D2, cyclin E, and p27Kip1 as G1 phase–specific markers. Unstimulated T cells exhibit low levels of cyclin D2 and p27Kip1. In response to ConA, cyclin D2 was up-regulated whereas p27Kip1 was moderately down-regulated to induce cell cycle entry. In contrast, the expression of cyclin D2 was prevented in stimulated T cells that had been cocultured with MSCs. Notably, the expression of the negative cell cycle regulatory protein p27Kip1 was strongly induced compared with that of the control T-cell cultures without MSCs (Figure 6A). Like cyclin D2, the induction of cyclin E and cdk2 by ConA was also blocked by the presence of MSCs. This could be explained by the fact that both cyclin E and its catalytic subunit cdk2 function downstream of cyclin D2. The expression of the catalytic subunits of cyclin D2, cdk4, and cdk6 were not significantly down-regulated by the presence of MSCs compared with cyclin D2. Because cdk4 and cdk6 are phase-dependent, cell cycle–regulated genes, the small reduction in their expression should be attributable to a secondary effect, as exemplified by their expression at 48 hours in the absence of MSCs. Overall, our results suggest that MSCs exert their growth inhibitory effect primarily through blocking cyclin D2 induction and up-regulating p27Kip1 expression.
MSCs irreversibly inhibit expression of cyclin D2. (A) C57BL/6 splenocytes (2 × 10⁶) were stimulated with 10 μg/mL ConA in the presence or absence of MSCs (1 × 10⁵) for 24 or 48 hours. At these times, MSCs were removed, cell pellets were lysed, and 25 mg protein was loaded onto 7% and 10% SDS-PAGE gels and was separated by electrophoresis. Proteins were transferred onto membranes and incubated with antibodies against cyclin D2 (33 kDa), p27Kip1 (27 kDa), cyclin D3 (31 kDa), cyclin E (50 kDa), cdk2 (34 kDa), cdk4 (34 kDa), cdk6 (40 kDa), and β-tubulin (55 kDa). (B) C57BL/6 splenocytes (2 × 10⁶) were stimulated with 10 μg/mL ConA in the presence or absence of MSCs (1 × 10⁵) for 24 and 48 hours. After 24 hours, cultures were harvested, and, after MSC removal, T cells were restimulated with ConA for another 24 hours (lane 6). Cells were then collected and analyzed for cyclin D2 expression. The stimulation of T cells in the absence of MSCs for 48 hours (lane 4) indicates the kinetics of increase in cyclin D2 expression.
MSCs irreversibly inhibit expression of cyclin D2. (A) C57BL/6 splenocytes (2 × 10⁶) were stimulated with 10 μg/mL ConA in the presence or absence of MSCs (1 × 10⁵) for 24 or 48 hours. At these times, MSCs were removed, cell pellets were lysed, and 25 mg protein was loaded onto 7% and 10% SDS-PAGE gels and was separated by electrophoresis. Proteins were transferred onto membranes and incubated with antibodies against cyclin D2 (33 kDa), p27Kip1 (27 kDa), cyclin D3 (31 kDa), cyclin E (50 kDa), cdk2 (34 kDa), cdk4 (34 kDa), cdk6 (40 kDa), and β-tubulin (55 kDa). (B) C57BL/6 splenocytes (2 × 10⁶) were stimulated with 10 μg/mL ConA in the presence or absence of MSCs (1 × 10⁵) for 24 and 48 hours. After 24 hours, cultures were harvested, and, after MSC removal, T cells were restimulated with ConA for another 24 hours (lane 6). Cells were then collected and analyzed for cyclin D2 expression. The stimulation of T cells in the absence of MSCs for 48 hours (lane 4) indicates the kinetics of increase in cyclin D2 expression.
Given that we observed that MSC-induced inhibition of in vitro T-cell proliferation was irreversible, we sought confirmation at the molecular level. C57BL/6 splenocytes were stimulated with ConA in the presence or absence of MSCs for 24 hours (Figure 6B). In 1 experiment (Figure 6B, last lane), MSCs were removed after 24 hours by immunomagnetic depletion, and T cells were restimulated with ConA. After another 24 hours, T cells were harvested and analyzed for cyclin D2 expression. Restimulated T cells previously cultured with MSCs failed to express cyclin D2 even when MSCs had been removed. (Figure 6B).
MSC-induced inhibition equally affects CD4, CD8, and B cells
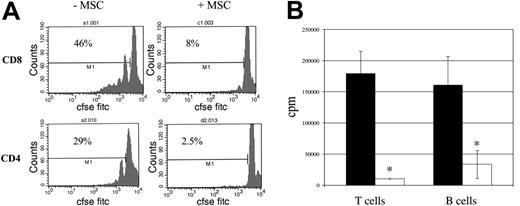
We asked whether the antiproliferative effect exerted by MSCs is selectively confined to specific T-cell subsets. To establish this, C57BL/6 splenocytes were labeled with CFSE and then stimulated with anti-CD3/CD28–coated beads in the presence or absence of MSCs. After 72 hours, T-cell proliferation was assessed by measuring CFSE intensity within CD4+ and CD8+ subsets. The following results represent the mean values obtained from 3 experiments of identical design. The stimulation of CFSE-labeled T cells by anti-CD3/CD28 beads was completely abrogated in CD4+ (28% ± 4% [range, 21%-33%] vs 2% ± 0.5% [range, 1.9%-2.8%]; P = .001) and CD8+ (43% ± 5.5% [range, 39%-49%] vs 7.3% ± 1.5% [range, 6%-8.9%]; P < .001) T cells in the presence of MSCs, thus showing that both cell types were equally affected (Figure 7A). These findings have also been confirmed using HY-specific CD8+ and CD4+ T-cell clones in a proliferation assay (data not shown).
MSCs equally inhibit CD8+, CD4+, and B cells. (A) C57BL/6 (5 × 10⁶) splenocytes were stained with 1.7 μM of CFSE and were stimulated by anti-CD3/CD28–coated Dynal beads (5 × 10⁵/mL) in the presence or absence of MSCs (1 × 10⁵). After 3 days, T-cell proliferation was assessed by CFSE intensity gated within CD8+ or CD4+ T cells. FACS plots are representative of 1 of 3 experiments of identical design. Percentages refer to the proportion of cells that have undergone at least 1 cycle. (B) B-cell splenocytes (1 × 10⁵), obtained by removing T cells using antimouse Thy1.2 Dynal beads, were stimulated with anti-CD40 mAb (2 μg/mL) and IL-4 (10 μg/mL) in the absence (▪) or presence (□) of MSCs (1 × 10⁴) (right). As a comparison, unfractionated C57BL/6 splenocytes (1 × 10⁵) were stimulated with 10 μg/mL ConA in the presence or absence of (1 × 10⁴) MSCs (left). 3H-Tdr was added to cultures on day 2, and cell proliferation was assessed on day 3. Results are the average of 3 experiments of identical design; bars show the SD. *Statistically significant (P < .01)
MSCs equally inhibit CD8+, CD4+, and B cells. (A) C57BL/6 (5 × 10⁶) splenocytes were stained with 1.7 μM of CFSE and were stimulated by anti-CD3/CD28–coated Dynal beads (5 × 10⁵/mL) in the presence or absence of MSCs (1 × 10⁵). After 3 days, T-cell proliferation was assessed by CFSE intensity gated within CD8+ or CD4+ T cells. FACS plots are representative of 1 of 3 experiments of identical design. Percentages refer to the proportion of cells that have undergone at least 1 cycle. (B) B-cell splenocytes (1 × 10⁵), obtained by removing T cells using antimouse Thy1.2 Dynal beads, were stimulated with anti-CD40 mAb (2 μg/mL) and IL-4 (10 μg/mL) in the absence (▪) or presence (□) of MSCs (1 × 10⁴) (right). As a comparison, unfractionated C57BL/6 splenocytes (1 × 10⁵) were stimulated with 10 μg/mL ConA in the presence or absence of (1 × 10⁴) MSCs (left). 3H-Tdr was added to cultures on day 2, and cell proliferation was assessed on day 3. Results are the average of 3 experiments of identical design; bars show the SD. *Statistically significant (P < .01)
Then we tested whether other cells taking part in immune responses are susceptible targets of the MSC antiproliferative effect. Splenic B cells were stimulated with anti-CD40 monoclonal antibody (mAb) and IL-4 in the presence or absence of MSCs. B-cell proliferation was greatly inhibited by MSCs to the same degree as the inhibition exerted in T cells (Figure 7B).
Discussion
We have characterized the immunosuppressive effect of MSCs using in vitro HY-specific T-cell responses. We dissected the consequences of MSCs on T-cell activation, effector function, and proliferation. Although MSCs clearly reduce the number of IFN-γ+/CD8+ T cells, we observed that MSCs did not interrupt normal T-cell activation because they did not affect the number of T cells expressing the early activation markers CD25 and CD69 (Figure 1). The inhibition of IFN-γ+–producing T cells was relatively small when compared with the predominant effect that MSCs exert on T-cell proliferation. In the presence of MSCs, virtually no cell division can be detected in T cells after 72 hours, even though low levels of protein synthesis could be detected (Figure 2). However, we believe that the reduction in the number of IFN-γ+/CD8+ T cells does not result from an interference with T-cell expansion because at 24 hours, the point at which cytokine production was assessed after antigen stimulation, T cells do not divide. Nevertheless, these data suggest that MSCs may have a limited effect on effector functions but that the major inhibitory effect of MSCs on T cells is exerted at the level of cell proliferation. The dissociation between the effects on proliferation and function was more evident when we investigated the reversibility of the inhibition. After antigen restimulation after the removal of MSCs, T-cell IFN-γ production could be restored (Figure 3), whereas T cell proliferation was irreversibly abrogated (Figure 4). In contrast to our data, Di Nicola et al9 failed to document the irreversibility of the inhibition of the proliferative effect. We restimulated T cells from the bulk cultures, but in their system restimulation was performed after the selection of viable cells, which might have been spared by the initial inhibition.
The dissociation in the inhibition of the two cellular functions shows similarities with the split tolerance initially described by Otten and Germain,27 who observed an inhibition of proliferation with little effect on IFN-γ production and CTL activity when antigen-presenting cells (APCs) lacking costimulatory molecules were used to stimulate T cells. This phenotype was more recently confirmed in CD8+ T cells tolerant to tumor antigens.28 A similar form of clonal anergy is activation-induced nonresponsiveness (AINR), but in AINR CD8+ T cells eventually die by apoptosis.29
Another form of anergy should be taken into consideration, although its reversibility has not been investigated. A specific subset of APC-expressing IDO has been shown to induce T-cell tolerance by reducing tryptophan availability locally. This process, which produces anergic T cells with a split tolerance phenotype, has recently been proposed as one of the mechanisms behind MSC-induced immunosuppression.15 A key feature of the tryptophan depletion hypothesis is that IDO activity in mature APCs does not prevent T-cell entry into the cell cycle but does prevent entry into S phase by inducing cell cycle arrest in G1. Stimulated T cells express cyclin D2, a marker of early G1 phase in which activation proteins are synthesized. The passage of T cells from the G1 to the S phase is under the control of inhibitory proteins such as p27Kip1. The down-regulation of these inhibitory proteins and induction of cyclin E after T-cell stimulation allows the cells to enter the S phase and to synthesize DNA. T cells cultured with IDO+ APCs or activated in tryptophan-free medium express early (CD69, CD25) but not late (CD71, cyclin D3) markers of T-cell activation.30,31 Cell cycle analysis of T cells activated in the presence of MSCs showed little protein synthesis (Figure 5), indicating that the T cells are blocked at early G1 phase. The inhibition of cyclin D2 (Figure 6) expression clearly demonstrated that T cells arrest at the early G1 phase of the cell cycle.26 Our findings also imply that MSCs target a signaling pathway involved not only in the down-regulation of cyclin D2 but also in the up-regulation of p27Kip1 expression, and they explain why T-cell proliferation is completely abrogated.
The form of T-cell unresponsiveness induced by MSCs that we have described is not the classical form of anergy because it cannot be reversed by exogenous IL-2,32 even though T cells express normal levels of IL-2 receptor (Figure 4). Others have reported that the addition of IL-2 can restore the MSC inhibitory effect, but IL-2 was added at the beginning of the cultures or at much higher concentrations.8,9 Therefore, our findings are consistent with a form of division arrest anergy, described originally in CD4+ T cells.33 In this system, a proportion of CD4+ T cells fails to divide after stimulation with anti-CD3 and APCs, though all the cells become activated and express CD69. The nondividing cells express CD25 but do not respond to exogenous IL-2. Because this type of anergy is mediated by CTLA-4, we tested its role in our system given that MSCs express CD80.10 However, the addition in cultures of anti–CTLA-4–blocking antibodies34 did not prevent the MSC inhibitory effect (data not shown).
It remains to be investigated whether MSCs can suppress an ongoing immune response. In particular, our experiments cannot ascertain whether MSCs can inhibit T cells that have entered a commitment point in the cell cycle at which proliferation can no longer be arrested.26 However, our data showed that MSC coculture not only down-regulated cyclin D2 but also up-regulated p27Kip1 expression. Because p27Kip1 is a universal cyclin-dependent kinase inhibitor, it is likely that the accumulation of p27Kip1 can also inhibit cell cycle progression during other phases (G1, S, G2, and M) of the cell cycle.
We have previously demonstrated that MSC-mediated inhibition is major histocompatibility complex (MHC) independent.10 It is unlikely that a T-cell subset is preferentially inhibited. In fact, CD4+ and CD8+ T cells were equally susceptible to MSCs (Figure 7A), as already observed in the human system.9 We found that MSC-mediated immunosuppression also affects B-cell proliferation in response to CD40L and IL-4 (Figure 7B). This is not surprising because MSCs target cyclin D2, which controls B-cell progenitor numbers.35 The lack of cell specificity and the main antiproliferative modality of the immunosuppressive effect makes us wonder whether such activity can be extended to other cells outside the immune system. In fact, the antiproliferative activity of MSCs could become immunosuppressive when in contact with cells of the immune system but could regulate the homeostatic expansion of other cell types in the bone marrow.
Finally, our results should be carefully considered in the therapeutic setting, where the use of MSCs to contrast graft-versus-host disease after allogeneic bone marrow transplantation11 could also impair responses to viruses and the underlying malignancy.
Prepublished online as Blood First Edition Paper, December 9, 2004; DOI 10.1182/blood-2004-09-3696.
Supported by grants from the Leukaemia Research Fund–UK and Cancer Research–UK Labs (E.W.-F.L.) and by a PhD studentship from Fundação para a Ciência e a Tecnologia, Portugal (I.S.).
The publication costs of this article were defrayed in part by page charge payment. Therefore, and solely to indicate this fact, this article is hereby marked “advertisement” in accordance with 18 U.S.C. section 1734.

This feature is available to Subscribers Only
Sign In or Create an Account Close Modal