Abstract
Diffuse large B-cell lymphoma (DLBCL) is a heterogeneous disease in which approximately 40% of the patients respond well to current chemotherapy, but the prognosis for the other 60% is poor. The Leukemia/Lymphoma Molecular Profiling Project (LLMPP) used microarray technology to define a molecular profile for each of 240 patients with DLBCL and develop a molecular outcome predictor score that accurately predicted patient survival. Data from our laboratory and others suggest that alterations in antioxidant defense enzyme levels and redox environment can be oncogenic and affect the response to glucocorticoid treatment, one of the components of combination chemotherapy regimens for lymphoma. The goal of the current study was to reanalyze the LLMPP microarray data to determine whether the levels of antioxidant defense enzymes and redox proteins were correlated with prognosis in DLBCL. We found that patients with DLBCL with the worst prognosis, according to the outcome predictor score, had decreased expression of catalase, glutathione peroxidase, manganese superoxide dismutase, and VDUP1, a protein that inhibits thioredoxin activity. The data suggest that the patients with the worst prognosis combine a decrease in antioxidant defense enzyme expression with an increase in thioredoxin system function (the redox signature score).
Introduction
Diffuse large B-cell lymphoma (DLBCL) is the most common type of aggressive lymphoma.1 It is a heterogeneous disease in which approximately 40% of the patients respond well to current chemotherapy, but the prognosis for the other 60% is poor.1 To identify the patients who will not respond to current therapies, Staudt and coworkers2 designed the Leukemia/Lymphoma Molecular Profiling Project (LLMPP). This project used microarray technology to define a molecular profile for each of 240 patients with DLBCL. By using these profiles, the authors identified two gene-expression subsets, germinal center B-cell-like and activated B-cell-like, that corresponded to 2 subpopulations of patients with significantly different survival.2 A third subpopulation, type III, fit neither gene-expression subset.3 Subsequent analysis of these data resulted in the development of a molecular outcome predictor score (OPS) that accurately predicted patient survival, which includes the response to therapy.3
The success in using molecular profiling to predict patient outcome suggests that the same data can be used for a systems biology approach to identify pathways or groups of genes involved in biologic processes that affect prognosis, and to suggest new chemotherapeutic targets. In the current study, we took this approach to examine the role of antioxidant defense enzymes and other proteins that modulate the cellular redox environment in prognosis of DLBCL. A large number of studies suggest the levels of these proteins play a role in diverse tumor types4-6 ; however, the role of these proteins in DLBCL prognosis is unknown.
The intracellular redox environment depends on the relative production and removal of reactive oxygen species (ROS). Small changes in ROS or the intracellular redox environment modulate physiologic and pathologic processes. ROSs such as superoxide and hydrogen peroxide can act as signaling molecules directly; alternatively, a change in redox environment can affect signaling cascades and redox sensitive transcription factors involved in proliferation (eg, activator protein 1 [AP-1]), survival (eg, nuclear factor [NF]-κB),7,8 and hormonal response (eg, glucocorticoid receptor).9,10 In general, a pro-oxidant state, in which ROS production increases relative to ROS removal, is connected with proliferation and tumorigenesis.4,11,12
The intracellular redox environment is modulated by the interaction of a group of molecules. Central to this modulation are the primary antioxidant defense enzymes that detoxify ROSs directly. Catalase (CAT), glutathione peroxidases (GPX), and some of the peroxiredoxins metabolize hydrogen peroxide. Superoxide is metabolized by superoxide dismutases (SODs): copper,zinc SOD (Cu,ZnSOD) in the cytosol, manganese SOD (MnSOD) in the mitochondrial matrix, and extracellular SOD (EcSOD) attached to the cell surface or in the extracellular space. Thioredoxin also participates in the redox regulation of protein function. Thioredoxin is a small protein that transfers reducing equivalents to selected proteins to maintain cysteine sulfhydral groups in a reduced state.13 In this way it modulates the function of selected proteins such as transcription factors rather than affecting the overall redox environment of the cell.13,14
Redox protein alterations have been reported in a number of tumor types. Generally, antioxidant defense enzymes are decreased in tumor tissue when compared with normal tissue.4,5 This is particularly true for MnSOD, which acts as a tumor suppressor in many model systems.4 Recent data also implicate the up-regulation of antioxidant defense enzymes in the tumor suppressive effect of BRCA1.15 An increase in thioredoxin function is oncogenic in many cell types, increasing proliferation and resistance to apoptosis.6 These data indicate that redox proteins potentially affect tumor pathogenesis.
Previously, we found that in a WEHI7.2 mouse thymic lymphoma tissue culture model system, altering the level of intracellular antioxidant defense enzymes or thioredoxin affects the response to glucocorticoids, one of the components of combination chemotherapy regimens in DLBCL. Specifically, increasing thioredoxin or adapting cells to chronic oxidative stress increases resistance to glucocorticoid-induced apoptosis.16,17 Increasing MnSOD expression in the same cell-culture model system sensitizes cells to steroid-induced apoptosis.18 These data suggest that modulating the intracellular redox environment or thioredoxin alters apoptotic signaling events and could affect chemotherapeutic response to steroid treatment.
Based on the data in the WEHI7.2 cell culture model and literature reports in other tumor types, the etiology of lymphoma and chemotherapeutic response may depend on the redox environment, antioxidant defense enzyme, and thioredoxin content of the cells. The goal of the current study was to determine whether alterations in the antioxidant defense enzymes or the thioredoxin system could contribute to the outcome in DLBCL.
Patients, materials, and methods
Data collection
The cDNA microarray data used in this analysis was generated by the LLMPP research group3 and is available from http://llmpp.nih.gov/DLBCL/NEJM-Web_Fig1data. The LLMPP data set contains mRNA-expression data from 240 de novo DLBCL cases and 53 other samples. The data set we analyzed is a subset of 7399 of the original microarray elements and represents approximately 4100 genes.2 We also obtained supplemental microarray data from http://llmpp.nih.gov/DLBCL/ and patient data from http://llmpp.nih.gov/DLBCL/DLBCL-patient-data-NEW.txt for our analysis. The microarray data were normalized to median expression and log-2 transformed.19 We also used publicly available DLBCL oligonucleotide microarray and patient data (n = 58) from www.genome.wi.mit.edu/MPR/lymphoma20 where specifically stated.
Choice of genes and expressed sequence tag validation
To test whether alterations in redox biology could contribute to DLBCL patient outcome we focused on 3 groups of genes. In group 1 we included the primary antioxidant defense enzymes (catalase, GPX1-4, peroxiredox-ins1-6, MnSOD, Cu,Zn SOD, and EcSOD) because they metabolize ROSs directly. In group 2 we included the thioredoxin system proteins (thioredoxin, thioredoxin reductases, and vitamin D3-up-regulated protein [VDUP1/TIP/TBP2], a thioredoxin inhibitor) because thioredoxin transfers reducing equivalents and thioredoxin increases correlate with increased tumor growth.6 The third group included the glutathione S-transferases, γ-glutamyl cysteine synthetase, and NAD(P)H:quinone reductase because these enzymes either increase with ROSs or have peroxidase or reductase activities that affect the oxidative stress response.21-24 Genes without a representative expressed sequence tag (EST) or with an EST that did not meet the criterion described in the next paragraph were omitted from the analysis.
ESTs that represented antioxidant defense genes and other genes of interest were checked for homology to the target gene using the National Center for Biotechnology Information (NCBI) BLAST program, available at http://www.ncbi.nlm.nih.gov/blast/bl2seq/bl2.html. We compared the sequence of the EST with the best cDNA sequence for the target gene, usually a sequence curated by the NCBI staff. Only those ESTs that had more than 75% similarity to the corresponding gene of interest were used for further analysis. The analysis of expression is based on one EST for each gene, with the exception of GPX. For GPX, the array contained one EST for each of GPX1 and GPX3 and 3 for GPX4. The expression patterns were similar, so the expression of the 3 isozymes was averaged for each patient before statistical analysis because there was a high frequency of missing values for each isozyme.
Analysis of tissue MnSOD, p53, and Bcl-2 protein
Cores of paraffin-embedded tumor tissue from 33 patients represented in the LLMPP data set (Department of Pathology, University of Arizona) and 8 control normal tissues were used to construct a tissue array (T-Gen, Phoenix, AZ). To detect protein in the tissue array we used an MnSOD polyclonal antibody25 at a 1:250 dilution or monoclonal p53 (no. 790-2919; Ventana Medical Systems, Tucson, AZ) or Bcl-2 (no. 760-2693; Ventana Medical Systems) antibodies without dilution and automated staining using the Ventana Benchmark System (Ventana Medical Systems). The MnSOD antibody has been validated for immunohistochemistry by one of the authors (L.W.O.).26-28
A tissue score that takes into account the intensity and frequency of MnSOD protein staining was calculated for each tumor and normal tissue sample. Each sample was visually scored by 2 of the authors (D.B.F.J. and M.E.T.), independently, blinded to the patient sample identity. Scoring was done by choosing at random 200 lymphoma cells (tumor samples) or 200 lymphocytes (normal tissue) and assigning an intensity score to each cell. The tissue score for each patient was the sum of the intensity scores weighted for frequency in the tissue sample. Scores from the 2 investigators were averaged to create a final patient tissue score. Major inconsistencies (3 samples) were reconciled by recount of the samples. Tissue scores were generated for p53 and Bcl-2 in a similar manner.
Statistical analysis
The 240 de novo patients were sorted by increasing OPS for all of the ESTs of interest. For each EST, the relative mRNA-expression values within the highest 10% and lowest 10% of OPS values were compared by using a t test assuming unequal variances. For comparison of relative mRNA expression versus OPS or relative expression of another mRNA in the entire data set, the samples were ordered by one of the parameters and similarity tested by regression analysis. To compare MnSOD mRNA expression to protein content in the tumor samples, the scores for both mRNA expression and tissue array were ranked, then a regression analysis was used to determine whether the tissue score correlated to the relative mRNA-expression levels from the LLMPP data set. Significance was set at P < .05. Statistical tests were done using the Analysis Toolpak for Microsoft Excel 2002 (Microsoft, Redmond, WA).
Redox signature score
The redox signature score was calculated by taking the sum of the mRNA-expression values of the genes in group A and subtracting the sum of the mRNA-expression values of the genes in group B for each patient. Group A included vitamin D3-up-regulated protein1 (VDUP1/TIP/TBP2), MnSOD, Cu,ZnSOD, EcSOD, GPX1,3,4, thioredoxin reductase1,2 catalase, and GST alpha and omega. Group B included thioredoxin and microsomal GST. The genes were grouped in this way so that, based on the known biologic functions of these proteins, a low score would be consistent with a more oxidized redox environment and increased proliferation. Scores ranged from -8.478 to 7.226.
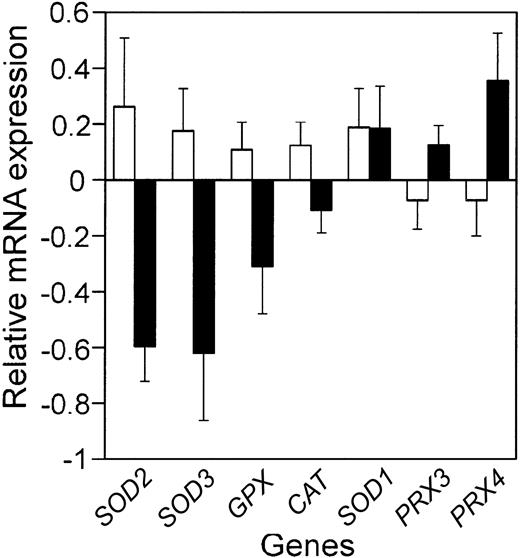
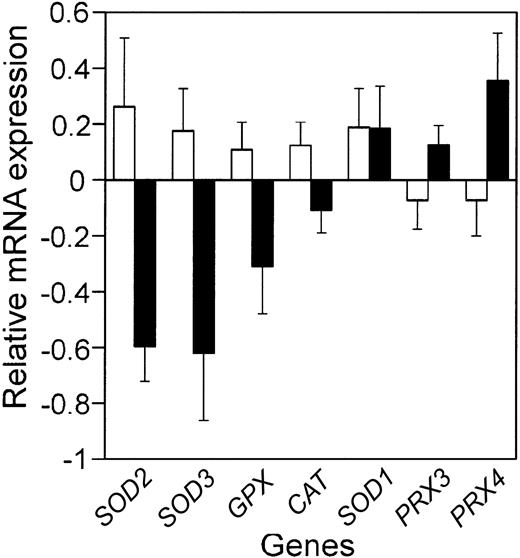
Comparison of the mean relative antioxidant defense enzyme mRNA expression in the patients with the best prognosis to those with the worst prognosis. Bars represent the mean relative mRNA expression, on a log2 scale, for the 10% of the patients with the best (□) and worst (▪) prognosis from the LLMPP microarray, plus or minus the standard error of the mean (SEM). Gene names are abbreviated as in Table 1.
Comparison of the mean relative antioxidant defense enzyme mRNA expression in the patients with the best prognosis to those with the worst prognosis. Bars represent the mean relative mRNA expression, on a log2 scale, for the 10% of the patients with the best (□) and worst (▪) prognosis from the LLMPP microarray, plus or minus the standard error of the mean (SEM). Gene names are abbreviated as in Table 1.
Data for the 240 de novo patients were sorted by increasing redox signature score, separated into quartiles, and Kaplan-Meier plots created for the combined data set. To compare the subtypes, the patients were first sorted for subtype, germinal center-like, activated B-cell-like, or type III, and then redox signature score before creating Kaplan-Meier plots (Excel; Microsoft). The 5-year overall survival was determined from these plots. Survival differences between quartiles for patients separated by redox score were tested using the Breslow-Gehan-Wilcoxon test.
Results
Decreased antioxidant enzyme expression correlated with poor prognosis
In a number of tumor types, antioxidant defense enzyme expression is decreased compared with normal tissue.5 In cell-culture and mouse-model systems, altering antioxidant defense enzymes can affect tumorigenesis and response to chemotherapy drugs.4,17 As a first step in determining whether altered antioxidant defense enzyme expression could contribute to etiology or chemotherapeutic response in DLBCL, we used the LLMPP microarray data to test whether antioxidant defense enzyme mRNA expression in the patients with the worst prognosis was significantly different from that in the patients with the best prognosis (Figure 1; Table 1). We also determined whether antioxidant defense enzyme expression was significantly correlated with outcome predictor score (Table 1). This analysis showed that 2 superoxide dismutases (MnSOD and EcSOD), glutathione peroxidase, and catalase were all decreased in patients with the worst outcome. Cu,ZnSOD expression showed no correlation with prognosis and the 2 peroxiredoxins on the array increased with poor prognosis.
We also analyzed the expression of the alpha and omega GST isozymes and found no significant correlation with prognosis (data not shown). Although GSTs are generally considered secondary antioxidant defense enzymes that detoxify electrophiles and xenobiotics,29 GST alpha and GST omega have peroxidase or reductase activities that may affect the oxidative stress response.23,24
These data suggest the possibility that the tumors from the patients with the worst prognosis have an increase in ROSs. One way to test this possibility is to examine the expression of genes that have an antioxidant response element (ARE) in the promoter. This element is found in the promoter of a number of genes that increase in response to ROS.21 On the LLMPP array, several genes that have well-characterized AREs are not represented, for example γ-glutamyl cysteine synthetase and NAD(P)H:quinone reductase21 ; however, microsomal GST, a gene with a putative ARE that increases with ROS,22 was significantly increased in patients with a worse prognosis (P < .001).
Decreased thioredoxin inhibitory protein correlated with poor prognosis
Thioredoxin increases have been found in other tumor types and have been connected to increases in proliferation.6 In the WEHI7.2 cell-culture model system, increased thioredoxin confers resistance to glucocorticoids.16 When we examined the expression of thioredoxin in the lymphoma patient samples, we found it showed an increasing trend with poor prognosis; however, this difference was not significant (Table 2). The most striking difference we found in the thioredoxin-related proteins on the array (Table 2) was a very significant decrease in VDUP1, also called thioredoxin inhibitory protein, in patients with the worst prognosis. This protein binds to and inhibits the action of thioredoxin,30 resulting in a decrease in proliferation.31,32 A decrease in VDUP1 would be expected to increase functional thioredoxin in the DLBCL tumors. These data suggest that thioredoxin function is increased in patients with the worst prognosis.
Decreased MnSOD protein in patients with poor prognosis
Of the antioxidant defense enzymes, MnSOD showed the most significant decrease in expression when comparing patients with the best and worst prognoses. MnSOD is a known tumor suppressor in other tumor types4 and may have a similar role in DLBCL.
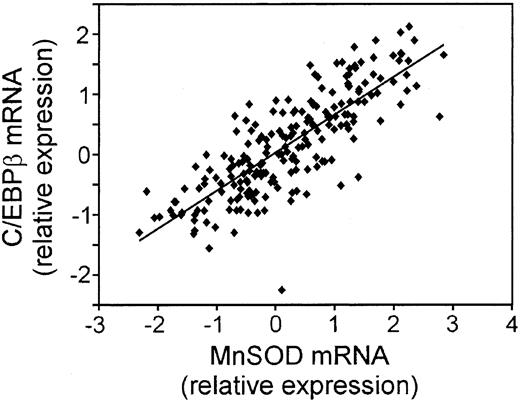
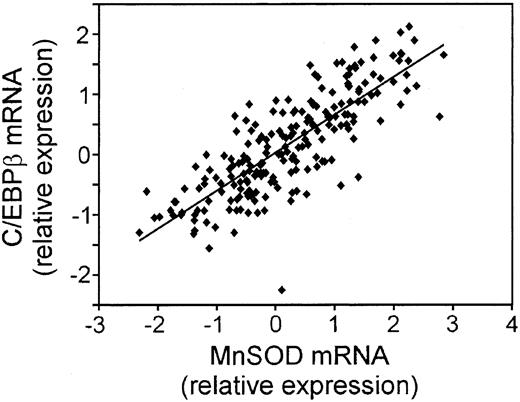
We took 3 approaches to further explore the biologic relevance of the MnSOD mRNA changes. First, we compared the correlation of CCAAT enhancer binding protein β (C/EBP β) mRNA with that of MnSOD using the LLMPP array expression data (Figure 2). MnSOD is a known target of C/EBP β.33 The expression pattern of these 2 genes was very similar (R2 = 0.6539; P = 1.37 × 10-49), suggesting that MnSOD is controlled at the transcriptional level by this protein in these tumor samples.
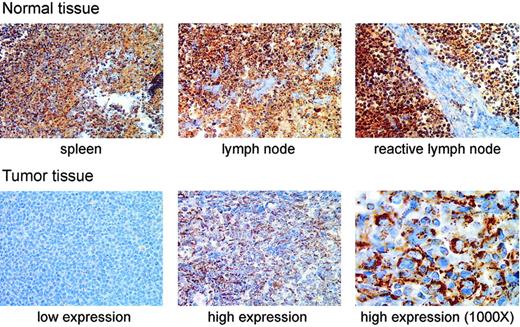
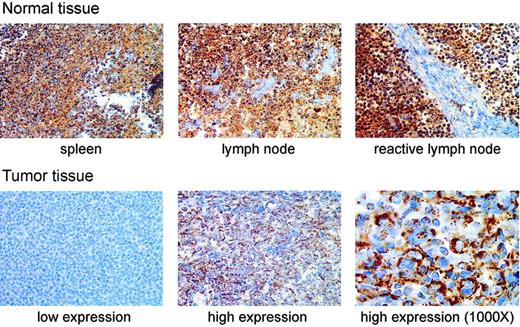
We next tested whether MnSOD protein was decreased in patient samples with decreased MnSOD mRNA by immunohistochemically staining a tissue array for MnSOD protein. The most striking difference in MnSOD protein was that the normal tissues containing B cells (spleen, lymph node, and reactive lymph node) had greater amounts of MnSOD protein than any of the tumor samples in the array (Figure 3). There was also a considerable range of staining within the set of tumor samples as shown by the examples of tumor tissue in Figure 3.
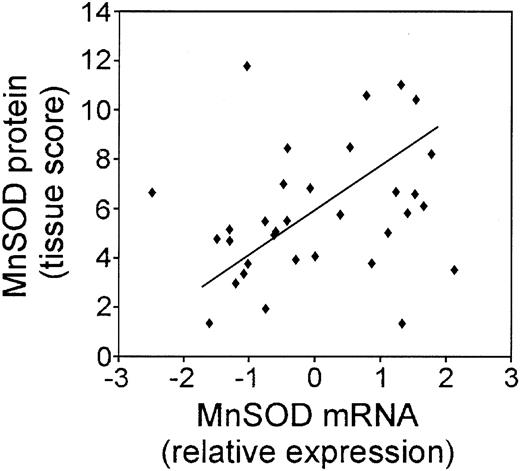
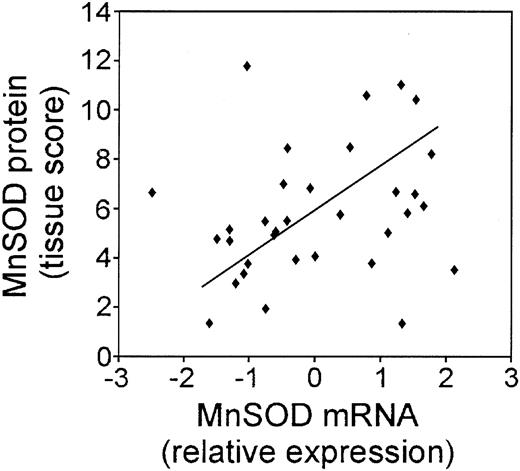
In order to compare the MnSOD protein to the mRNA expression in the patient samples, we quantified the intensity and frequency of MnSOD staining and calculated a tissue score. We then compared the MnSOD mRNA expression values to the MnSOD tissue score as shown in Figure 4. In general, the protein staining in the tumor samples correlated with the mRNA (P = .081). Of 33 cases, 31 showed very good correlation between the mRNA and protein values. Exact correlation may not be possible because protein from only lymphoma cells was scored in the tissue array; however, cores for mRNA extraction may also include other cell types and connective tissue that was abundant in some of the tumor samples and did not stain for MnSOD protein.
Third, we examined MnSOD as a function of p53 because wild-type p53 is an upstream regulator of MnSOD in other cell types.34,35 Immunohistochemical staining for p53 in 18 cases from the LLMPP patient data set showed that 4 (22%) of 18 were positive for p53; p53 positive was defined as more than 15% of the cells in the sample staining for p53 nuclear protein.36 We found no correlation between p53 and MnSOD at the protein or mRNA level. There was no correlation between p53 protein and MnSOD mRNA expression.
Correlation of the mRNA for C/EBP β, a transcriptional regulator of MnSOD expression, to MnSOD mRNA in DLBCL. Plot of the relative mRNA expression of C/EBP β versus MnSOD in each patient sample from the LLMPP microarray.
Correlation of the mRNA for C/EBP β, a transcriptional regulator of MnSOD expression, to MnSOD mRNA in DLBCL. Plot of the relative mRNA expression of C/EBP β versus MnSOD in each patient sample from the LLMPP microarray.
Increased Bcl-2 correlated with decreased overall survival
In addition to the extensively studied antiapoptotic function of B-cell lymphoma 2 (Bcl-2),37 Bcl-2 can act as an antioxidant or pro-oxidant in a cell-type-specific manner.38 In lymphoid cell lines, overexpression of Bcl-2 acts as a pro-oxidant39-41 ; therefore, we examined Bcl-2 expression in the DLBCL patient samples. An increase in the Bcl-2 mRNA expression was significantly correlated with poor prognosis as measured by OPS (P = 3.48 × 10⁻⁶) and decreased overall survival (P < .001). Immunohistochemical staining for Bcl-2 protein in a subset of the patients included on the LLMPP microarray showed that Bcl-2 protein correlated with Bcl-2 mRNA expression (P = .026).
Redox signature separates patients based on survival
The data suggest that decreases in some proteins affecting the redox environment are correlated with poor prognosis; however, increases in others may be equally as important. To examine the redox environment using a systems biology approach, changes in the proteins relative to each other is of critical importance. A good example of a critical ratio is that of thioredoxin and VDUP1. Thioredoxin itself changes little with prognosis; however, there is a decrease in VDUP1, an inhibitor of thioredoxin. This is expected to result in an increase in functional thioredoxin similar to what an increase in thioredoxin alone would cause.
In order to test whether the redox environment affects prognosis in DLBCL, we developed a redox signature score that includes changes in multiple components and accounts for relative changes that would impact the redox biology of the cells. For this signature we used the expression of the 3 SODs, the GPX enzymes, catalase, and the components of the thioredoxin system. We also included expression of the GST isozymes on the array (alpha, omega, and microsomal) that are most likely to affect or indicate the oxidative stress response of the cell. We omitted the peroxiredoxins because neither the regulation nor cellular function of these enzymes is well characterized. Mathematically, we devised the redox signature score to produce a high score when the thioredoxin system function is low, GST expression is moderate, and antioxidant defense enzyme expression is high. The genes were grouped in this way so that, based on the known biologic function of these proteins, a high score would be consistent with a more reduced redox environment and decreased proliferation. Thus, we would predict a high score would be correlated with a better prognosis. This redox signature score had a better correlation with the outcome predictor score (P = 1.12 × 10⁻¹⁰) than any individual component, with a higher score reflecting a better prognosis. The redox signature score was also significantly correlated with overall survival (P = .005).
Immunohistochemical staining of MnSOD protein in normal human lymphoid tissues and DLBCL patient samples. The top row of photomicrographs shows immunohistochemical staining for MnSOD protein (brown) in normal spleen, lymph node, and a reactive lymph node (antigen stimulated). The bottom row shows staining in 2 different patient samples selected to represent, from left to right, low and high MnSOD staining. These images are from different tissue samples on the same tissue array slide (original magnification, × 400). The third panel (far right) in the bottom row is a higher magnification (original magnification, × 1000) view of the high MnSOD-staining tumor sample shown in the middle panel of the bottom row. The large atypical cells clearly show a cytoplasmic staining pattern. Images were viewed on a Nikon Labphot 2 microscope using 40×/0.65 and 100×/1.25 oil-immersion objective lenses (Nikon, Melville, NY). Images were acquired with a SPOT RT Color 2.2.0 camera (Diagnostic Instruments, Sterling Heights, MI) and Spot Advanced 4.0.9 software for Windows. Cover slips were mounted on the slides using Pro-Texx Mounting Medium (VWR International, West Chester, PA).
Immunohistochemical staining of MnSOD protein in normal human lymphoid tissues and DLBCL patient samples. The top row of photomicrographs shows immunohistochemical staining for MnSOD protein (brown) in normal spleen, lymph node, and a reactive lymph node (antigen stimulated). The bottom row shows staining in 2 different patient samples selected to represent, from left to right, low and high MnSOD staining. These images are from different tissue samples on the same tissue array slide (original magnification, × 400). The third panel (far right) in the bottom row is a higher magnification (original magnification, × 1000) view of the high MnSOD-staining tumor sample shown in the middle panel of the bottom row. The large atypical cells clearly show a cytoplasmic staining pattern. Images were viewed on a Nikon Labphot 2 microscope using 40×/0.65 and 100×/1.25 oil-immersion objective lenses (Nikon, Melville, NY). Images were acquired with a SPOT RT Color 2.2.0 camera (Diagnostic Instruments, Sterling Heights, MI) and Spot Advanced 4.0.9 software for Windows. Cover slips were mounted on the slides using Pro-Texx Mounting Medium (VWR International, West Chester, PA).
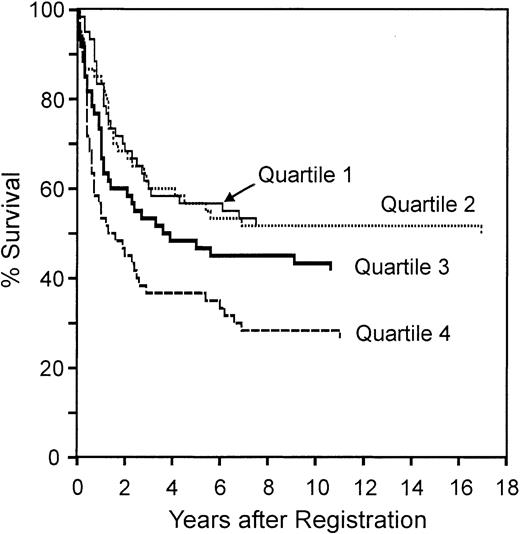
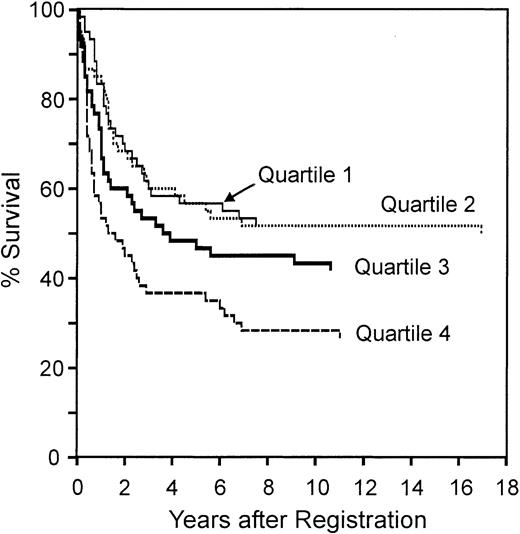
We next tested whether the redox signature predicted overall survival by dividing the patients into quartiles by redox signature score, then comparing 5-year survival among quartiles (Figure 5). The redox signature score separated the patients such that the 5-year survival in quartiles 1 and 2 was similar (57%), the survival in quartile 3 was less (47%), and the survival in quartile 4 was much less (37%). Patients in quartile 4 had significantly shorter survival than patients in quartile 1 (P < .001) and quartile 2 (P = .005).
Correlation of the MnSOD mRNA and MnSOD protein in DLBCL patient samples. Plot of the relative MnSOD mRNA expression from the LLMPP microarray versus MnSOD protein using a tissue score that takes into account the intensity and frequency of MnSOD immunohistochemical staining in 33 DLBCL patient samples.
Correlation of the MnSOD mRNA and MnSOD protein in DLBCL patient samples. Plot of the relative MnSOD mRNA expression from the LLMPP microarray versus MnSOD protein using a tissue score that takes into account the intensity and frequency of MnSOD immunohistochemical staining in 33 DLBCL patient samples.
The redox signature score separated approximately 50% of the patients from the other 2 quartiles. In the original molecular classification of DLBCL from the LLMPP microarray data, the patients were divided into germinal center-like (GC), activated B-cell-like (ABC), and type III subtypes.2,3 The patients with a GC molecular profile had a significantly better prognosis than either ABC or type III patients.2,3 Approximately 50% of the cases were GC-like. One possible interpretation of these data is that the redox signature score is identifying the GC patient subset. Therefore, we first sorted the patients based on the molecular profile that classified them as 1 of these 3 subtypes, and then used the redox signature to compare the survival in the quartiles within each of the 3 subtypes.
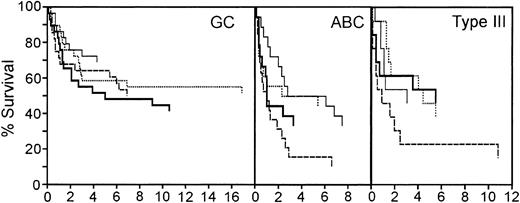
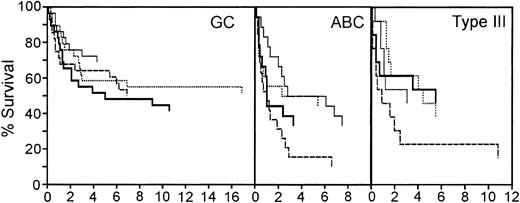
The redox signature score further separated groups of patients within each of these 3 subtypes that have different prognoses (Figure 6). The GC patients had the best overall survival; 5-year survival ranged from 69% to 48%. Although the redox signature score in the GC patients did not completely separate quartiles based on the 5-year survival, the patients in quartile 1, with the best redox signature score, had a higher long-term overall survival. In the ABC subtype, redox signature score quartiles 1 and 2 had a 5-year survival of 50%, whereas the patients in quartiles 3 and 4 had 33% and 16% 5-year survival rates, respectively. Patients in quartile 4 had a significantly shorter survival than those in quartile 1 (P = .018). Type III patients in the top 3 redox signature score quartiles had very similar 5-year survival rates (46% to 54%); however, the patients in quartile 4 had a 5-year survival rate of 23%. Type III patients in quartile 4 had a significantly shorter survival than those in quartile 2 (P = .052). This suggests that the redox signature score provides an independent assessment of survival probability and that redox environment can contribute to DLBCL prognosis.
An independent DLBCL molecular profiling study has also been able to separate seemingly similar DLBCL cases into subgroups with differing prognoses; however, this group did not find that the cases sorted into GC-like and ABC-like subgroups.20 We were not able to apply the redox signature score analysis to the data set from this study because not enough of the genes were represented on that array; however, we did find that increased GPX was significantly correlated with better survival (P ≤ .05).
Overall survival of patients separated by redox signature score. Comparison of overall survival of patients separated into 4 quartiles by redox signature score. Patients in quartile 1 have the highest redox signature score.
Overall survival of patients separated by redox signature score. Comparison of overall survival of patients separated into 4 quartiles by redox signature score. Patients in quartile 1 have the highest redox signature score.
Survival of patients in the germinal center B-cell-like (GC), activated B-cell-like (ABC), and type III subgroups separated by redox signature score. Comparison of survival of patients separated into 4 quartiles by redox signature score within each subgroup. Patients in quartile 1 have the highest redox signature score. Quartiles are graphed as follows: quartile 1, thin solid line; quartile 2, dotted line; quartile 3, thick solid line; quartile 4, dashed line.
Survival of patients in the germinal center B-cell-like (GC), activated B-cell-like (ABC), and type III subgroups separated by redox signature score. Comparison of survival of patients separated into 4 quartiles by redox signature score within each subgroup. Patients in quartile 1 have the highest redox signature score. Quartiles are graphed as follows: quartile 1, thin solid line; quartile 2, dotted line; quartile 3, thick solid line; quartile 4, dashed line.
Discussion
Our analyses of the LLMPP microarray data show that a decrease in antioxidant defense enzyme expression coupled with an increase in the thioredoxin system function is correlated with poor overall survival in DLBCL. The patients with the worst redox signature scores fared worse than the patients with the best redox signature scores independent of the DLBCL subtype. This indicates that the redox environment may play a role in the prognosis of DLBCL.
Survival data in these patients with DLBCL reflect a combination of etiology and treatment response. Alterations in the antioxidant defense enzyme and thioredoxin system function have been implicated in both of these processes in other tumor types and cell-culture model systems. In general, antioxidant defense enzyme expression is decreased in tumor versus normal tissue, suggesting a role for these proteins in pathogenesis4,5 ; however, there is enzyme and tumor-type specificity. In DLBCL there is decreased catalase and GPX in patients with worse prognosis, suggesting that the ability to metabolize hydrogen peroxide is compromised in these patients. A decrease in functional GST has also been connected to other malignancies. In particular, polymorphisms that result in decreased GST function for the pi, theta, and mu isozymes have been implicated in increased cancer risk.42 Although expression of many of the GST isozymes does not change with prognosis in the DLBCL tumor samples, further analysis is necessary to determine whether unfavorable polymorphisms affecting activity exist in these patients.
The most striking change in the antioxidant defense enzymes in the patients with DLBCL is the correlation of decreased MnSOD mRNA and protein expression with poor prognosis. This observation may be important in light of the ability of increased MnSOD to act as a tumor suppressor and antiproliferative agent in several model systems.25,43-45 This enzyme is the only enzyme that metabolizes superoxide in the mitochondrial matrix and from this vantage point modulates intracellular ROSs and proliferation.4,45-47 The location of the SOD may be important because alterations in Cu,ZnSOD (primarily cytosolic) and EcSOD (outer surface of the plasma membrane or extracellular space) are not as frequently connected with neoplasia5,48,49 ; the Cu,ZnSOD expression did not change with prognosis in the patients with DLBCL studied here.
The correlation of the C/EBP β expression with that of MnSOD, which can be regulated by C/EBP β,33 in these samples suggests the possibility that MnSOD is one critical downstream effector in the larger gene network regulated by C/EBP β. Increases in C/EBP β inhibit proliferation50 and are involved in the regulation of differentiation in hematopoietic cells.51,52 C/EBP β knockout mice develop lymphoproliferative disease.53 Loss of both C/EBP β and MnSOD may contribute to the increased proliferation seen in the patients with the worst prognosis.
We were unable to detect a correlation between p53 and MnSOD in the tumor tissue that we examined by immunohistochemistry. Human MnSOD contains a p53 consensus binding site in the promoter.34 Wild-type p53, but not mutated p53, regulates MnSOD at the transcriptional level in cell-culture model systems.34,35,54 p53 mutations are found in a subset of patients with DLBCL36,55 ; however, the p53 mutational status of the patients in the present study is unknown. A more extensive study that includes additional cases and determines the mutational status of p53 is needed to define the p53/MnSOD relationship in DLBCL.
The sharp decrease in VDUP1 combined with a slight increase in thioredoxin in the patients with the worst prognosis suggests that these patients have an increase in functional thioredoxin. Thioredoxin was originally identified as an autocrine growth factor in transformed lymphoid cells.56 Increased thioredoxin has been implicated in increased proliferation in a number of tumor types and model systems.6 Thioredoxin function also depends on the presence of thioredoxin reductase; however, expression of thioredoxin reductase changed very little over the patient data set, suggesting that this enzyme is not affecting prognosis in these patients. The critical alteration in the thioredoxin-related proteins that affects DLBCL prognosis may be the loss of thioredoxin inhibition by a VDUP1 decrease. In model systems, overexpression of VDUP1 results in decreased proliferation and metastasis.31,57 VDUP1 decreases also occur during tumor development in a rat model system58 and as follicular lymphomas transform to DLBCL.59
Redox environment and specific redox proteins may play a critical role in the chemotherapeutic response in these patients. The patients in this study all received adriamycin-based chemotherapy, which is designed to induce apoptosis in the tumor cells.2 Thioredoxin generally inhibits apoptosis by many agents by binding and inhibiting ASK-1 (apoptosis-signal-regulating kinase).60 One of the functions of GSTs is to metabolize xenobiotics, which include chemotherapeutic drugs.61 The increase in microsomal GST may signal an increased ability to detoxify these drugs, reducing the cytotoxicity for a given drug dose.
The efficacy of doxorubicin and glucocorticoids, both components of combination chemotherapy regimens in DLBCL, may depend, at least in part, on the redox properties of the cells. In the WEHI7.2 cell-culture model system, our data suggest that an increase in functional thioredoxin or a decrease in MnSOD cause resistance to glucocorticoid-induced apoptosis.16,18 Glucocorticoid receptor function is also redox sensitive; when the receptor is oxidized, function is decreased.62 The role for ROSs in doxorubicin-induced cell death remains uncertain. Once doxorubicin is taken into the cells, it can undergo repeated oxidation and reduction resulting in the production of ROSs.12 In addition to the generation of ROSs, doxorubicin has multiple cellular effects that do not depend on ROS generation. These effects include DNA intercalation, formation of covalent DNA adducts, interference with DNA strand separation, and inhibition of topoisomerase II.63,64 Although the poisoning of topoisomerase II is often cited as the predominant factor in the chemotherapeutic response, the relative contribution of the individual doxorubicin effects is not clear.63,64 Some reports suggest that the ROS generation is critical to the mechanism of doxorubicin-induced cell death,65 while others indicate that it is not important66 or that excess hydrogen peroxide interferes with doxorubicin activity.67 Taken together, these data suggest that changes in specific redox-related proteins and/or the redox signature score, which gives an indication of complex changes in the cellular redox environment, may affect the survival by affecting the treatment response. However, the molecular details that contribute to treatment failure in patients with DLBCL remain to be elucidated.
Increased Bcl-2 protein expression is a significant predictor of decreased overall survival in DLBCL.68 Although association does not prove causality, it is reasonable to suggest that Bcl-2 plays a role in this disease. The well-recognized antiapoptotic function of Bcl-237 is expected to contribute to the chemoresistance phenotype. Increased Bcl-2 may also contribute to a more oxidized redox environment in the patients with the poorest prognosis. Bcl-2 acts as an antioxidant in some cell lines38 ; however, in lymphoid-derived cell lines, among others, Bcl-2 acts as a pro-oxidant.39-41,69 An increase in Bcl-2 would be consistent with a more pro-oxidant state in the patients with the worst overall survival. By affecting the redox environment, Bcl-2 overexpression may affect critical aspects of the DLBCL tumor phenotype, in addition to chemoresistance, that contribute to poor outcome.
Redox environment alterations have global effects that may affect DLBCL prognosis. During the development of the outcome predictor score, one of the best predictors of prognosis was the proliferation signature.3 A more oxidized redox environment or pro-oxidant state, as suggested by the decrease in antioxidant defense enzyme expression, has been connected with the increased proliferation seen in tumor cells.4,11,12 This also correlated with the increase in thioredoxin system function suggested by the decrease in VDUP1. Ideally, we could measure the intracellular redox environment in DLBCL tumor cells in patients directly to confirm our findings. The technology for such measurements, however, has not been developed. In a pilot study, urinary excretion of 8-hydroxy-2′-deoxyguanosine, a DNA oxidative damage product, was elevated in the lymphoma patients with the worst prognosis.70 This is consistent with a pro-oxidant state in these patients. In addition to the connection with increased proliferation, the pro-oxidant state may be implicated in the development of other characteristics of the tumor-cell phenotype, including increased mutation frequency, altered glucose metabolism, and resistance to apoptosis.11,12,71
The finding that the patients with the worst prognosis have decreased MnSOD and VDUP1, a thioredoxin inhibitor, suggests potential chemotherapeutic targets. Compounds that inhibit thioredoxin or mimic MnSOD are being developed and tested. For example, PX12, a thioredoxin function inhibitor, has antitumor activities in mouse models of other tumor types.6,72 The metalloporphyrin derivatives, AEOL 10 113 and 10 150, act as MnSOD mimetics in animal models of ischemia/reperfusion.73 Testing of these compounds in models of DLBCL will determine the potential usefulness of these types of drugs in the treatment of DLBCL.
Prepublished online as Blood First Edition Paper, August 4, 2005; DOI 10.1182/blood-2005-02-0487.
Supported by funds from the National Cancer Institute, CA71 768 (M.M.B.), CA84 967 (L.M.R., T.M.G., T.P.M.), and CA32 102 (L.M.R., T.M.G., T.P.M.). D.B.F.J. was partially supported by funds from the Howard Hughes Medical Institute (52 003 749).
M.E.T. designed and performed research, analyzed data, and wrote the paper; D.B.F.J. performed research and analyzed data; L.M.R., T.M.G., and T.P.M. contributed vital new reagents and analyzed data; R.A.R. designed and performed research; L.W.O. contributed vital new reagents; and M.M.B. designed research, analyzed data, and assisted with writing the paper.
The publication costs of this article were defrayed in part by page charge payment. Therefore, and solely to indicate this fact, this article is hereby marked “advertisement” in accordance with 18 U.S.C. section 1734.
We thank Yvette Frutiger for immunostaining of the tissue array.

