Abstract
Most patients with de novo chronic myeloid leukemia (CML) achieve good responses to imatinib, but the rate and degree of molecular response is variable. We assessed the inhibitory concentration 50% for imatinib (IC50imatinib) in 62 patients with de novo chronic-phase CML as a predictor of molecular response. IC50imatinib was determined in pretherapy blood samples by measuring the in vitro imatinib-induced reduction of the phosphorylated form of the adaptor protein Crkl (CT10 regulator of kinase like). There was marked variability between patients, with IC50imatinib ranging from 0.375 to 1.8 μM (median, 0.6 μM). Patients with low IC50imatinib (IC50 ≤ 0.6 μM; n = 36) had a 36% probability of achieving 2-log reduction in BCR-ABL (breakpoint cluster region-abelson) by 3 months compared with 8% in patients with high IC50imatinib (n = 26) (P = .01). The IC50imatinib was also predictive of molecular response at 12 months, with 47% of patients in the low IC50imatinib group achieving 3-log reduction and 23% in the high IC50imatinib group (P = .03). The predictive power of IC50imatinib was particularly strong in patients with low Sokal scores. These data provide strong evidence that intrinsic sensitivity to imatinib is variable in previously untreated patients with CML, and the actual level of BCR-ABL kinase inhibition achieved is critical to imatinib response. The IC50imatinib potentially provides a new prognostic indicator for molecular response in patients treated with imatinib. (Blood. 2005; 106:2520-2526)
Introduction
Chronic myeloid leukemia (CML) is a clonal hematologic malignancy characterized by the presence of the Philadelphia chromosome (Ph) which arises from a balanced translocation between chromosomes 9 and 22. This translocation results in the fusion of the ABL gene on chromosome 9 with the BCR gene on chromosome 22.1-3 The resulting BCR-ABL (breakpoint cluster region-abelson) fusion protein is a constitutively active tyrosine kinase, conferring enhanced proliferative activity and decreased sensitivity to apoptotic cell death in the cells in which it is expressed. As such, BCR-ABL is critical to the pathogenesis of the disease.4-6
Imatinib (Glivec, formerly STI571; Novartis Pharmaceuticals) is a 2-phenylaminopyramidine compound that is a potent inhibitor of all ABL tyrosine kinases (c-ABL, BCR-ABL, and Tel/ABL). In addition, imatinib is an inhibitor of the tyrosine kinases of the platelet-derived growth factor (PDGF) receptor,7,8 ARG9 and c-Kit,7,10 and the macrophage colony-stimulating receptor, c-fms.11 Clinical trials have demonstrated the efficacy of imatinib in chronic-phase CML.12,13 Approximately 95% of patients with de novo chronic-phase CML achieve complete hematologic response, with 90% achieving major, and 80% complete, cytogenetic remissions.14 At the molecular level, significant reductions in the level of BCR-ABL transcript as measured by quantitative real-time PCR (RQ-PCR) have been observed.15 Although these outcomes demonstrate a significant role for imatinib in the treatment of CML, the response of some patients remains suboptimal.
In the International Randomized Study of Interferon versus STI571 (IRIS), 39% of patients randomly assigned to the imatinib arm achieved at least a 3-log reduction in the level of BCR-ABL transcript. Grouping patients according to their Sokal16 prognostic score revealed 50% of patients within the low-risk Sokal group achieved a reduction of at least 3 log compared with 30% in the intermediate- and 19% in the high-risk group (P = .007).17 This further highlights the variability of patient response and demonstrates that even in the good-risk Sokal group, molecular response is variable.
Because no predictive in vitro index of imatinib response has been identified, we have investigated an in vitro measure of imatinib-induced BCR-ABL kinase inhibition using Crkl (CT10 regulator of kinase like). Crkl is an adaptor protein consisting of an src homology 2 (SH2) domain and 2 tandem SH3 domains in the absence of any catalytic domain.18 It is related to the crk oncogene of the avian sarcoma virus, CT10.19,20 Crkl is located centromeric to the BCR gene on chromosome 22 and encodes a protein of 38 kDa molecular weight. ABL and BCR-ABL are capable of phosphorylating Crkl, and Crkl forms specific complexes with both proteins in COS-1 cells transfected with these proteins.21 Crkl is the predominant phosphorylated protein in K562 cells, a BCR-ABL-expressing erythroblastoid cell line.22 Furthermore, it has been demonstrated that tyrosine phosphorylation of Crkl (p-Crkl) occurs in cells from patients with primary CML as a direct consequence of BCR-ABL expression18,23 with levels of p-Crkl correlating well with the level of BCR-ABL protein. Importantly, p-Crkl is not detectable in BCR-ABL-negative cells.
We have used the phosphorylation status of Crkl in an assay of in vitro imatinib sensitivity in samples collected before treatment, to assess whether such an assay is predictive of imatinib response. In this study, we have analyzed the inhibitory concentration 50% for imatinib (IC50imatinib) in 62 patients enrolled in the Therapeutic Intensification in de novo leukemia (TIDEL) trial; an Australasian Leukemia and Lymphoma Group (ALLG) study in which 102 patients with de novo CML were treated with 600 mg imatinib as front-line therapy. By correlating findings with molecular response during the first 12 months of treatment, we found that the pretherapy IC50imatinib provides a statistically significant predictor of patient outcome.
Patients, materials, and methods
Patient population
Patients included in this study were enrolled in the TIDEL trial, a phase 2 study in adult patients with newly diagnosed chronic myeloid leukemia, of initial intensified imatinib therapy, and sequential combination therapy for nonresponders. Approval for the study was obtained from the institutional review boards of the Institute of Medical and Veterinary Science (Adelaide, Australia) and the Royal Adelaide Hospital (Adelaide, Australia). All patients commenced imatinib at 600 mg/d. Within the first 12 months, the dose was increased to 800 mg/d if a patient failed to achieve (1) complete hematologic response by 3 months, (2) major cytogenetic response by 6 months, or (3) complete cytogenetic response by 9 months. If this level of response was not achieved after a further 3 months of 800 mg/d, the patient was eligible to receive intermittent combination therapy with arabinosyl cytosine (Ara-C). Of the 62 patients in this cohort, 20 patients had a dose increase from 600 to 800 mg/d, but in all cases this increase occurred between the 10th and 12th month of imatinib therapy. Only one patient received Ara-C, and this occurred in the 11th month of treatment.
Blood samples
Blood (40 mL) was obtained, with informed consent, from patients with de novo chronic-phase, CML prior to the commencement of imatinib therapy on the TIDEL trial. All patients were within 9 months of diagnosis and had not previously received imatinib or interferon.
Mononuclear cells (MNCs) were isolated from blood using Lymphoprep (Axis Shield, Oslo, Norway) density gradient centrifugation. Experiments were performed on fresh cells, either on the day of isolation or after overnight storage in Hanks Balanced Salt Solution (Ca++ and Mg++ free; JRH Biosciences, Lenexa, KS) medium supplemented with 5% fetal bovine serum (Trace Biosciences, Sydney, Australia).
Imatinib
The 2-phenylaminopyrimidine derivative imatinib (formerly STI571) was kindly provided by Novartis Pharmaceuticals (Basel, Switzerland). Stock solutions were prepared at 1 mM and 10 mM in distilled water, sterile filtered, and stored at 4°C.
Western blot analysis
Patient cells (2 × 10⁶ ) were incubated at 2 × 10⁵ cells/mL for 2 hours24,25 with varying concentration of imatinib, ranging from 0 μMto50 μM. After incubation, cells were washed once with cold phosphate-buffered saline (PBS) and lysed in Laemmli buffer26 by boiling for 12 minutes. Cell lysates were clarified by microfugation for 5 minutes at 15 000 rcf and stored at -20°C. Protein lysate (20 μL; corresponding to 2 × 10⁶ cells) was resolved on an sodium dodecyl sulfate (SDS)/10% polyacrylamide gel. Protein was electrophoretically transferred to nitrocellulose membrane. Following blocking for 1 hour at room temperature with 2.5% membrane-blocking agent (Amersham Pharmacia, Piscataway, NJ), the membrane was probed for 2 hours at room temperature with anti-Crkl antibody (Santa Cruz Biotechnology, Santa Cruz, CA). After incubation with alkaline-phosphatase-conjugated anti-rabbit immunoglobulin (Santa Cruz Biotechnology), bound antibodies were detected with enhanced chemifluorescence (ECF) substrate (Amersham Pharmacia) and analyzed by Fluor Imager analysis (Molecular Dynamics, Sunnyvale, CA). Signals were quantified using Image Quant software (Molecular Dynamics).
The BCR-ABL-expressing cell line K562 (American Type Culture Collection [ATCC], Manassas, VA) was used to establish the assay and for reproducibility experiments. When sufficient patient cells were provided, analysis was performed in duplicate. In addition 5 patient samples were analyzed 3 times to ascertain the reliability and reproducibility of this assay on primary cells.
Determination of the IC50imatinib
The ratio of phosphorylated Crkl (p-Crkl) to nonphosphorylated Crkl was determined using Image Quant analysis. Resultant band densities were graphed against the concentration of imatinib used at each data point. Curves were then constructed such that the percentage of p-Crkl at 0 μM imatinib was standardized to 100%, and all other data points were normalized about this value. The IC50 was defined as the concentration of imatinib producing a 50% decrease in the level of p-Crkl compared with untreated controls. The background level was determined by the level of p-Crkl at the highest concentration of imatinib at which the phosphorylation of the protein was completely blocked by the drug. Background levels ranged from 10% to 15% for all patients and were a reflection of the sensitivity of the detection system rather than indicative of the percentage of p-Crkl. All results were subsequently verified using Graph Pad Prism (GraphPad Software, San Diego, CA).
Log reduction in BCR-ABL
Measurement of the level of BCR-ABL transcript formed part of the essential therapeutic monitoring for the TIDEL trial. This was performed in accordance with previously published methods27,28 using real-time quantitative reverse transcriptase PCR (q-RT-PCR). Patient samples were monitored for BCR-ABL levels at baseline and 1, 2, 3, 6, 9, and 12 months after the commencement of imatinib. Log reduction was calculated using a standardized baseline, rather than the actual baseline.15,17
Molecular response criteria used in this study
Although patient response is currently more commonly reported as a cytogenetic rather than a molecular outcome, the correlation between the 2 is strong (r = 0.73; P < .001)29 (r2 = 0.94; P < .001).28 In this study we opted for molecular response because in many cases the cytogenetic analysis was unavailable or suboptimal (27% of patients having < 20 metaphases examined). The molecular outcome for each patient was assessed at regular intervals to 12 months and compared with the pretherapy IC50imatinib. An optimal response was defined as a 2-log reduction in BCR-ABL by 3 months (2-log reduction has previously been shown to equate to a complete cytogenetic response)15 and/or a 3-log reduction in BCR-ABL, defined as a major molecular response (MMR),17 by 12 months. Validation for the use of this molecular data comes from findings of the IRIS trial whereby achievement of MMR at 12 months is highly predictive of progression-free survival at 24 months. Further, a 2-log reduction by 3 months was found to correlate (P < .001) with achievement of MMR and progression-free survival.28
A suboptimal molecular response was defined by failure to achieve a 1-log reduction by 6 months (the molecular equivalent of a major cytogenetic response [MCyR])15 or a 2-log reduction by 12 months. The IRIS study clearly showed a significantly higher risk of progression for patients who failed to achieve MCR at 6 months and patients who failed to achieve CCR after 12 months,30 validating these as milestones of interest, with regard to suboptimal response. Those patients who failed to achieve a 1-log reduction (molecular equivalent of MCyR) in BCR-ABL transcript by 12 months were considered to demonstrate primary imatinib failure. Patients who achieved early response, then lost response, were deemed to be secondary imatinib failures.
Data analysis
Analysis of variance was used to assess data reproducibility. The Mann-Whitney rank sum was used to define differences between groups, and correlation was performed using Spearman rank order. Kaplan-Meier curves were constructed to estimate the probability of achievement of log reductions in BCR-ABL, and log-rank survival analysis provided comparative statistics.
Results
IC50imatinib determination
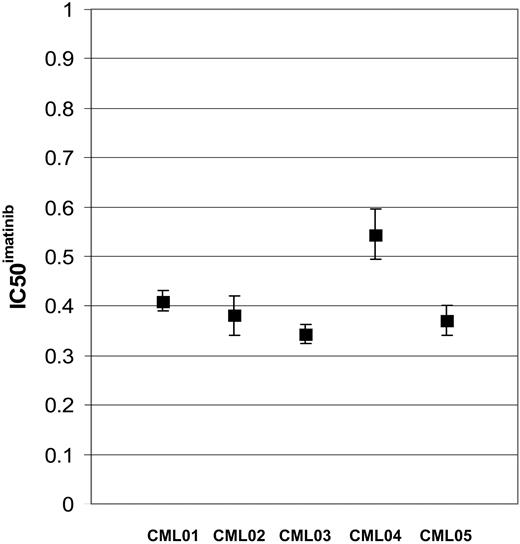
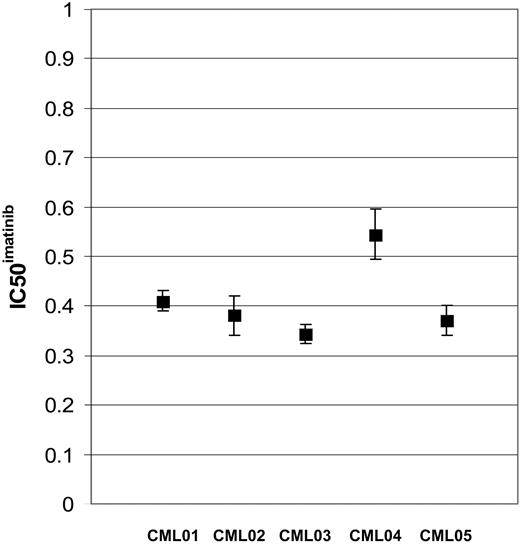
Replicate IC50imatinib assays have been performed on 5 individual patients with de novo CML. Assays have also been performed on sequential samples in 3 patients. There was no significant difference between assays for each patient (P > .05). Standard error for each patient sample set were less than .02 (Figure 1).
IC50imatinib determination: TIDEL patients
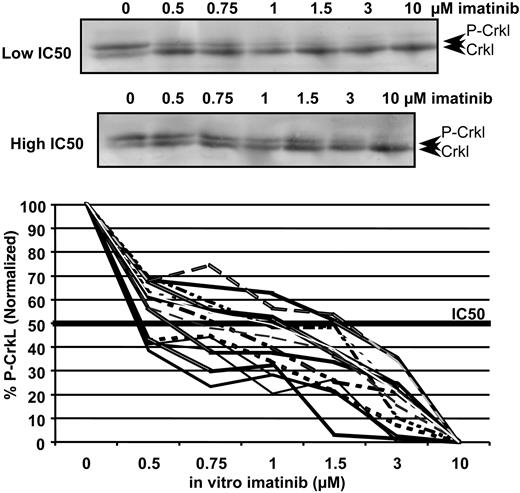
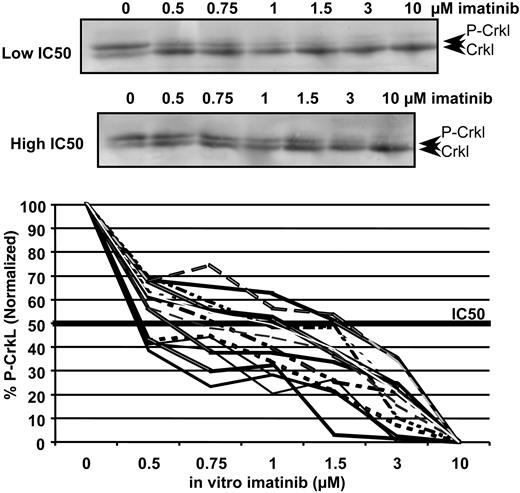
The IC50imatinib in samples taken prior to imatinib therapy was determined for 62 patients with de novo CML enrolled to the TIDEL trial. The median IC50imatinib was 0.6 μM with a range from 0.375 to 1.8 μM (Figure 2). The 95% confidence intervals for the IC50imatinib were determined to be 0.4 μMto1.5 μM.
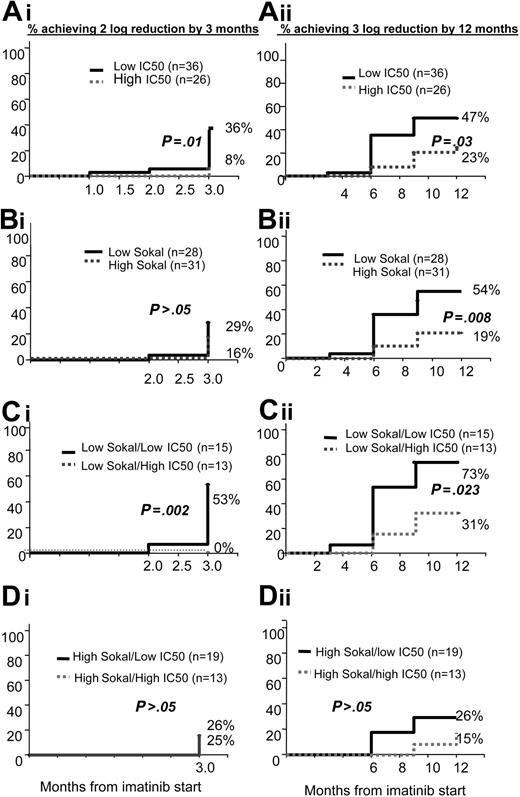
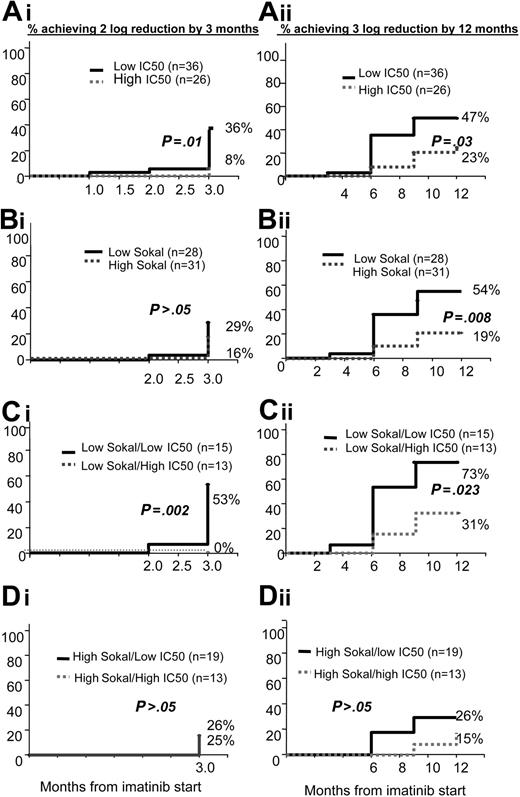
To enable assessment of the predictive power of the IC50imatinib with regard to molecular outcome, patients with an IC50imatinib less than or equal to the median of 0.6 μM were grouped as having a low IC50imatinib (n = 36), and those with an IC50imatinib above the median were classified as having a high IC50imatinib (n = 26). A significantly greater percentage of patients with a low IC50imatinib achieved a 2-log reduction by 3 months and a 3-log reduction by 12 months than those patients in the high group (Table 1; Figure 3Ai-ii). Of particular note is the difference between the groups at 3 months. In the low IC50imatinib group 36% of patients achieved a 2-log reduction by 3 months. Only 8% of patients achieved 2-log reduction by 3 months in the high IC50imatinib group (P = .01).
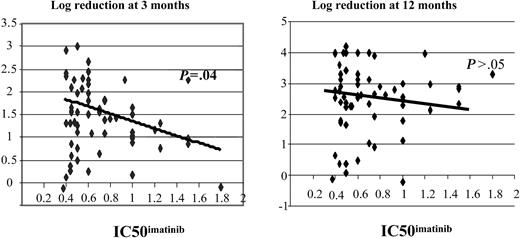
There was correlation between the IC50imatinib and the log reduction at 3 months (R2 =-0.29; P = .04), however the correlation failed to reach significance at 12 months (R2 =-0.14; P > .05) (Figure 4).
Analysis of actual dose received revealed that there was no significant difference in dose between patients with a low IC50imatinib and those with a high IC50imatinib at 2, 6, and 12 months (data not shown).
The reproducibility of the IC50imatinib assay is displayed in a dot plot. Mean and standard error, representing replicate assays, are shown for 5 patients with de novo CML.
The reproducibility of the IC50imatinib assay is displayed in a dot plot. Mean and standard error, representing replicate assays, are shown for 5 patients with de novo CML.
Western blot titrations demonstrating the decrease in percentage of p-Crkl at increasing concentrations of imatinib in 2 patients with varying IC50imatinib. The top blot represents phosphorylated Crkl; the bottom blot, the nonphosphorylated Crkl. The graph demonstrates the variation in IC50imatinib in 15 patients enrolled to the TIDEL study.
Western blot titrations demonstrating the decrease in percentage of p-Crkl at increasing concentrations of imatinib in 2 patients with varying IC50imatinib. The top blot represents phosphorylated Crkl; the bottom blot, the nonphosphorylated Crkl. The graph demonstrates the variation in IC50imatinib in 15 patients enrolled to the TIDEL study.
Association of IC50imatinib with Sokal prognostic score
The Sokal prognostic score16 has previously been shown to be predictive of outcome in patients with CML treated with imatinib.31 We first determined whether the IC50imatinib was simply reflecting the patient's Sokal score. There was no correlation between the 2 indicators (R2 =-0.08; P > .05), and there was no significant difference in the median Sokal score of the low and high IC50imatinib groups (low, 0.965; high, 0.95; P > .05). Similarly, there was no significant difference between the median IC50imatinib in the 2 Sokal groups (low, 0.6 μM; high, 0.6 μM; P > .05).
The 59 patients with Sokal scores available at the time of diagnosis were divided, at the median score of 0.95, into 2 groups. There was no statistical difference between the 2 groups in the achievement of 2-log reduction in BCR-ABL by 3 months. Although there was no correlation between the Sokal score and the log reduction of BCR-ABL at either 3 or 12 months (P > .05), a significantly higher proportion of patients within the low Sokal group achieved a 3-log reduction by 12 months (low Sokal score, 54% [n = 28]; high Sokal score, 19% [n = 31]; P = .008), (Table 1; Figure 3Bi-ii). This latter analysis performed using Kaplan-Meier statistics indicates that there is a significant difference in the probability of patients grouped into the low Sokal risk category of achieving a 3-log reduction when compared with the high-risk group. This indicates that in this cohort, when data are grouped about the median, Sokal score is a good predictor of 3-log reduction by 12 months.
Kaplan-Meier graphs demonstrating the percentage of patients predicted to achieve 2-log reduction by 3 months and 3-log reduction by 12 months. These graphs are based on (A) overall IC50imatinib, (B) Sokal score, (C) patients within the low Sokal group only, and (D) patients with a high Sokal score only.
Kaplan-Meier graphs demonstrating the percentage of patients predicted to achieve 2-log reduction by 3 months and 3-log reduction by 12 months. These graphs are based on (A) overall IC50imatinib, (B) Sokal score, (C) patients within the low Sokal group only, and (D) patients with a high Sokal score only.
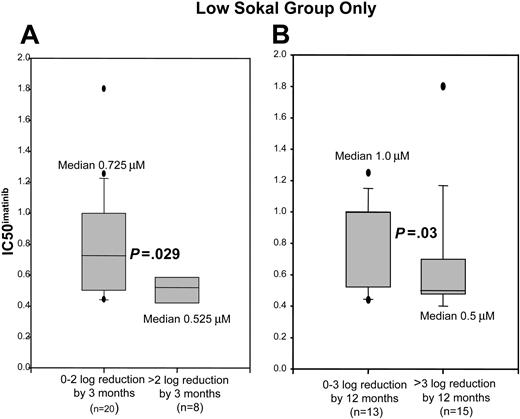
We then evaluated whether Sokal score and IC50imatinib could be used together to predict molecular response at 3 and 12 months. The median IC50imatinib in the patients in the low Sokal group who achieved a greater than 2-log reduction by 3 months was 0.525 μM, and in those achieving a 0 to 2-log reduction the median IC50imatinib was 0.725 μM (P = .029). In patients with low Sokal score who achieved a greater than 3-log reduction by 12 months, the median IC50imatinib was 0.5 μM, whereas in those who achieved a 0 to 3-log reduction the median IC50imatinib was 1.0 μM (P = .03) (Figure 5). Analysis of the high Sokal group revealed no difference in the IC50imatinib between those patients who achieved greater than 2-log reduction by 3 months or greater than 3-log reduction by 12 months (median IC50imatinib, 0.6 μM; P > .05).
Dot plots demonstrating the correlation between the log reduction in BCR-ABL at 3 and 12 months after the start of imatinib therapy and IC50imatinib.
Dot plots demonstrating the correlation between the log reduction in BCR-ABL at 3 and 12 months after the start of imatinib therapy and IC50imatinib.
Representative box plots showing distribution of IC50imatinib in those patients with a low Sokal score, grouped as achievement or nonachievement of the noted milestones. Values within the 25th to 75th percentile are enclosed within the shaded area. Median is as indicated, 5th and 95th percentiles are shown by error bars, and outliers are delineated as discrete dots. (A) Distribution of IC50imatinib in those patients who achieved a 0- to 2-log reduction in BCR-ABL by 3 months versus those who achieved a greater than 2-log reduction by 3 months. (B) Distribution of IC50imatinib in those patients who achieved a 0- to 3-log reduction in BCR-ABL by 12 months versus those who achieved a greater than 3-log reduction by 12 months.
Representative box plots showing distribution of IC50imatinib in those patients with a low Sokal score, grouped as achievement or nonachievement of the noted milestones. Values within the 25th to 75th percentile are enclosed within the shaded area. Median is as indicated, 5th and 95th percentiles are shown by error bars, and outliers are delineated as discrete dots. (A) Distribution of IC50imatinib in those patients who achieved a 0- to 2-log reduction in BCR-ABL by 3 months versus those who achieved a greater than 2-log reduction by 3 months. (B) Distribution of IC50imatinib in those patients who achieved a 0- to 3-log reduction in BCR-ABL by 12 months versus those who achieved a greater than 3-log reduction by 12 months.
IC50imatinib split the low Sokal group significantly into those performing well at both time points and those who do not. This is most notable in the achievement of a 2-log reduction by 3 months, whereby, despite being in the low Sokal group, those with a high IC50imatinib failed to achieve a 2-log reduction by 3 months (low Sokal/low IC50imatinib, 53% [8 of 15]) versus low Sokal/high IC50imatinib, 0%
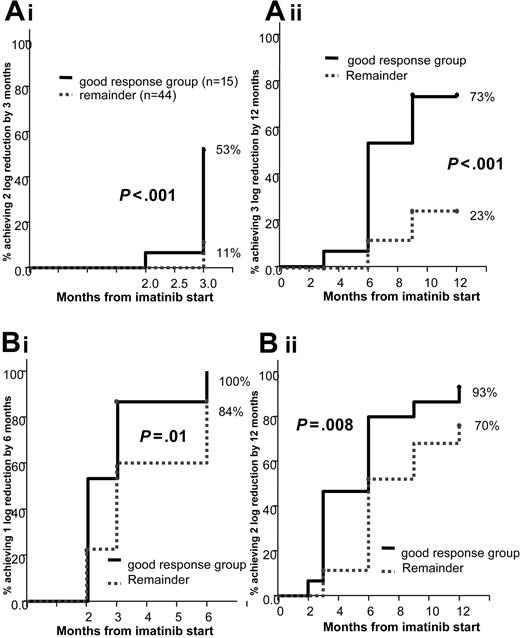
Grouping the patients with a low Sokal score and low IC50imatinib into one group (good prognosis group) and pooling the remaining patients revealed 57% of patients in the good prognosis group achieved a 2-log reduction by 3 months and 71% a 3-log reduction by 12 months. Of the remaining patients, only 11% achieved a 2-log reduction by 3 months and 24% a 3-log reduction by 12 months. The P value is highly significant (< .001) at all time points (Figure 6Ai-ii).
IC50imatinib and the prediction of suboptimal response
Eighty-six percent (31 of 36) of patients with a low IC50imatinib achieved a 1-log reduction by 6 months compared with 92% (24 of 26) with a high IC50imatinib (P > .05). Seventy-eight percent (28 of 36) of patients with a low IC50imatinib achieved a 2-log reduction by 12 months compared with 77% (20 of 26) in the high IC50imatinib group (P > .05), indicating that IC50imatinib was not on its own a predictor of poor response. The Sokal score was also not a predictor of suboptimal response with 93% (26 of 28) of patients with a low Sokal score achieving a 1-log reduction by 6 months compared with 84% (26 of 31) in the high Sokal group (P > .05). Eighty-six percent (24 of 28) of patients with a low Sokal score achieved 2-log reduction by 12 months compared with 68% (21 of 31) in the high Sokal group (P > .05).
Kaplan Meier graphs demonstrating the good response group versus the remainder of patients in the predicted achievement. The graphs show (Ai) 2-log reduction by 3 months and (Aii) 3-log reduction by 12 months, (Bi) 1-log reduction by 12 months, and (Bii) 2-log reduction by 12 months.
Kaplan Meier graphs demonstrating the good response group versus the remainder of patients in the predicted achievement. The graphs show (Ai) 2-log reduction by 3 months and (Aii) 3-log reduction by 12 months, (Bi) 1-log reduction by 12 months, and (Bii) 2-log reduction by 12 months.
IC50imatinib and Sokal score groups were then combined to determine whether the combination of poor prognostic indicators would elucidate those patients who fail to achieve any early molecular response. Dividing the high-risk Sokal group on the basis of IC50imatinib revealed no significant difference between the high Sokal/low IC50imatinib and high Sokal/high IC50imatinib groups in the probability of suboptimal response at 6 (high Sokal/low IC50imatinib, 74% [14 of 19]; high Sokal/high IC50imatinib, 100% [12 of 12]; P > .05) or 12 months (high Sokal/low IC50imatinib, 63% [12 of 19]; high Sokal/high IC50imatinib, 75% [9 of 12]; P > .05). However, dividing the low Sokal group into patients with low and high IC50imatinib demonstrated a significant difference between the 2 groups. Suboptimal response was significantly more prevalent in the patients with low Sokal score who had a high IC50imatinib than those with a low IC50imatinib. Fifteen percent of patients in the low Sokal/high IC50imatinib group failed to achieve a 1-log reduction by 6 months compared with no patients with a low Sokal/low IC50imatinib (P = .013). At 12 months 33% of patients in the low Sokal/high IC50imatinib group failed to achieve a 2-log reduction by 3 months in BCR-ABL compared with 7% of patients with low IC50imatinib (P = .032) (Table 2).
The incidence of suboptimal response was also significantly different between patients within the low Sokal/low IC50imatinib (good prognosis group) and the remaining patients. No patient in the good prognosis group failed to achieve a 1-log reduction in BCR-ABL by 6 months, whereas only 7% failed to achieve a 2-log reduction by 12 months. In the remainder of the patient pool, 16% failed to achieve a 1-log reduction in BCR-ABL by 6 months, and 30% failed to achieve a 2-log reduction by 12 months. The P value is significant at .01 and .008, respectively (Figure 6Bi-ii).
IC50imatinib and assessment of primary imatinib failure
Only 4 patients failed to achieve 1-log reduction by 12 months. Although statistics are not possible on such a small sample size, the median IC50imatinib was 0.47 μM (range, 0.375-0.6 μM), suggesting that IC50imatinib is not predictive of primary imatinib failure. Interestingly, all 4 patients fell within the poor prognostic Sokal group, a group known to perform less favorably irrespective of IC50imatinib as described in “IC50imatinib and the prediction of suboptimal response.” The median Sokal score for these 4 patients was 1.6 (range, 1.09-2.12). Five patients within this cohort developed secondary imatinib failure associated with the emergence of mutations within the adenosine triphosphate (ATP)— binding domain. There was no relationship between the development of mutations and the IC50imatinib, with 3 patients having low IC50imatinib and 2 with high IC50imatinib.
Correlation of IC50imatinib with baseline p-Crkl and BCR-ABL percentages
Because the IC50imatinib is a function of the decrease in the percentage of p-Crkl in response to in vitro imatinib, we assessed whether the actual percentage of p-Crkl at baseline influenced the IC50imatinib determination. The median percentage of p-Crkl was variable with a median of 56% and range of 23% to 80%. There was no correlation between the percentage of p-Crkl at baseline and the IC50imatinib (R2 = 0.08; P > .05). Comparison of the median percentage of p-Crkl in the low and high IC50imatinib groups revealed no significant difference (low IC50imatinib, 53% p-Crkl; high IC50imatinib, 57% p-Crkl; P > .05) A low percentage of p-Crkl did not predict achievement of either 2-log reduction by 3 months or 3-log reduction by 12 months. The percentage of p-Crkl at baseline did not split the Sokal groups into good and poor responders and was also not predictive of suboptimal imatinib response.
There was no correlation between baseline levels of BCR-ABL transcript and percentage of p-Crkl (R2 = 0.254; P > .05) or between the IC50imatinib and the baseline BCR-ABL level (R2 = 0.006; P > .05), The baseline level of BCR-ABL was not predictive of molecular response to 12 months (P > .05).
Chromosome 9 deletion status
The incidence of deletions of the long arm of the derivative chromosome 9 (9q-), associated with poor prognosis,32-34 was then assessed within the low and high IC50imatinib groups. Ten of the 47 evaluable patients were found to have a 9q-. There was no statistical difference in either the median IC50imatinib or the distribution of IC50imatinib between the deleted and nondeleted groups (P > .05).
Discussion
In this study we have demonstrated that in vitro sensitivity to imatinib, in patients with de novo CML, is a predictor of molecular response. Furthermore, the combination of IC50imatinib and Sokal score provides even stronger predictive value. Despite very promising clinical trials with imatinib,35 it is now clear that variability exists between patients in response to the therapy, even in chronic phase. Forty percent of patients with de novo chronic-phase CML achieved a 3-log reduction in BCR-ABL by 12 months, and these patients have a significantly better probability of progression-free survival.17 Identification of optimal responders prior to commencement of therapy will help identify patients who will respond well to standard imatinib therapy and those who will benefit from higher imatinib dosing, combination therapy, or transplantation.
Previous studies have shown that the Sokal prognostic score is predictive of molecular response in patients with CML treated with imatinib.31 Our analysis revealed that the Sokal score was a poor predictor of early response but was a statistically significant predictor of achievement of 3-log reduction by 12 months. No correlation was found between the IC50imatinib and the Sokal prognostic score, indicating they are independent predictors of response. Examination of their combined predictive power demonstrated that despite being in the low Sokal group, those patients with a high IC50imatinib have relatively poor responses. This is most notable in the achievement of 2-log reduction of BCR-ABL by 3 months, which was achieved in greater than 50% of patients with a low IC50imatinib and in no patients within the high IC50imatinib group. The IC50imatinib was not predictive in the high-risk Sokal group in which response was worse overall.
Although we have demonstrated that the IC50imatinib is a good predictor of optimal molecular response, it does not allow patients with suboptimal molecular response to be identified prior to therapy. Sokal score is also a poor predictor of suboptimal response. However, patients with a low IC50imatinib and low Sokal score demonstrated a substantially lower probability of suboptimal response.
The observation that the IC50imatinib is predictive of optimal response in the low-risk Sokal group and not in the high-risk group is intriguing. We speculate that in patients with low Sokal scores, BCR-ABL may be the only mutation event, providing a proliferative advantage to the leukemic clone. In this setting, sensitivity to kinase inhibition will be the critical variable dictating response. This is demonstrated clearly in the achievement of a greater than 2-log reduction by 3 months, where a low IC50imatinib may be essential. In patients with high Sokal scores, additional pathways may be activated that are not BCR-ABL dependent.36 Sensitivity to BCR-ABL kinase inhibition will be only one of several variables that determine response, and the prognostic effect of this variable may therefore be less evident.
This study assessed the intrinsic sensitivity of blood mononuclear cells. Thus, the assay may reflect the sensitivity of mature leukemic cells, which are the first cells depleted by imatinib. This may explain why the IC50imatinib is a stronger predictor of early molecular response, because the initial response is probably mediated by imatinib activity in mature leukemic cells. The response seen at 12 months and beyond reflects the sensitivity of more primitive cells that are maturing and entering circulation. In vitro sensitivity of this more primitive population may provide a better predictor of long-term response. One preliminary study, using a flow-based assay, has suggested that the imatinib-induced reduction in total phosphotyrosine levels in CD34+ cells is predictive of cytogenetic response.37
The wide range of IC50imatinib observed in patients with de novo CML is surprising. There was no evidence of mutations or polymorphisms in the kinase domain of BCR-ABL to explain this variability. It is possible that mutations or polymorphisms outside the kinase domain could be contributing. Another potential source of variation may arise from interpatient variability in the active transport of imatinib into and out of the cell. Imatinib is known to be a substrate for efflux proteins ABCG2 (ATP-binding cassette transporter G2) and ABCB1,38-40 drug transporters commonly associated with resistance to other chemotherapeutic agents.41-43 More recently one of the organic cation transporters (hOCT1) reported to be involved in imatinib influx has been implicated in imatinib resistance.44
We have demonstrated the predictive value of IC50imatinib in the context of a clinical trial in which increased doses of imatinib have been used and dose increases mandated for suboptimal response. It remains to be established whether the predictive power of IC50imatinib will be as strong for standard-dose imatinib.
The predictive power of in vitro imatinib sensitivity suggests that the actual level of BCR-ABL kinase inhibition achieved is important in determining response to imatinib, particularly in patients with low Sokal score. Furthermore, it suggests that BCR-ABL kinase inhibition is incomplete in most patients. Confirmation of these current findings in prospective studies of imatinib will be required to verify this assay as an important new prognostic test. It will be important to determine whether the same variability in intrinsic sensitivity is observed with the second generation inhibitors24,45 now entering phase 2 trials.
Prepublished online as Blood First Edition Paper, June 14, 2005; DOI 10.1182/blood-2005-03-1103.
Supported in part by a grant from the Cancer Council of Australia, with support from Novartis Australia.
The publication costs of this article were defrayed in part by page charge payment. Therefore, and solely to indicate this fact, this article is hereby marked “advertisement” in accordance with 18 U.S.C. section 1734.
We thank the hematologists J.F. Seymour, K. Taylor, S. Durrant, P. Browett, A. Schwarer, C. Arthur, J. Catalano, M. Leahy, R. Filshie, K. Bradstock, R. Herrmann, D. Joske, involved in the TIDEL trial, and their clinical staff who kindly provided blood samples, making this analysis possible. We would like to thank Kevin Lynch and Michael Copeman from Novartis Australia for their assistance with the organization of this study and for reviewing the manuscript. We are indebted to Novartis Oncology for the supply of imatinib mesylate. We acknowledge the contribution of Rebecca Lawrence and Chani Field in providing all BCR-ABL quantitative results, and the cytogenetics departments of both the IMVS and the St Vincent's Hospital in Melbourne for provision of the chromosome 9 deletion data. This research study was conducted as part of the TIDEL trial that is conducted by the Australasian Leukemia Lymphoma Group (ALLG) with support from Novartis Pharmaceuticals and Amgen. We are indebted to Dr John Reynolds and Dr Nancy Guzzo-Purnell for provision of patient details and dose data.

