Abstract
Early, low-risk International Prognostic Scoring System (IPSS) myelodysplastic syndrome (MDS) is a heterogeneous disorder where the molecular and cellular hematopoietic defects are poorly understood. To gain insight into this condition, we analyzed gene expression profiles of marrow CD34+ progenitor cells from normal-karyotype, low-blast-count MDS patients, age-matched controls, and patients with non-MDS anemia. Given the heterogeneity of early MDS, a surprisingly consistent finding was decreased expression of B-cell lineage–affiliated genes in MDS patients compared with healthy controls and 3 of 5 samples with non-MDS anemia. Both patients with non-MDS anemia with reduced B-cell gene expression were on chemotherapy. In 25 of 27 of the original samples and 9 further MDS samples, Taqman real-time polymerase chain reaction (PCR) confirmed these data. Flow cytometry on unfractionated marrow from independent samples also demonstrated reduced B-cell progenitors in MDS patients compared with healthy controls. These novel findings suggest a common perturbation in early MDS hematopoiesis. They also provide the rationale for a larger study to evaluate the diagnostic utility of reduced B-cell progenitor number as a diagnostic biomarker of early low-risk MDS, which can pose a diagnostic challenge.
Introduction
The myelodysplastic syndromes (MDS) are clonal disorders characterized by abnormal myeloid differentiation, increased bone marrow cellularity, and peripheral-blood cytopenias, with progression to acute myeloid leukemia (AML) occurring in 30% of cases.1,2 The median age of presentation is about 70 years, with an incidence of roughly 30 per 100 000 persons per year.3 The diagnosis is based on World Health Organization (WHO) criteria of abnormal myeloid differentiation in a minimum of 10% of nucleated cells in patients with an appropriate clinical history.4,5 The considerable clinical variability in the prognosis of MDS patients6,7 is reflected in the International Prognostic Scoring System (IPSS), which stratifies the risk of MDS into low (early) or high risk (advanced) on the basis of the number of cytopenias, karyotype, and blast percentage.7 In patients with abnormal karyotype or excess of blasts, the diagnosis is usually clear. However, in normal-karyotype early MDS the diagnosis relies on estimating the extent of dysplasia, which can be difficult because significant interobserver disparity in documenting dysplastic change exists.8 Moreover, many non-MDS disorders result in multilineage dysplasia. This highlights the need for a reliable biomarker to make a firm diagnosis of MDS in normal-karyotype low-risk disease and distinguish MDS from other causes of anemia and dysplasia.
The molecular and cellular basis of MDS is incompletely understood, but the available data can be encapsulated into 2 distinct but not necessarily mutually exclusive theories. The first, cell-extrinsic theory, suggests that a central feature in MDS is apoptosis driven by an autoimmune response and an altered, less supportive bone marrow stroma microenvironment.9-16 However, it is not clear if increased apoptosis is the primary event in early MDS or merely a pathophysiologic response to excessive progenitor-cell proliferation. The second, cell-intrinsic theory, hypothesizes that the primary abnormalities are genetic or epigenetic changes in key transcription factors,17-19 signal transduction pathway components,20,21 DNA repair machinery,22 and cell-cycle regulators,23 resulting in altered hematopoietic proliferation and differentiation. However, abnormalities in these genes are predominantly found in patients with high-risk but not low-risk disease.17-19,24
Analysis of marrow from MDS patients with chromosomal abnormalities has shown the abnormal karyotype is present in either the hematopoietic stem-cell (HSC) or early committed myeloid progenitor.25,26 In keeping with a stem/myeloid progenitor defect, there is reduced in vitro long-term culture-initiating cell activity27 and decreased numbers of erythroid, granulocyte, and megakaryocyte colonies.28,29
Given the heterogeneity of low-risk MDS, it is likely that the mode of pathogenesis will differ between individual patients. However, the functional consequence of bone marrow proliferation and dysplasia could alight on a final common pathway, which may allow detection of common changes among apparently disparate patients. In an attempt to reveal a common pathogenetic mechanism in early MDS, we compared the expression profiles in CD34+ cells from patients with a low blast count and normal karyotype with those from age-matched healthy controls and age-matched patients with anemia from causes other than MDS.
Patients, materials, and methods
Patient samples
The study was approved by the Thames Valley Multi-Centre Ethics Research Committee, United Kingdom, and by local research ethics committee at the institutions involved. All patients provided informed consent per the Declaration of Helsinki. Thirteen normal bone marrow samples were collected from age-matched controls undergoing total hip replacement for osteoarthritis (Table 1). Their medical histories were screened to exclude systemic disease or concurrent administration of drugs known to alter bone marrow function. Bone marrow samples were collected from 29 patients with primary MDS with IPSS scores 0 to 0.5. The diagnosis of primary MDS was based on clinical features along with bone marrow and peripheral-blood morphologic studies performed by 2 independent hematologists according to WHO criteria. Only patients with a normal karyotype were included. Five patients with non-MDS anemia were studied. They included 3 patients with anemia of chronic inflammation (ACI) secondary to rheumatoid arthritis. ACI was defined as anemia (hemoglobin [Hb] less than 110 g/L [11.0 g/dL]) in the context of normal or raised bone marrow iron stores with erythrocyte sedimentation rate (ESR) more than 100 mm/h and a normal hematinic profile. There was one patient each with folate deficiency and B12 deficiency. The diagnosis of deficiency was based on deficient serum levels of B12 and on folate and red-cell folate together with characteristic morphologic megaloblastic change on bone marrow aspirate slides. There was no significant difference in the ages of patients and controls (Tables 2 and 3).
CD34+-cell separation
Bone marrow was aspirated into RPMI medium (Sigma, Irving, United Kingdom) supplemented with 1:100 preservative-free heparin (Leo Pharmaceuticals, High Wycombe, United Kingdom). Bone marrow mononuclear cells were isolated by density gradient centrifugation using HISTOPAQUE 1077 (Sigma). Cells were washed twice in magnetic-activated cell separation (MACS) buffer (phosphate-buffered saline supplemented with 0.5% bovine serum albumin and 2 mM EDTA [ethylenediaminetetraacetic acid]). After incubation with immunoglobulin (Ig) Fc receptor blocking reagent and hapten-conjugated anti-CD34 antibody (Miltenyi Biotec, Bergisch Gladbach, Germany) for 15 minutes at 4°C, cells were washed twice and resuspended in 500 μL MACS buffer. Magnetically labeled cells were passed through a positive selection column (LS column; Miltenyi Biotec) in a magnetic field. After 2 column washes, the retained cells were eluted with 1 mL MACS buffer. The eluate was passed through a fresh column, washed twice, and eluted in 500 μL MACS buffer. Purity of CD34+ cells was determined by flow cytometry and was 85% to 99% with no difference in purity between samples from different patient and control groups.
cRNA synthesis and microarray hybridization
RNA from CD34+ cells was extracted using Tri-reagent (Sigma). The quantity and integrity of individual RNA samples was verified by capillary gel electrophoresis (Agilent, Palo Alto, CA). From 50 to 150 ng of RNA was amplified using 2 rounds of in vitro transcription using the smallsample RNA amplification protocol version 1.2 (Affymetrix, Santa Clara CA). Biotin-labeled cRNA was purified using the RNAeasy mini kit (Qiagen, Dusseldorf, Germany). Quality of cRNA was confirmed by capillary gel electrophoresis (Agilent). Oligonucleotide microarrays (U133A array; Affymetrix) were hybridized, washed, and stained. Images were acquired using a GeneArray scanner (Affymetrix).
Bioinformatic analysis
Image data were quantified with Microarray Software Suite version 5.0 (Affymetrix). Data from individual array experiments were discarded if the number of genes called present was less than 35% or if the 3′:5′ ratio for glyceraldehyde-3-phosphate dehydrogenase (GAPDH) was more than 5. Data were normalized by robust multiarray analysis (RMA30,31 in the software “R” [Stanford, CA]). Significance analysis and prediction analysis of microarrays (SAM and PAM) was performed in R. Neighborhood analysis was performed in Genescan software using published methods.32 Clusters of conditions and genes were identified by hierarchic clustering using Genespring version 6.0 software (Silicon Genetics, Redwood City, CA). Functional descriptions of genes were obtained from the Online Mendelian Inheritance in Man (OMIM) database of the National Center for Biotechnology Information (NCBI). Microarray data (accession no GSE2779) were deposited in the Gene Expression Omnibus (GEO) database of the NCBI.
Quantitative real-time RT-PCR
Relative expression levels and differences between normal, MDS, and non-MDS anemia were validated with the Taqman 5′ nuclease real-time reverse transcriptase–polymerase chain reaction (RT-PCR) assay (Applied Biosystems, Foster City, CA). Hypoxanthine phosphoribosyl-transferase 1 (HPRT1) and tyrosine 3-monooxygenase/tryptophan 5-monooxygenase activation protein, zeta polypeptide (YWHAZ) were used as internal controls. Taqman primer and probe sequences for POU2AF1, VPREB 1, PAX5, MME (CD10), IL-7 receptor, LEF1, CSFR 2A, CSFR 2B, and IL-3 receptor were purchased commercially (Applied Biosystems). Sequences for the probe and primers for CD24 were designed using Assay By Design service (Applied Biosystems) and are available upon request. Single-stranded cDNA was synthesized from 100 to 500 ng of total RNA using a Retroscript kit (Ambion, Austin, TX). Dilutions of cDNA were used as templates for real-time PCR reactions containing primers of either target genes or an internal control. Each PCR reaction was set up in 25 μL triplicates. Reactions were run on an ABI Prism 7700 sequence detection system (Applied Biosystems). The cycling conditions were 10-minute polymerase activation at 95°C followed by 40 cycles at 95°C for 15 seconds and 60°C for 60 seconds. Threshold cycle (Ct) values of the target genes were normalized to the internal control genes. Differential expression in early MDS samples relative to normal samples was calculated according to the 2–ΔΔCT method.33 The Mann-Whitney U test was used to assign a significance statistic for each group comparison. For clarity of presentation, the ΔCt values of individual samples were compared with the mean ΔCt value of the normal samples and multiplied by 1000 to give an arbitrary unit of expression.
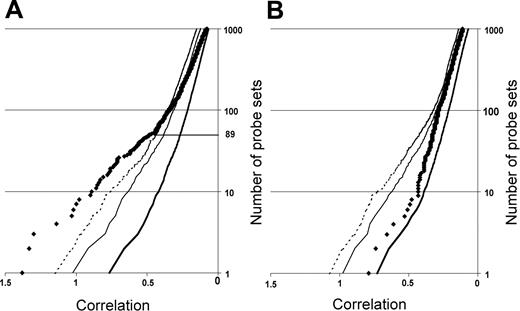
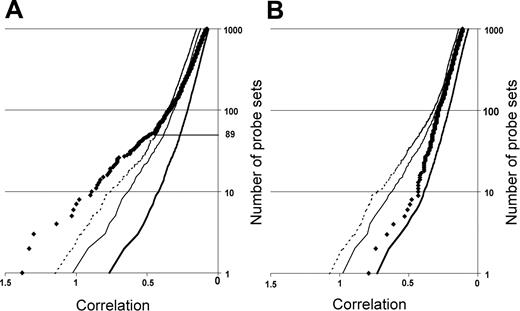
Neighborhood analysis of normal CD34+ cells versus early MDS CD34+ cells of the initial data set of 14 low-risk MDS and 9 healthy controls. The plot shows the number of probe sets predictive of MDS (black diamonds) versus normal together with curves showing the 50% (thick solid line), 5% (thin solid line), and 1% (dashed line) significance levels representing randomly permuted class distinctions. There is a less than 1 in 100 chance of probe sets to the left of the dashed line falsely predicting MDS. Eighty-nine underexpressed probe sets distinguish MDS from normal (A), whereas no overexpressed probe set in MDS can make the distinction between MDS and normal (B).
Neighborhood analysis of normal CD34+ cells versus early MDS CD34+ cells of the initial data set of 14 low-risk MDS and 9 healthy controls. The plot shows the number of probe sets predictive of MDS (black diamonds) versus normal together with curves showing the 50% (thick solid line), 5% (thin solid line), and 1% (dashed line) significance levels representing randomly permuted class distinctions. There is a less than 1 in 100 chance of probe sets to the left of the dashed line falsely predicting MDS. Eighty-nine underexpressed probe sets distinguish MDS from normal (A), whereas no overexpressed probe set in MDS can make the distinction between MDS and normal (B).
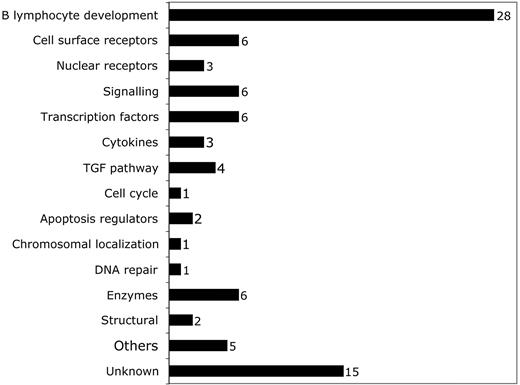
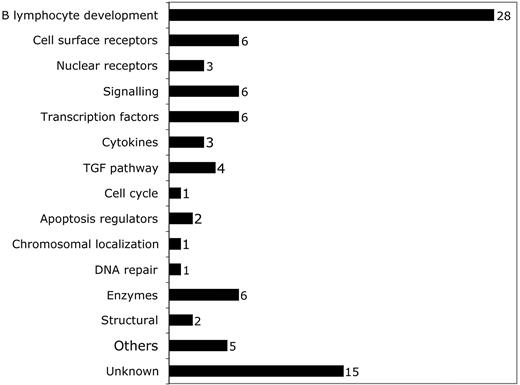
Breakdown of predictive probe sets by function according to OMIM citation. Probe sets corresponding to different functional categories of genes are shown. The number of probe sets in each category is shown to the right of the bar.
Breakdown of predictive probe sets by function according to OMIM citation. Probe sets corresponding to different functional categories of genes are shown. The number of probe sets in each category is shown to the right of the bar.
Flow cytometry
Fresh total bone marrow mononuclear cells were stained with a number of different antibody combinations. All cells were stained with fluoroscein isothiocyanate (FITC)–conjugated anti-CD34 (Miltenyi Biotec) and allophycocyanin (APC)–conjugated anti-CD19 (BD Pharmingen, San Diego, CA). As a third color, one of phycoerythrin (PE)–conjugated anti-CD24, anti-CD33 (BD Pharmingen), anti-CD10, or anti–interleukin-7 receptor (Dakocytomation, Glostrup, Denmark) was used. Isotype-matched FITC, APC, and PE mouse Ig's were used as negative controls. All samples were analyzed on a Cyan Flow cytometer (Dakocytomation).
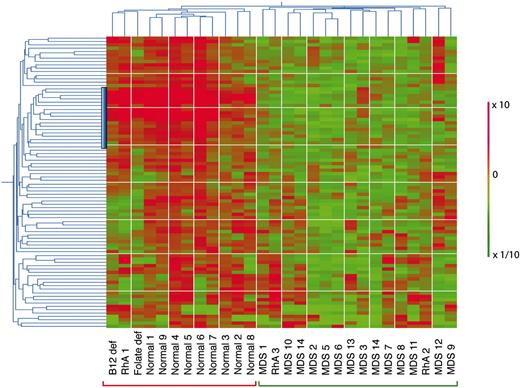
Hierarchic 2-way clustering of normal, MDS, and non-MDS anemia CD34+ cells using the predictive probe sets defined by neighborhood analysis. The initial data set of 14 low-risk MDS and 9 healthy controls was used in addition to that from 5 patients with non-MDS causes of anemia. Horiziontal clustering is by sample, and vertical clustering is by gene expression. Red bars indicate overexpression; green, underexpression; the vertical blue bar, the position of the lymphoid progenitor gene cluster.
Hierarchic 2-way clustering of normal, MDS, and non-MDS anemia CD34+ cells using the predictive probe sets defined by neighborhood analysis. The initial data set of 14 low-risk MDS and 9 healthy controls was used in addition to that from 5 patients with non-MDS causes of anemia. Horiziontal clustering is by sample, and vertical clustering is by gene expression. Red bars indicate overexpression; green, underexpression; the vertical blue bar, the position of the lymphoid progenitor gene cluster.
Results
Class prediction of normal versus early MDS and non-MDS anemia CD34+ cells
We first defined a set of genes predictive of early MDS by employing neighborhood analysis to an initial sample set of microarray data from purified CD34+ cells from 9 healthy donors and 14 early MDS patients. This revealed a pattern of expression predictive for MDS (Figure 1). Comparison of genes underexpressed in early MDS versus healthy controls showed 89 probe sets (corresponding to 80 genes) whose expression correlated with early MDS greater than would be expected by chance (Figure 1A). By contrast, no overexpressed genes were identified in early MDS that could reliably act as a class predictor (Figure 1B). A similar finding was seen with both SAM and PAM analysis (Figures S1 and S2, respectively, available at the Blood website; click on the Supplemental Figures link at the top of the online article). Overexpressed genes could be found on an individual sample basis, but none of these genes were common to all MDS samples. Of the 89 probe sets identified by neighborhood analysis, 28 (corresponding to 27 genes) are known to be important in B lymphocyte development (Table 3; Figure 2). Nine of the 10 most predictive genes (CD24, POU2AF1, VPREB 1, VPREB 3, CD79B, DNTT, PAX5, LEF1, and BACH1) have roles in B lymphopoiesis.
To determine how the 89 probe set predictor class set behaved with samples from patients with known causes of anemia other than MDS, we performed 2-way hierarchic clustering using results from the initial 9 normal and 13 early MDS samples together with expression profiles from CD34+ purified cells from 5 non-MDS anemia patients (Figure 3). Hierarchic clustering separated all 9 normal samples from all 14 MDS using this gene set. Of the non-MDS anemia samples, the patients with folate deficiency, B12 deficiency, and one of the patients with rheumatoid arthritis (RhA1) and anemia could be distinguished from MDS and represented as a subcluster that was different from normal. Two patients with rheumatoid arthritis (RhA2 and RhA3) were not distinguishable from MDS in this analysis. These 2 rheumatoid arthritis patients with anemia differed from patient RhA1 because both had been on long-term treatment with weekly oral methotrexate (1 year and 3 years, respectively) (Table 1).
Validation of the microarray data
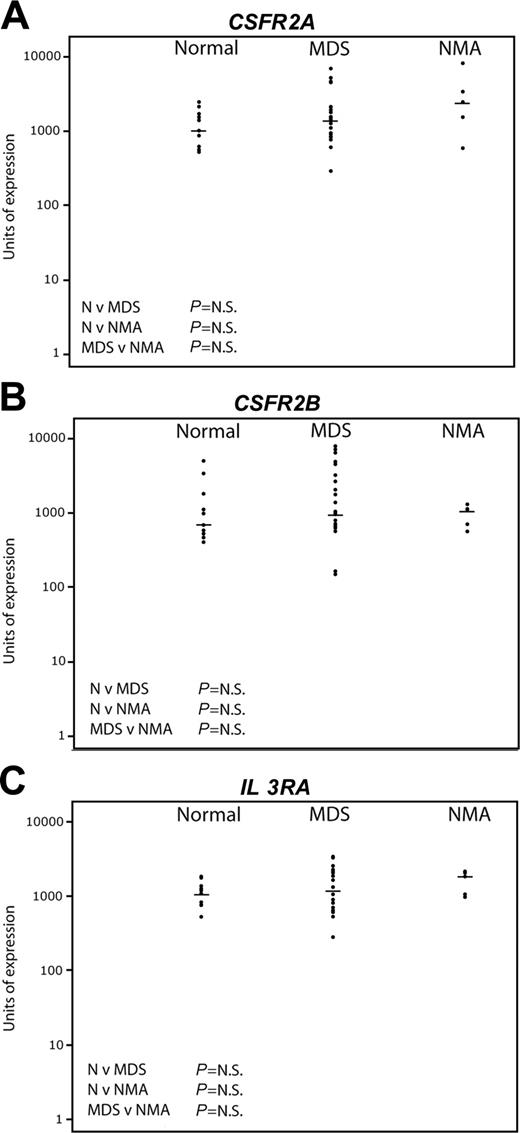
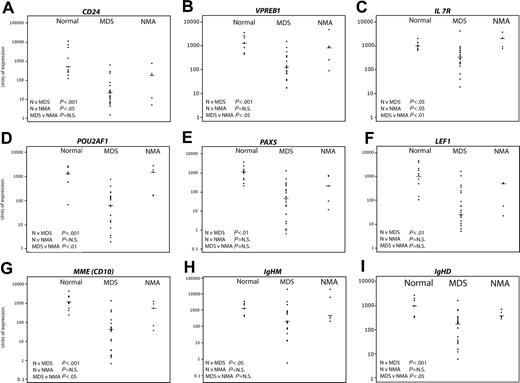
Given the limited amount of mRNA available, it was not feasible to perform the array experiments in replicates. Neighborhood analysis defined a relatively small number of probe sets underexpressed in MDS that included a number of genes specifically or mainly expressed in B lymphocytes. In addition, SAM had identified 2 further B lymphocyte genes, CD19 and IL-7 receptor (Figure S1). To validate the microarray data, we quantified mRNA expression levels using real-time Taqman PCR in the 9 normal and 13 of 14 early MDS samples and 5 patients with non-MDS anemia used for microarray together with samples from a new set of 9 early MDS patients (Table 1) that had not previously been analyzed by microarray. We chose to perform Taqman analysis on 9 genes expressed either exclusively or principally in B cells (CD24, POU2AF1, VPREB 1, PAX5, MME [CD10], IL-7 receptor, LEF1, IgHM, and IgHD). Data from the 9 controls, pooled data from 22 MDS patients, and 5 patients with non-MDS anemia are shown in Figure 4. Data from the original test set of MDS patients (n = 13) and the new validation set of 9 MDS patients are shown separately, together with expression data from the original 9 normal control samples in Supplemental Figure S3. As controls, we studied expression of 3 genes not differentially expressed on microarray analysis and principally expressed in myeloid progenitors (CSFR 2A, CSFR 2B, and IL-3 receptor (Figure 5; Figure S4).
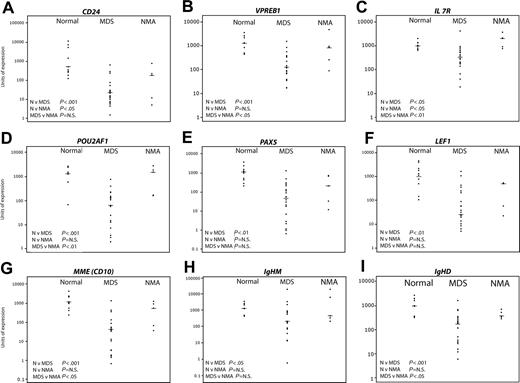
Validation of predictive genes by quantitative real-time PCR. Nine healthy controls, 22 MDS, and 5 non-MDS anemias were studied. The horizontal bars represent median values. Significance values are shown for the comparison of normal (N) versus MDS, N versus non-MDS anemia (NMA), and MDS versus NMA. Genes tested were CD24 (A), VPREB1 (B), IL7R (C), POU2AF1 (D), PAX5 (E), LEF1 (F), MME (CD10) (G), IgHM (H), and IgHD (I).
Validation of predictive genes by quantitative real-time PCR. Nine healthy controls, 22 MDS, and 5 non-MDS anemias were studied. The horizontal bars represent median values. Significance values are shown for the comparison of normal (N) versus MDS, N versus non-MDS anemia (NMA), and MDS versus NMA. Genes tested were CD24 (A), VPREB1 (B), IL7R (C), POU2AF1 (D), PAX5 (E), LEF1 (F), MME (CD10) (G), IgHM (H), and IgHD (I).
Despite variation in expression within each sample group, clear differences in expression were detectable between samples from patients with early MDS and healthy controls. Consistent with the ranking by correlation with early MDS by neighborhood analysis (Table 4), highly significant differences (7- to 15-fold reduction in median gene expression levels) between normal and early MDS were seen in expression of CD24 (Figure 4A), VPREB 1 (Figure 4B), POU2AF1 (Figure 4D), PAX5 (Figure 4E), LEF1 (Figure 4F), MME (CD10) (Figure 4G), IgHM (Figure 4H), and IgHD (Figure 4I). IL-7 receptor (Figure 4C), which was not detected by neighborhood analysis as a predictive gene, was also significantly underexpressed in MDS albeit at a lower significance level (about 2.5-fold reduction). Finally, the quantitative mRNA analysis in the original test set of MDS samples and the validation set were concordant except for expression of IgHM and interleukin-7 receptor (Figure S3).
When comparing MDS with the non-MDS anemia patients, there was significant down-regulation of VPREB 1, IL-7 receptor, POU2AF1, MME (CD10), and IgHD (Figure 4B, C, D, G, I, respectively) while the differences in expression of CD24, PAX5, LEF1, and IgHM (Figure 4A, E, F, and H, respectively) were not significant. The 2 non-MDS anemia samples with the lowest expression of B-cell genes were consistently RhA2 and RhA3, the 2 patients treated with long-term methotrexate. The significance level for the difference in expression of any gene between the MDS and the non-MDS anemia patients was principally determined by how low the expression of the gene was in patients RhA2 and RhA3. The median fold reductions for the significant genes were about 10-fold. Comparison of the healthy group with the non-MDS anemia patients showed significant underexpression of CD24 expression alone. Interestingly, IL-7 receptor expression was significantly increased relative to normal in non-MDS anemia patients (Figure 4C).
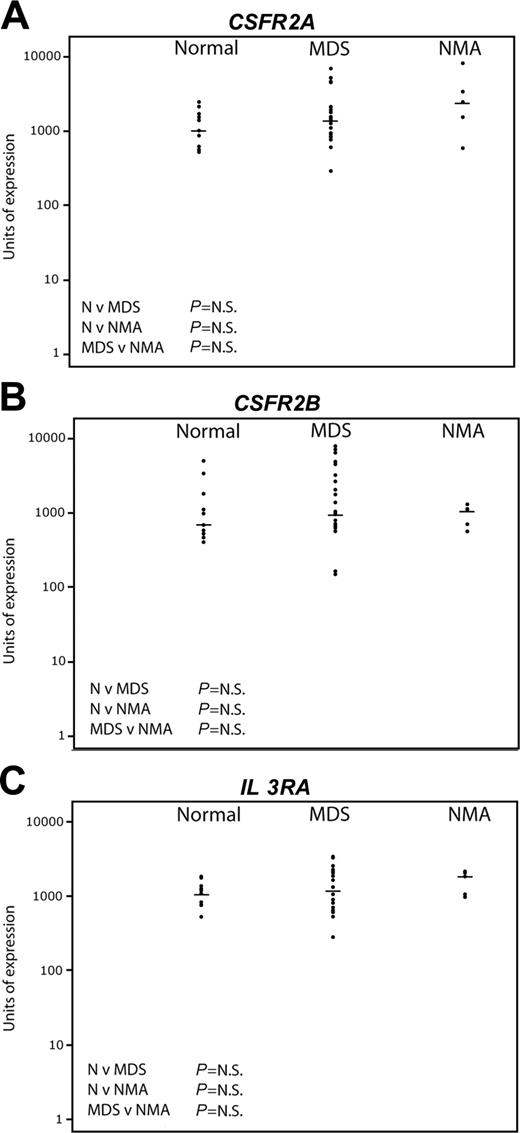
Pattern of expression of early myeloid genes by quantitative real-time PCR. The same sample set as in Figure 4 was used. The horizontal bars represent median values. Significance values are shown for the comparison of normal (N) versus MDS, N versus non-MDS anemia (NMA), and MDS versus NMA. Genes tested were CSFR2A (A), CSFR2B (B), and IL3RA (C).
Pattern of expression of early myeloid genes by quantitative real-time PCR. The same sample set as in Figure 4 was used. The horizontal bars represent median values. Significance values are shown for the comparison of normal (N) versus MDS, N versus non-MDS anemia (NMA), and MDS versus NMA. Genes tested were CSFR2A (A), CSFR2B (B), and IL3RA (C).
By contrast, Figure 5 shows the results of Taqman real-time PCR for the myeloid progenitor genes CSFR 2A, CSFR 2B, and IL-3 receptor. No significant differences were seen between the 3 groups. There was wider variation of expression among the MDS patients compared with normal, but there was no correlation either positively or negatively between the level of expression of the myeloid genes and any lymphoid gene (data not shown).
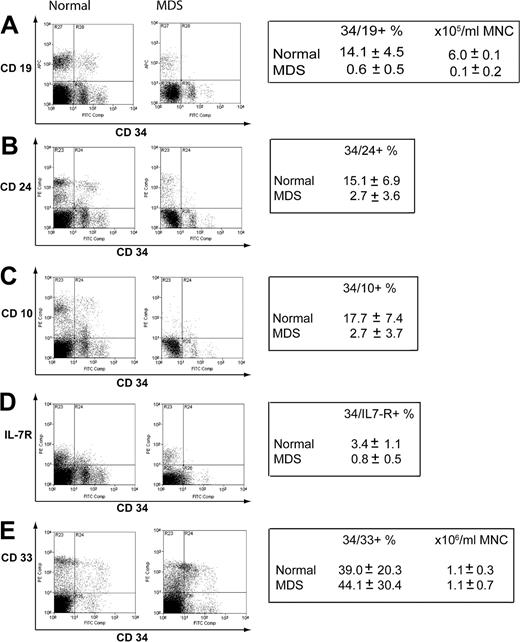
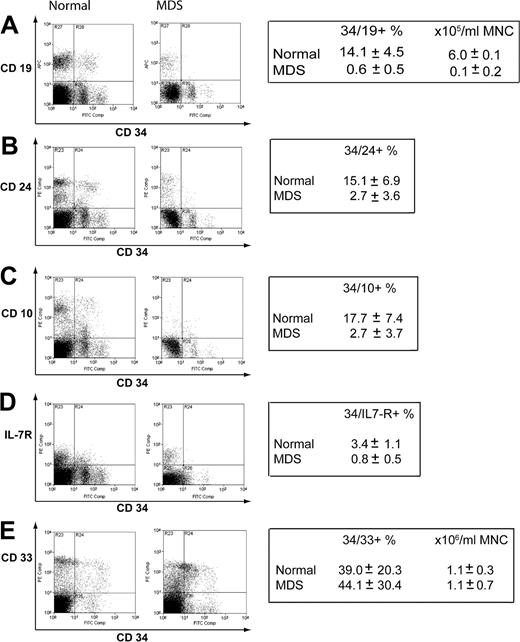
The mRNA expression data indicated that reduced expression of genes principally expressed in B-cell progenitors could be a feature of early MDS. To confirm this at the level of protein expression, we performed flow cytometry on an additional 6 normal samples and a further 7 new early MDS samples. The percentages of CD34+CD19+, CD34+CD24+, CD34+CD10+, and CD34+IL-7R+ cells were significantly reduced in early MDS compared with normal (Figure 6A-D). On CD34+ cells, there was a mean approximate 25-fold reduction in CD19, about 7-fold reduction in CD24, about 5-fold reduction in CD10, and about 6-fold reduction in interleukin-7 receptor (IL-7R) expression in the early MDS group compared with healthy controls. Of the CD34+CD19– compartment, a mean of 5.8% versus 0.7% of events were IL-7R positive for normal versus MDS, respectively (data not shown). There was no difference in expression of CD33 on CD34+ cells (Figure 6E), although like the myeloid mRNA expression data, there was wide variation between samples.
There was no difference in absolute total lymphocyte numbers between healthy controls and MDS patients (Tables 2, 3). We enumerated T and B cells by flow cytometry in a further 7 early MDS patients, 10 healthy controls, and 4 patients with rheumatoid arthritis, but no significant differences were present (Figure S5).
Discussion
We have used global mRNA expression profiling of CD34+ cells to determine if there are consistent biologic abnormalities and diagnostic biomarkers in early MDS. We only included normal-karyotype patients to minimize heterogeneity of expression profile secondary to chromosomal change. Because there is no “gold standard” diagnostic test, the definition of early MDS was necessarily based on a subjective, independently agreed upon assessment of bone marrow dysplasia by 2 hematologists. Nevertheless, in the absence of long-term follow-up, some patients may have had other causes of dysplasia. Samples were accrued from both large and small centers and are reflective of MDS practice in the United Kingdom.
To identify how the expression profile of early MDS differs from normality we used neighborhood analysis.32 Eighty-nine probe sets (corresponding to 80 genes) were predictive of the difference between normal and MDS CD34+ samples from age-matched study groups. This gene set is robust, because alternative bioinformatic approaches, SAM and PAM, revealed a similar profile. In addition, the 89 probe sets could clearly differentiate normality from MDS by 2-way hierarchic clustering. All 3 methods established a large set of B-cell genes with decreased expression in MDS CD34+ cells. We validated decreased expression of some of the 80 genes by real-time PCR and flow cytometry in fresh groups of patients.
There are at least 2 hypotheses to explain the difference in lymphoid gene expression. First, it is explicable by a reduction in absolute numbers of B lymphoid precursors rather than an excess of myeloid precursors in the MDS group. The second possibility is that the number of B-cell progenitors is unchanged but that they have abnormal (reduced) gene expression of many (if not most) B-cell genes. Although we have not formally excluded the latter, we favor the former given the number of B-cell genes that show reduced expression. However, we are also aware that the number of B-cell precursors in the marrow is small, and thus the margin of error in estimating the number of B-cell progenitors may be correspondingly wide. Data from a larger sample set will have to be obtained to more firmly establish if B-cell progenitor numbers are reduced.
One potential caveat of our study is that the control samples were taken from the femoral shaft of patients undergoing hip replacement whereas MDS patients had marrow taken from the iliac crest. It could be that the proportion of B-cell progenitors varies with anatomic site. However, the percentages of B-cell progenitors in our healthy controls are similar to those published.34,35
Assessment of protein expression of lymphoid and myeloid surface markers in normal and early MDSCD34+ cells. Mononuclear cells were stained for CD34 and a number of lymphoid or myeloid antigens. Representative plots are shown. The boxes indicate mean values ± standard deviation for 6 control samples and 7 early MDS samples used in the analysis. CD34/19 (A), CD34/24 (B), CD34/10 (C), CD34/IL-7R (D), CD34/33 (E).
Assessment of protein expression of lymphoid and myeloid surface markers in normal and early MDSCD34+ cells. Mononuclear cells were stained for CD34 and a number of lymphoid or myeloid antigens. Representative plots are shown. The boxes indicate mean values ± standard deviation for 6 control samples and 7 early MDS samples used in the analysis. CD34/19 (A), CD34/24 (B), CD34/10 (C), CD34/IL-7R (D), CD34/33 (E).
Consistent with our data, CD45loCD34+CD10+CD19+ B-cell progenitors are almost absent in about 90% of cases with refractory anemia.36 Similarly, others have noted that patients with 5q-syndrome have strikingly reduced frequencies of pro-B (CD34+19+) and “pro-T” (CD34+7+) cells compared with normal.25 Significant levels of apoptosis in bone marrow CD19+ cells in MDS patients with refractory anemia (RA), refractory anemia with ring sideroblasts (RARS), and refractory anemia with excess blasts (RAEB) compared with normal bone marrow have also been reported.37
To date, 4 published studies have profiled gene expression of MDS progenitors; 3 have included patients with low-risk disease.38-41 There are differences in the published results, probably reflecting variations in patient groups studied, arrays used, and bioinformatic analysis of the data. Ueda et al studied a small number of patients with low-risk MDS; they did not identify genes that were differentially expressed between normal control and low-risk MDS samples.41 However, they analyzed early AC133+ stem/progenitor cells, which do not contain CD34+CD19+CD10+ B-cell progenitors.42 Hofmann et al showed that altered expression of TACSTD2, UQCRC1, TNNC, and KDELR in CD34+ cells was predictive for low-risk MDS.39 In contrast to our MDS study group, 50% of the low-risk patients in the study by Hofmann et al had a cytogenetic abnormality. Moreover, few normal control samples were used. Given the variation in lymphoid gene expression seen in our normal control samples (Figure 4), using small numbers of control samples may potentially skew results. Lastly, Chen et al studied quite distinct groups of patients compared with our study—namely, those with monosomy 7 and trisomy 8.38 Monosomy 7 patients represent high-risk MDS whereas trisomy 8 patients were phenotypically heterogeneous (30% of patients having blast counts above 5%) and are distinctive with well-documented immune pathophysiology.43
These observations raise questions about the earliest compartment that is altered in size in early MDS. The reduction in CD34+CD19+ cells in early MDS patients would suggest a defect at the pro-B-cell stage44 or a stage earlier than the pro-B-cell, because we also find CD34+IL-7R+CD19– cells are reduced.45 However, because the earliest cell compartments in human B lymphopoiesis are poorly characterized, we have not determined if earlier lymphoid cells are involved. In contrast to the human, mouse early lymphomyeloid progenitors have been well characterized immunophenotypically.46 Because there are differences in immunophenotype in the early stem progenitor compartments between humans and mice, it may be difficult to directly extrapolate from mouse to human studies. Future work will be directed at more precisely identifying perturbations in the early lymphomyeloid progenitor compartments in early MDS marrow samples.
Other investigators have also addressed the question of which hematopoietic compartments contain the MDS clone by looking for karyotypic abnormalities in defined stem/progenitor populations.25,47 Pro-B-cell involvement has been shown for patients with 5q-syndrome and monosomy 7.25,48 Conversely, trisomy 8 has not been shown in the B progenitors,26 although this may reflect functionally defective HSCs in trisomy 8 MDS.49 In most cases, mature B lymphocytes are not part of the MDS clone, which has been taken to imply that the defect may be downstream of the stem cell in an early myeloid progenitor.25,50-55 However, our finding of the possibility of reduced B-cell progenitors raises an alternative possibility of stem-cell involvement in MDS. The failure of B-cell differentiation in MDS would then mean that peripheral mature B cells are derived from residual normal hematopoiesis.
Could an alteration in B-cell development be associated with myeloid abnormalities? A number of observations suggest that this could be the case. Murine germ-line mutations in the stromal-cell chemokine, CXCL12, and its hematopoietic-cell receptor, CXCR4, and in the transcription factors Ikaros and Pu.1 all have B-cell and myeloid abnormalities.56-60 Our expression data show decreased expression for CXCR4 (Table 4). Three isoforms of Ikaros are represented on the array; of these only one was expressed in CD34+ cells, and there was no differential expression of this isoform between normal and MDS. PU.1 was not expressed in either normal or MDS CD34+ cells in the array-based experiments.
Another explanation for decreased lymphoid gene expression is that there may have been an increase in lineage-biased HSCs, which generate reduced numbers of lymphoid progeny but instead give rise to myeloid progeny.61 Early MDS may represent one end of a spectrum of myeloid bias with abnormal differentiation being a consequence of restricted lineage choice. An epigenetic mechanism has been postulated for such myeloid bias.61 Epigenetically active agents such as 5-azacytidine are effective in MDS.62 One testable hypothesis for their activity may be that such agents improve the capacity of stem cells to give rise to lymphoid progeny, thus reducing myeloid bias.63
Lastly, our study provides pilot data that reduced B-cell progenitors, specifically reduced CD34+CD10+ or CD34+CD19+ numbers in a diagnostic marrow sample, may provide a diagnostic biomarker for early MDS. However, we have not established the specificity and sensitivity of this finding. For example, we could not distinguish the 2 patients with RhA on methotrexate from MDS patients, though, notably, treatment with methotrexate can be associated with dysplastic change. Furthermore, preliminary data from expression profiling CD34+ cells from only 10 patients with high-risk MDS indicates that, compared with healthy controls, some, but not all, B-cell genes show reduced expression. One caveat with these preliminary observations is that because the myeloid blast count is higher in high-risk MDS patients compared with healthy controls, reduced B-cell gene expression in the high-risk MDS patients may simply reflect this and not really provide insight into the basis of the altered hematopoiesis in more advanced MDS.
In conclusion, we have demonstrated that the B-cell progenitor compartment is abnormal in many patients with early MDS. This finding has implications for understanding the cell-fate decisions of MDS stem/progenitor cells. Our data also raise the possibility that early MDS can be defined by a B-cell progenitor defect. This could provide the basis for a diagnostically useful test. To test this hypothesis, a large multicenter study is required and is underway.
Prepublished online as Blood First Edition Paper, August 2, 2005; DOI 10.1182/blood-2005-04-1543.
Supported by a Clinical Fellowship from the Medical Research Council (MRC, United Kingdom) (A.S.) and a Wellcome Trust Senior Clinical Fellowship (P.V.).
The online version of the article contains a data supplement.
The publication costs of this article were defrayed in part by page charge payment. Therefore, and solely to indicate this fact, this article is hereby marked “advertisement” in accordance with 18 U.S.C. section 1734.
We thank Professors Doug Higgs and Tariq Enver for advice and Nicki Ventress for bioinformatics support. We thank Professor Jim Wainscoat and Dr Jackie Boultwood for fruitful discussions.

