The multidrug resistance 1 (MDR1) gene product P-glycoprotein (P-gp) is frequently implicated in cross-resistance of tumors to chemotherapeutic drugs. In contrast, acute promyelocytic leukemia (APL) cells do not express MDR1 and are highly sensitive to anthracyclines. The combination of ATRA and the novel histone deacetylase inhibitor (HDACI) depsipeptide (FK228) induced P-gp expression and prevented growth inhibition and apoptosis in NB4 APL cells subsequently exposed to doxorubicin (DOX). ATRA/FK228 treatment after exposure to DOX, however, enhanced apoptosis. Both agents, ATRA or FK228, induced MDR1 mRNA. This effect was significantly enhanced by ATRA/FK228 administered in combination, due in part to increased H4 and H3-Lys9 acetylation of the MDR1 promoter and recruitment of the nuclear transcription factor Y alpha (NFYA) transcription activator to the CCAAT box. Cotreatment with specific P-gp inhibitor PSC833 reversed cytoprotective effects of ATRA/FK228. G1 cell-cycle arrest and p21 mRNA induction were also observed in response to ATRA/FK228, which may restrict DOX-induced apoptosis of cells in G2 phase. These results indicate that epigenetic mechanisms involving NF-YA transcription factor recruitment and histone acetylation are activated by ATRA and HDACI, induce MDR1 in APL cells, and point to the critical importance of mechanism-based sequential therapy in future clinical trials that combine HDAC inhibitors, ATRA, and anthracyclines.
Introduction
Acute promyelocytic leukemia (APL) cells are highly sensitive to anthracyclines in part due to the lack of expression of the multidrug resistance 1 (MDR1) protein P-glycoprotein (P-gp).1,2 In this study, we investigated the effects of ATRA and FK228, alone and in combination, on the cytotoxicity of doxorubicin (DOX). Pretreatment by ATRA combined with FK228 prevented DOX-induced apoptosis in NB4 APL cells. However, when DOX treatment preceded ATRA/FK228, DOX-induced cell death was enhanced.
The MDR1 gene product P-gp functions as a transmembrane efflux pump for a variety of chemotherapeutic drugs, including anthracyclines,3-6 and overexpression of the MDR1 gene is a negative prognostic factor in acute myelogenous leukemias (AMLs).7 Numerous studies have reported the successful inhibition of P-gp function in vitro using cyclosporine A, PSC833, and other compounds.8-11 MDR1 gene expression can also be silenced, however, by epigenetic mechanisms involving histone deacetylases (HDACs) and DNA methyltransferases.12-16 For example, the nuclear transcription factor Y (NF-Y) heteromeric complex binds to the CCAAT core sequence in the promoters of a variety of eukaryotic genes, including human MDR1,12,16-18 and acts as a histone acetylation regulator and transcription activator.12,19
APL cells, which do not express MDR1, are associated with the oncogenic transcription factor PML-RARα that represses transcription of the genes encoding the RAreceptor targets through histone deacetylation. The PML-RARα chimeric protein, moreover, has been suspected to be the factor suppressing MDR1 through chromatin remodeling.20
A number of HDAC inhibitors (HDACIs) are currently being tested in clinical trials against a variety of cancers. Recently, there has been strong interest in HDACIs as anti-APL agents because of their synergistic activity with ATRA.21-24 In vivo data demonstrated that HDACIs can overcome resistance to ATRA therapy in APL.25 A novel HDACI FK228, a depsipeptide isolated from the fermentation broth of Chromobacterium violaceum,26 is one of the most attractive HDACIs because of its effectiveness at low concentrations.27,28 In this study, we investigated the effects of ATRA and FK228, alone and in combination, on the cytotoxicity of DOX by monitoring MDR1 mRNA and P-gp expression levels and the remodeling of MDR1 chromatin in APL cells. We report here that ATRA combined with FK228 prevented DOX-induced apoptosis in NB4 APL cells by inducing the MDR1 gene and P-gp expression partially through CCAAT box–associated histone acetylation. We also demonstrated up-regulation of p21WAF1 gene expression and cell-cycle arrest in the G1 phase by ATRA/FK228 in NB4 cells, which is consistent with previous reports of p21WAF1 up-regulation and cell-cycle arrest by HDACIs.29-33 This cell-cycle effect likely plays an additional role in the prevention of DOX-induced apoptosis. Hence, this study points to the critical sequence dependence of major components of APL therapy and should be considered in planning future clinical trials combining ATRA, DOX, and HDACIs.
Materials and methods
Reagents and cell cultures
The APL cell line NB4 was a gift from Dr Lanotte (INSERM, Paris, France).34 Kasumi-1 and Kasumi-6 cell lines were provided by Dr Asou (Hiroshima University, Hiroshima, Japan).35,36 All cell lines were maintained in RPMI-1640 medium containing fetal calf serum (10% for NB4, 20% for Kasumi-1 and Kasumi-6), 1% l-glutamine, and penicillin-streptomycin. For the Kasumi-6 cell line, 2 ng/mL GM-CSF was added. FK228 was obtained from Fujisawa Pharmaceutical (Osaka, Japan). Stock aqueous solutions of FK228 in dimethyl sulfoxide at 10 mM and ATRA (Sigma Chemical, St Louis, MO) in ethanol at 1 mM, both stored at -20°C, were diluted in culture medium prior to the in vitro exposure of cells. Cells were cultured at a density of 0.2 × 10⁶ cells/mL in the presence or absence of FK228 and ATRA with the indicated concentrations for 24 hours. After drug exposure, medium was changed and only ATRA was added again. Cells were treated with indicated concentration of DOX (American Pharmaceutical Partners, Los Angeles, CA) either synergistically or before or after 24 hours of FK228 and/or ATRA treatment.
Cell-viability assay
At 24 to 96 hours after drug exposure, viable cells were identified using the trypan blue dye exclusion method and counted in a 1-mm deep hemocytometer (Brightline Reichert, Buffalo, NY).
Flow cytometric analysis
At the indicated time points, the cell-cycle distribution was determined by flow cytometry of propidium iodide (PI)–stained nuclei. Briefly, cells were washed twice with phosphate-buffered saline (PBS), fixed in ice-cold ethanol (70% vol/vol in water), and stained with the PI solution (25 μg/mL PI, 180 U/mL RNase, 0.15% Triton X-100, and 30 mg/mL polyethylene glycol in 4 mM citrate buffer, pH 7.8; all from Sigma Chemical). The DNA content was determined using a FACScan flow cytometer (Becton Dickinson Immunocytometry Systems, San Jose, CA), and ModFit computer program (Verity Software House, Topsham, ME) was used for cell-cycle analysis. Cells with a sub-G1 DNA content were considered apoptotic.
For the PI/annexin V binding studies to analyze apoptosis, fresh cells were washed twice with binding buffer (10 mM HEPES, 140 mM NaCl, and 5 mM CaCl2, pH 7.4; all from Sigma Chemical) and stained with FITC-conjugated annexin V (Roche Diagnostic, Indianapolis, IN) for 15 minutes at room temperature. Annexin V fluorescence was determined using a Becton Dickinson FACScan flow cytometer, and the membrane integrity of the cells was simultaneously assessed by the PI exclusion method.
To determine the expression of P-gp, PE-conjugated anti–P-gp (Becton Dickinson) was used following the manufacturer's instructions. Background staining was determined using PE-conjugated isotype control IgG1 antibody. The flow cytometric data were analyzed using Cell Quest software (Becton Dickinson).
The rhodamine 123 (Rh123) efflux was assessed by analyzing cellular fluorescence after baseline (0.4 μM) dye uptake and after efflux in the presence/absence of PSC833 1 μM as described before.37
Kolmogorov-Smirnov (K-S) statistical analyses of data were performed to determine P-gp levels and efflux, and results were calculated as D values.7,10,37 K-S statistic is recognized to be useful in detection of low-level expression as occurs frequently in clinical samples and in clinically relevant cell lines,7,37,38 and we followed the descriptive categories for P-gp expression (bright, D ≥ 0.30; moderate, 0.20 ≤ D < 0.30; dim, 0.15 ≤ D < 0.20; negative, D < 0.15) and for efflux measurements (strong, D ≥ 0.40; moderate, 0.25 ≤ D < 0.40; dim, 0.20 ≤ D < 0.25; and negative, D < 0.20), as described.37 The mean channel fluorescence of P-gp, above the level of fluorescence of the cells stained with PE-conjugated isotype control antibody (IgG1) alone, was also recorded for each sample.
Quantitative real-time PCR
RNA was isolated using TRIZOL (Invitrogen, Carlsbad, CA). One microgram of total RNA template was used per 10 μL of reverse transcriptase reaction by avian myeloblastosis virus (AMV) reverse transcriptase (Roche Diagnostic) using hexanucleotide random primers at 42°C for 1 hour following the manufacturer's instructions. For quantitative real-time reverse transcriptase–polymerase chain reaction (RT-PCR), duplicate 1-μL samples of each cDNA were amplified as follows: 50°C for 2 minutes, 95°C for 10 minutes, 40 or 50 cycles at 95°C for 15 seconds, and 60°C for 60 seconds. The relative amount of gene expression was calculated using the expression of B2M as internal standard. Primers and probe sequences were as follows: MDR1 (GenBank accession no. M14758; nucleotides 2113-2202; forward primer [FP], 5′-AGAAAGCGAAGCAGTGGTTCA-3′; reverse primer [RP], 5′-CGAACTGTAGACAAACGATG-3′; probe, 5′-TGGATAAGGCCAGAAAAGGTCGGACCA-3′), p21 (GenBank accession no. L25610; nucleotides 185-244; FP, 5′-CGCTAATGGCGGGCTG-3′; RP, 5′-CGGTGACAAAGTCGAAGTTCC-3′; probe, 5′-ATCCAGGAGGCCCGTGAGCGA-3′), B2M (FP, 5′-AGCTGTGCTCGCGCTACTCT-3′; RP, 5′-TTGACTTTCCATTCTCTGCTGG-3′; probe, 5′-TCTTTCTGGCCTGGAGGGCATCC-3′).
The PCR cycle number that generated the first fluorescence signal above a threshold value (the threshold cycle [CT]) was determined. The threshold was calculated as a value 10 SDs above the mean fluorescence generated during the baseline cycles. A comparative CT method (2-ΔΔCT method) was used to detect relative gene expression.39-41 The following formula was used to calculate the relative amount of the transcript of interest in the treated sample (X) and the control (calibrator) sample (Y), both normalized to an endogenous reference (B2M) 2-ΔΔCT, where ΔCT is the difference in CT between the transcript of interest and B2M, and the ΔΔCT for sample X = ΔCT, X - ΔCT, Y. Untreated NB4 cells were used as the calibrator for all RT-PCR experiments. The CT data from duplicate PCRs in which the same cDNA was used were averaged before the 2-ΔΔCT was calculated.
Chromatin immunoprecipitation assay
The chromatin immunoprecipitation (ChIP) assay was performed following the manufacturer's instructions (Upstate Biotechnology, Lake Placid, NY). The cells were fixed with formaldehyde (final concentration, 1%), lysed, sonicated, and then immunoprecipitated by overnight incubation at 4°C with antiacetylated H3-Lys9 and antidimethylated H3-Lys9 (both antibodies from Upstate Biotechnology). PBS or rabbit IgG was added as a negative control. After immunoprecipitation, salmon sperm DNA beads (Upstate Biotechnology) were added and incubated for 1 hour at 4°C. The chromatin-antibody/beads complex was treated with RNase and proteinase K and maintained at 65°C for 6 hours to reverse the formaldehyde cross-links. The DNA input sample cross-links were reversed in a similar manner. Phenol/chloroform extraction and ethanol precipitation were used to extract DNA. For quantitative real-time PCR, primers and probes for analysis of the RARB P2 elements were designed by SYNTHEGEN (Houston, TX) with Primer Express software packaged with Applied Biosystems Model 7700 sequence detector (PE Applied Biosystems, Foster City, CA). Probes and primers were selected to include the proximal promoter where a large number of the described transcriptional response elements reside. The probes were labeled at the 5′ end with FAM and at the 3′ end with TAMRA, which served as a quencher. The amplification conditions were as follows: 50°C for 2 minutes, 95°C for 10 minutes, 50 cycles at 95°C for 15 seconds, and 60°C for 60 seconds. Primers and probe sequences were as follows: MDR1 promoter CCAAT box elements (GenBank accession no. X58723; nucleotides 1055-1134; FP, 5′-TTTGCCACAGGAAGCCTGA-3′; RP, 5′-AAAGGAAACGAACAGCGGC-3′; probe, 5′-TCGAGTAGCGGCTCTTCCAAGCTCAAAG-3′), MDR1 transcription initiation site (GenBank accession no. X58723; nucleotides 1308-1416; FP, 5′-GCGTGGATAGTGTGAAGTCCTCT-3′; RP, 5′-CATGGTCCAGTGCCACTACG-3′; probe, 5′-AGCTCCTGGAGCAGCGCCCAAA-3′), ANXA1 promoter elements (GenBank accession no. U25414; nucleotides 873-953; FP, 5′-TCACTTTGTTTTTGGACATAGCTGA-3′; RP, 5′-CCACACCTAGCAACCAGAAGTTAG-3′; probe, 5′-CCATGTACTTCAAACAGAAGGCAGCCAATT-3′). The abundance of each transcript of interest relative to that of negative control was calculated as follows: relative expression (RE) = 2ΔCT, where ΔCT is the difference in CT between the transcript of interest and negative control. The CT data from duplicate PCRs in which the same DNA was used were averaged before the RE was calculated.
Gel shift assay
The gel shift assay was performed as previously described, with minor modifications.42 Briefly, nuclear extracts were prepared from 1 × 10⁸ cells washed twice in ice-cold PBS, lysed in lysis buffer (10 mM HEPES-KOH, pH 7.9; 10 mM KCl; 0.2 mM EDTA; 1.5 mM MgCl2; 0.5% NP-40; 1 mM DTT; 1 mM PMSF; protease inhibitors [complete mini, Roche Diagnostic]) on ice for 10 minutes, and washed once in the same buffer without NP-40. The nuclear pellets were resuspended in 400 μL extraction buffer (10 mM HEPES-KOH, pH 7.9; 420 mM NaCl; 0.2 mM EDTA; 1.5 mM MgCl2; 25% glycerol; 1 mM DTT; 1 mM PMSF). After the cells were incubated on ice for 30 minutes, nuclei were removed by centrifugation, after which the resultant supernatants were collected. Nuclear extracts (4 μg) were mixed with a [α-32P]dCTP–labeled (ICN Biomedicals, Costa Mesa, CA) MDR1 probe; the double-stranded oligonucleotides 5′-gGTGAGGCTGATTGGCTGGGCAGGAc-3′ (-89 to -64 relative to the transcription initiation site [TIS], contains the CCAAT box, underlined,43 1 × 10⁵ counts per minute [cpm], 10-20 fmol) in 15 μL binding buffer containing 25 mM HEPES-KOH, pH 7.9; 0.01% NP-40; 1 mM DTT; 0.25 mg/mL bovine serum albumin; and 2 μg poly(dI-dC) poly(dI-dC) (Amersham Pharmacia Biotech, Cambridge, England) for 20 minutes at room temperature. The reaction mixtures were applied to a native 5% polyacrylamide gel in 0.5% × TBE at 100 V for 60 minutes at 4°C. The gel was dried, and signals were detected by BAS 2500 (Fuji Film, Tokyo, Japan). For the competition assay, a 30-times molar excess of unlabeled oligonucleotides was preincubated in the reaction mixture for 30 minutes on ice. For the antibody supershift experiments, 1 μg anti–NF-YA (CBF-B; Santa Cruz, Santa Cruz, CA) or normal goat IgG was added to the reaction mixture 30 minutes before the probe was added.
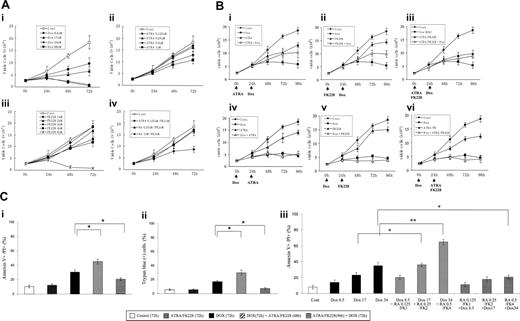
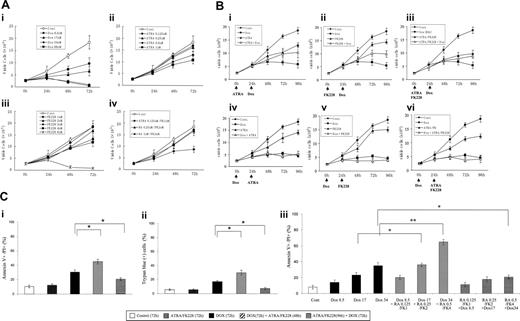
Sequence-dependent ATRA/FK228 effects on cytotoxicity of DOX in NB4 cells. (A) Dose-dependent inhibition of cell growth by DOX, ATRA, and FK228 in NB4 cells. NB4 cells were cultured in the presence of different concentrations of DOX (8.5, 17.0, 34.0, and 68.0 nM), ATRA (0.125, 0.25, 0.5, and 1.0 μM), and FK228 (1.0, 2.0, 3.0, 4.0, and 8.0 nM) for 72 hours. The effects on cell growth were determined by viable cell counts using trypan blue exclusion method. Graphs show the mean ± SD of results of 3 independent experiments. Cont indicates control. (B) Inhibition of cell growth depends on the sequence of DOX and FK228/ATRA treatment of NB4 cells. ATRA (1.0 μM), FK228 (3.0 nM), or their combination were either given 24 hours prior to DOX (17.0 nM) treatment (i-iii) or 24 hours after initiation of DOX therapy (iv-vi). The timing of each agent exposure is shown by arrows. The effects on cell growth were determined by cell counts. Graphs show the mean ± SD of results of 3 independent experiments. (C) Sequence-dependent ATRA/FK228 effects on cytotoxicity of DOX in NB4 cells. The effects on cytotoxicity of ATRA (1.0 μM), FK228 (3.0 nM), or their combination were either given 24 hours prior to DOX (17.0 nM) treatment or 24 hours after initiation of DOX therapy and were defined as the percentage of annexin V–positive flow cytometry analysis (i) or trypan blue–positive cells detected by cell count (ii). (iii) ATRA (0.125, 0.25, and 0.5 μM) and FK228 (1.0, 2.0, and 4.0 nM) were given at a fixed ratio either 24 hours prior to DOX (8.5, 17.0, and 34.0 nM) treatment or 24 hours after initiation of DOX therapy. The pharmacologic interactions between 3 agents were analyzed by isobologram analysis using Calcusyn software (Table 1). Total time of DOX treatment was 72 hours in all experiments. The effects on cytotoxicity were defined as the percentage of annexin V–positive cells detected by flow cytometry analysis. Graphs show the mean ± SD of results from 3 independent experiments. Statistically significant differences were determined by ANOVA and Fisher post hoc tests (*P < .05).
Sequence-dependent ATRA/FK228 effects on cytotoxicity of DOX in NB4 cells. (A) Dose-dependent inhibition of cell growth by DOX, ATRA, and FK228 in NB4 cells. NB4 cells were cultured in the presence of different concentrations of DOX (8.5, 17.0, 34.0, and 68.0 nM), ATRA (0.125, 0.25, 0.5, and 1.0 μM), and FK228 (1.0, 2.0, 3.0, 4.0, and 8.0 nM) for 72 hours. The effects on cell growth were determined by viable cell counts using trypan blue exclusion method. Graphs show the mean ± SD of results of 3 independent experiments. Cont indicates control. (B) Inhibition of cell growth depends on the sequence of DOX and FK228/ATRA treatment of NB4 cells. ATRA (1.0 μM), FK228 (3.0 nM), or their combination were either given 24 hours prior to DOX (17.0 nM) treatment (i-iii) or 24 hours after initiation of DOX therapy (iv-vi). The timing of each agent exposure is shown by arrows. The effects on cell growth were determined by cell counts. Graphs show the mean ± SD of results of 3 independent experiments. (C) Sequence-dependent ATRA/FK228 effects on cytotoxicity of DOX in NB4 cells. The effects on cytotoxicity of ATRA (1.0 μM), FK228 (3.0 nM), or their combination were either given 24 hours prior to DOX (17.0 nM) treatment or 24 hours after initiation of DOX therapy and were defined as the percentage of annexin V–positive flow cytometry analysis (i) or trypan blue–positive cells detected by cell count (ii). (iii) ATRA (0.125, 0.25, and 0.5 μM) and FK228 (1.0, 2.0, and 4.0 nM) were given at a fixed ratio either 24 hours prior to DOX (8.5, 17.0, and 34.0 nM) treatment or 24 hours after initiation of DOX therapy. The pharmacologic interactions between 3 agents were analyzed by isobologram analysis using Calcusyn software (Table 1). Total time of DOX treatment was 72 hours in all experiments. The effects on cytotoxicity were defined as the percentage of annexin V–positive cells detected by flow cytometry analysis. Graphs show the mean ± SD of results from 3 independent experiments. Statistically significant differences were determined by ANOVA and Fisher post hoc tests (*P < .05).
Statistical analysis
The results are expressed as the mean plus or minus standard deviation (SD). Statistical analysis was performed using analysis of variance (ANOVA) and Fisher post hoc tests, and a P of less than .05 was considered statistically significant. To compare the mean cell counts for the various treatment groups over time in the experiments for treatment sequence–dependent effects of DOX/ATRA/FK228, we performed a repeated-measures ANOVAwith 5 time points and treatment and replicate as factors in the model. To control the experiment-wise type I error rate (false-positive rate), we used a Bonferroni correction to the significance level for each of these comparisons.
Synergism, additive effects, and antagonism were assessed with the Chou-Talalay method44 and Calcusyn software (Biosoft, Ferguson, MO); the combination index (CI) for each experimental combination was calculated. CI values indicate the following: 0.3-0.7, synergism; 0.7-0.85, moderate synergism; 0.85-0.9, slight synergism; 0.9-1.1, nearly additive; 1.1-1.2, slight antagonism; 1.2-1.45, moderate antagonism; 1.45-3.3, antagonism; 3.3-10, strong antagonism.44
Results
Difference in apoptosis induction and growth inhibition depends on the sequence of DOX and ATRA/FK228 treatment of NB4 cells
NB4 cells were exposed to incremental concentrations of DOX (8.5, 17.0, 34.0, and 68.0 nM), ATRA (0.125, 0.25, 0.5, and 1.0 μM), and FK228 (1.0, 2.0, 3.0, 4.0, and 8.0 nM) for 76 hours. The dose-dependent effects of each agent on the growth of NB4 cells were determined by cell counts at 24, 48, and 72 hours and shown by comparison with the growth curve of controls (Figure 1A). DOX at 17.0 nM, ATRA at 1.0 μM, and FK228 at 3.0 nM induced significant growth inhibition (DOX, P = .004; ATRA, P = .01; FK228, P = .03 compared with control cells at 72 hours; a statistically significant difference was determined by ANOVA and Fisher post hoc tests; Figure 1A). The ATRA (1.0 μM)/FK228 (3.0 nM) combination significantly enhanced growth inhibition by FK228 (3.0 nM; P = .03) but not of ATRA (1.0 μM).
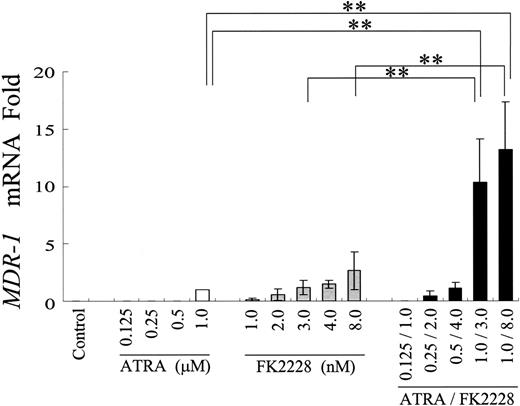
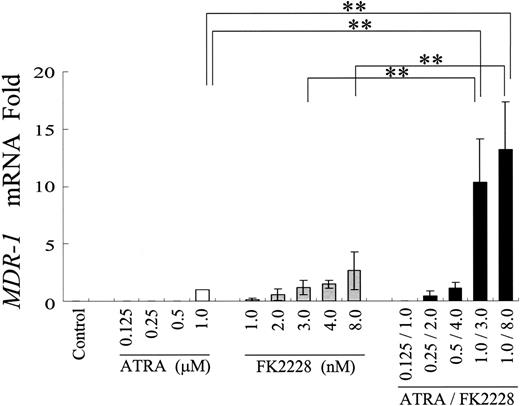
ATRA and FK228 have combined effects on MDR1 mRNA induction in NB4 cells. Induction of MDR1 mRNA expression in NB4 cells treated with the indicated agents at different concentrations. MDR1 mRNA expression in each sample was normalized to B2M mRNA expression. ATRA-treated cells were used as the calibrator (MDR1 mRNA level in ATRA-treated NB4 cells = 1) because of the lack of detectable MDR1 mRNA expression in control NB4 cells. Graphs show the mean ± SD of results from 3 independent experiments. A statistically significant difference derived from the fold-increase numbers was determined by ANOVA and Fisher post hoc tests (**P < .05).
ATRA and FK228 have combined effects on MDR1 mRNA induction in NB4 cells. Induction of MDR1 mRNA expression in NB4 cells treated with the indicated agents at different concentrations. MDR1 mRNA expression in each sample was normalized to B2M mRNA expression. ATRA-treated cells were used as the calibrator (MDR1 mRNA level in ATRA-treated NB4 cells = 1) because of the lack of detectable MDR1 mRNA expression in control NB4 cells. Graphs show the mean ± SD of results from 3 independent experiments. A statistically significant difference derived from the fold-increase numbers was determined by ANOVA and Fisher post hoc tests (**P < .05).
We then tested the effects of the ATRA/FK228 combination on DOX-induced cytotoxicity in NB4 cells. As shown in Figure 1Bi-iii, when cells were pretreated by ATRA, FK228, or their combination for 24 hours prior to exposure to DOX for 72 hours, cells continued to grow, in effect rendering DOX ineffective. To compare the mean cell counts for the various treatment groups over time we performed a repeated-measures ANOVA with 5 time points and treatment and replicate as factors in the model. From this model, we compared each treatment to all the other treatments at each time point after time 0. Since there were 15 treatments, we made 105 comparisons at each of 4 time points. So we used a significance level of 0.05/(105 × 4) = 0.000 12 for each comparison of one treatment with another at each time point after time 0. The ANOVA analysis revealed that at 24 hours, none of these 6 treatment groups are significantly different from one another with respect to mean cell count, whereas at 48 hours, mean cell numbers were significantly lower in the doxorubicin followed by FK228 3 nM group compared with the FK 3 nM followed by doxorubicin group. At 72 hours and 96 hours, the treatment groups with doxorubicin followed by either FK 3 nM, ATRA 1 μM, or ATRA/FK228 had lower mean cell counts than their counterparts where doxorubicin is given as the second treatment in the combination at the 0.000 12 significance level.
These observations were concordant with measurements of cytotoxicity that showed sequence-dependent ATRA/FK228/DOX effects (Figure 1C). The ATRA (1.0 μM)/FK228 (3.0 nM) combination did not induce significant increase in annexin V–positive (Figure 1Ci) or trypan blue–positive (Figure 1Cii) cells compared with controls at 72 hours. The cytotoxicity of DOX (used at 17.0 nM) was significantly enhanced by 48-hour treatment of ATRA/FK228 when given 24 hours after DOX exposure, whereas a 24-hour exposure to ATRA/FK228 prior to DOX significantly inhibited cytotoxicity of DOX.
Isobologram analysis using a fixed-ratio experimental design (time point of 72 h of DOX exposure) demonstrated an additive or a synergistic induction of cell death when cells were either pretreated with DOX for 24 hours followed by ATRA/FK228 or treated with the ATRA/FK228/DOX combination simultaneously, whereas the 24-hour ATRA/FK228 pretreatment followed by DOX showed strong antagonism (CI > 2.0; Figure 1Ciii; and Table 1).
ATRA/FK228 induces MDR1 mRNA through H4 and H3L9 acetylation and recruitment of NF-YA to the CCAAT box in the MDR1 promoter
We first hypothesized that ATRA/FK228 reduces DOX cytotoxicity by inducing MDR1. To test this hypothesis, the effects of ATRA/FK228 on MDR1 mRNA expression in NB4 APL cells was investigated by TaqMan RT-PCR (Figure 2). Results indicate that 1 μM ATRA induced MDR1 mRNA expression in the MDR1-negative NB4 cells (CT = 33.6 ± 0.8). FK228 alone also induced MDR1 mRNA in a dose-dependent fashion, and combination with ATRA further increased ATRA-induced MDR1 mRNA. In the 2 MDR1 gene–expressing AML cell lines, Kasumi-1 (AML1/ETO positive) and Kasumi-6 (AML1/ETO negative), ATRA (1.0 μM) or FK228 (3.0 nM) alone also increased MDR1 mRNA expression, and this was enhanced by combination (fold increase compared with untreated control: Kasumi-1, ATRA 5.6 ± 1.0, FK228 4.4 ± 0.7, ATRA/FK228 8.3 ± 0.8; Kasumi-6, ATRA 9.6 ± 1.4, FK228 5.2 ± 1.3, ATRA/FK228 15.0 ± 3.5, n = 3).
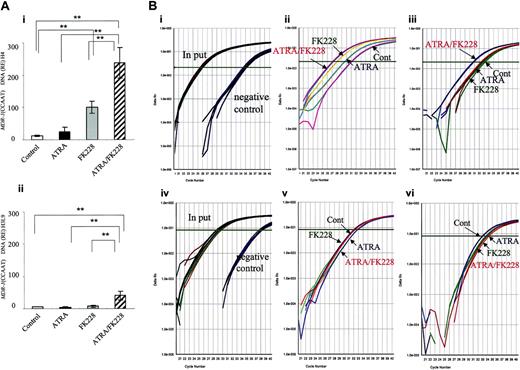
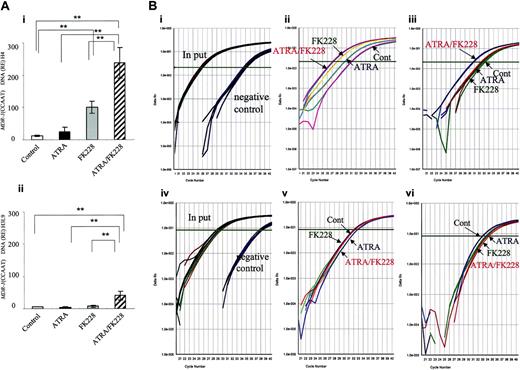
ATRA/FK228 increase H4 and H3-Lys9 acetylation in the MDR1 promoter (CCAAT region) in NB4 cells. (A) The data shown are derived from TaqMan PCR analyses of ChIP assays, as described in “Chromatin immunoprecipitation assay.” Chromatin from NB4 cells treated with ATRA (1.0 μM) and/or FK228 (3.0 nM) for 24 hours was immunoprecipitated with an antibody against acetylated H4 (i) and H3-Lys9 (ii) and analyzed by TaqMan PCR using probes and primers corresponding to the MDR1 promoter (CCAAT region). The graph shows the mean ± SD of representative data from 3 independent ChIP assays. A statistically significant difference was determined by ANOVA and Fisher post hoc tests (**P < .05). (B) Real-time TaqMan PCR profiles of MDR1 promoter (CCAAT region) amplification shown by examples of ChIP assays. (i) The input curve shows the total genomic DNA before immunoprecipitation. The negative control curve shows the results of chromatin immunoprecipitations using PBS. Representative profiles of acetylated H4 (ii) and H3-Lys9 (iii) are shown by examples. (iv-vi) Real-time TaqMan PCR profiles of ANXA1 promoter amplification in the same sample of subpanels i-iii shown as a negative control for ChIP assays. (iv) Input and negative control, (v) acetylated H4, (vi) acetylated H3-Lys9.
ATRA/FK228 increase H4 and H3-Lys9 acetylation in the MDR1 promoter (CCAAT region) in NB4 cells. (A) The data shown are derived from TaqMan PCR analyses of ChIP assays, as described in “Chromatin immunoprecipitation assay.” Chromatin from NB4 cells treated with ATRA (1.0 μM) and/or FK228 (3.0 nM) for 24 hours was immunoprecipitated with an antibody against acetylated H4 (i) and H3-Lys9 (ii) and analyzed by TaqMan PCR using probes and primers corresponding to the MDR1 promoter (CCAAT region). The graph shows the mean ± SD of representative data from 3 independent ChIP assays. A statistically significant difference was determined by ANOVA and Fisher post hoc tests (**P < .05). (B) Real-time TaqMan PCR profiles of MDR1 promoter (CCAAT region) amplification shown by examples of ChIP assays. (i) The input curve shows the total genomic DNA before immunoprecipitation. The negative control curve shows the results of chromatin immunoprecipitations using PBS. Representative profiles of acetylated H4 (ii) and H3-Lys9 (iii) are shown by examples. (iv-vi) Real-time TaqMan PCR profiles of ANXA1 promoter amplification in the same sample of subpanels i-iii shown as a negative control for ChIP assays. (iv) Input and negative control, (v) acetylated H4, (vi) acetylated H3-Lys9.
Because MDR1 gene expression is reported to be silenced by HDAC12,45 and the PML-RARα chimeric protein is suspected to be the factor that suppresses MDR1 through chromatin remodeling,20 we next hypothesized that the synergistic effect of ATRA/FK228 on MDR1 gene reactivation is due to histone acetylation. As shown in Figure 3, ATRA/FK228 potentiated H4 acetylation in the MDR1 promoter (CCAAT box region) induced by ATRA and FK228 alone (Figure 3Ai,Bii). On the H3-Lys9 locus, however, only ATRA/FK228, not ATRA or FK228 alone, induced acetylation (Figure 3Aii,Biii). We confirmed that ATRA and FK228 also promoted histone acetylation in the TIS of the MDR1 gene as it does in the CCAAT box region (relative expression: H4 acetylation, control 6.2 ± 2.3, ATRA 16.9 ± 6.8, FK228 55.2 ± 14.3, ATRA/FK228 111.9 ± 22.8, P < .02 compared with control; H3-Lys9 acetylation, control 2.1 ± 0.7, ATRA 3.3 ± 1.2, FK228 4.2 ± 1.1, ATRA/FK228 16.7 ± 7.1, P < .02). As a negative control, no induction of histone acetylation was observed in the promoter region of ANXA1, which is not transcriptionally activated by ATRA and/or FK228 in NB4 cells (Figure 3Biv-vi).
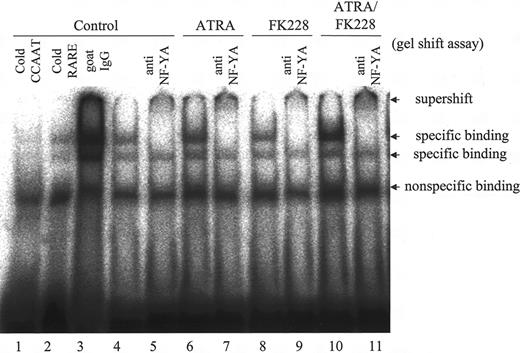
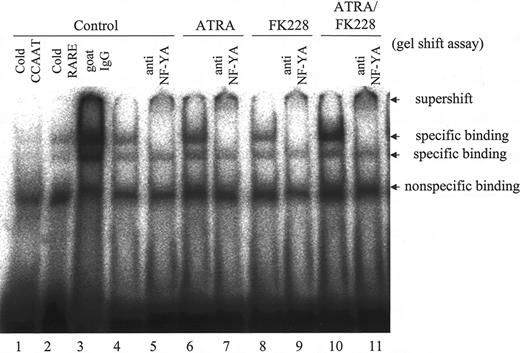
We further performed gel shift assays to determine whether ATRA and/or FK228 recruits the CCAAT box–binding protein NF-YA,46,47 which has been reported to mediate the activation of MDR1 by the HDACI,12,16 to the CCAAT box in the MDR1 promoter region in NB4 cells. As shown in Figure 4, ATRA moderately increased the specific binding of NF-YA to CCAAT, and ATRA/FK228 further enhanced the binding, which was supershifted when anti–NF-YA antibody was added.
ATRA/FK228 induces P-gp protein expression and the P-gp inhibitor PSC833 reverses cytoprotective effects of ATRA/FK228
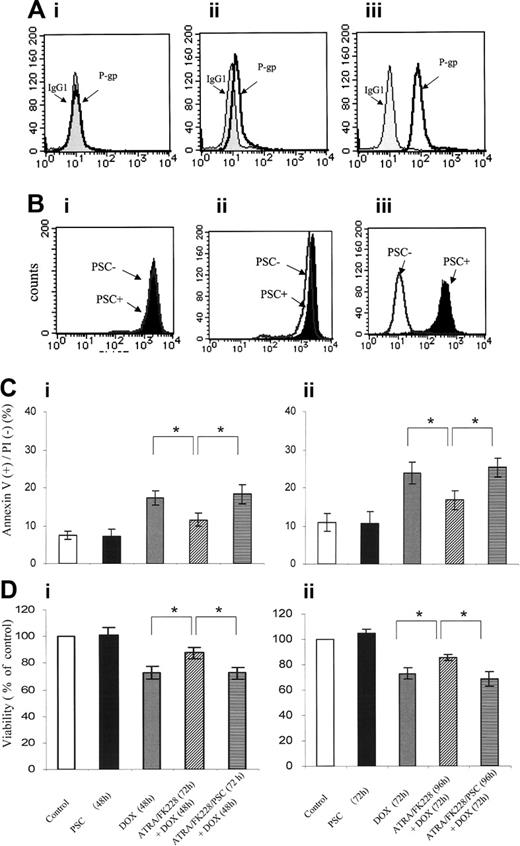
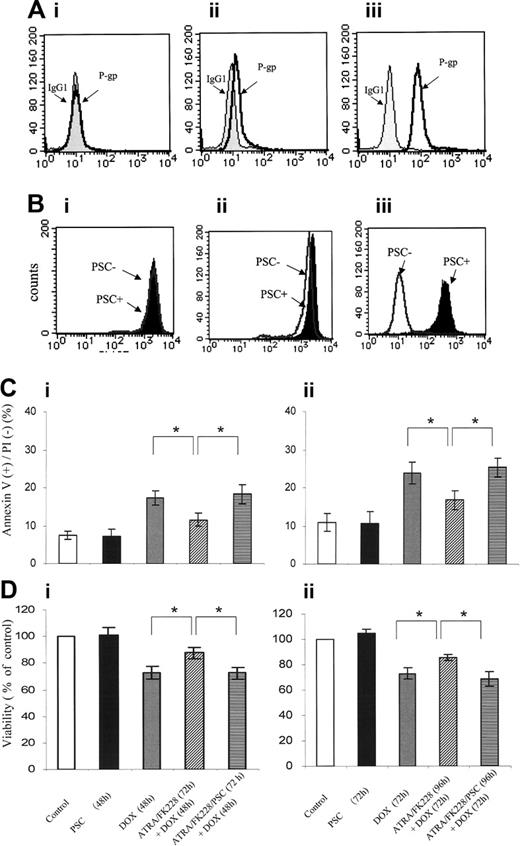
NB4 cells lack any detectable P-gp expression (D value = 0.09 ± 0.03 compared with isotype control). Cytofluorometric analysis confirmed that P-gp expression was increased in ATRA (1 μM)/FK228 (3 nM)–treated NB4 cells, with K-S analysis showing D values of 0.41 ± 0.06 (compared with P-gp histogram of control cells that superimposed IgG isotypic control) and mean fluorescence intensity (MFI) of 14.8 ± 1.1 (P = .04 compared with control; Figure 5A). No significant increase in P-gp was detected in NB4 cells treated with ATRA or FK228 alone (data not shown).
To assess P-gp function by ATRA/FK228, we next measured Rh123 dye efflux and the effects of the P-gp–specific inhibitor PSC833 in ATRA/FK228-treated NB4 cells. While no efflux was detected in parental NB4 cells (D = 0.08± 0.04), PSC833-inhibitable efflux was observed in ATRA/FK228-treated cells (D = 0.23 ± 0.06; Figure 5B), which was consistent with functional P-gp induction. Furthermore, the P-gp–specific inhibitor PSC833 partially reversed cytoprotective effects of ATRA/FK228 (Figure 5C-D).
ATRA/FK228 induces p21 and G0/G1 cell-cycle arrest
Since both ATRA and FK228 diminished DOX-induced cytotoxicity when used alone, but did not significantly modulate P-gp expression, we suspected that additional mechanisms of inhibition of DOX-induced apoptosis by ATRA/FK228 are operational in NB4 cells.
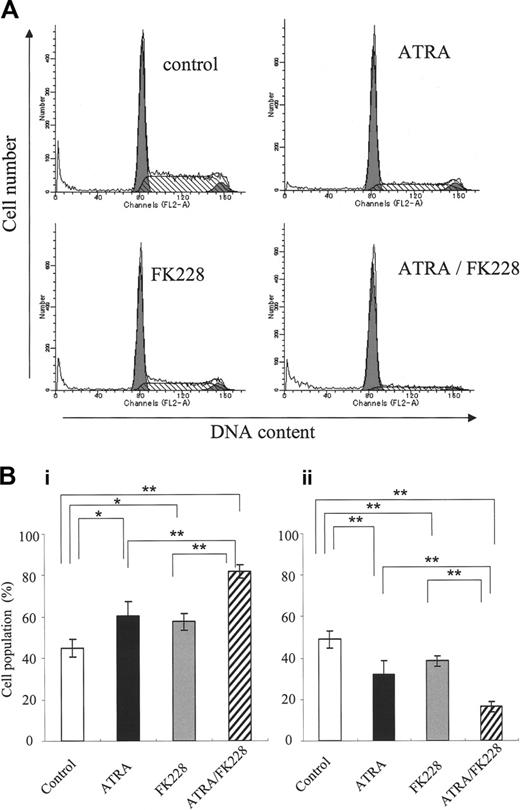
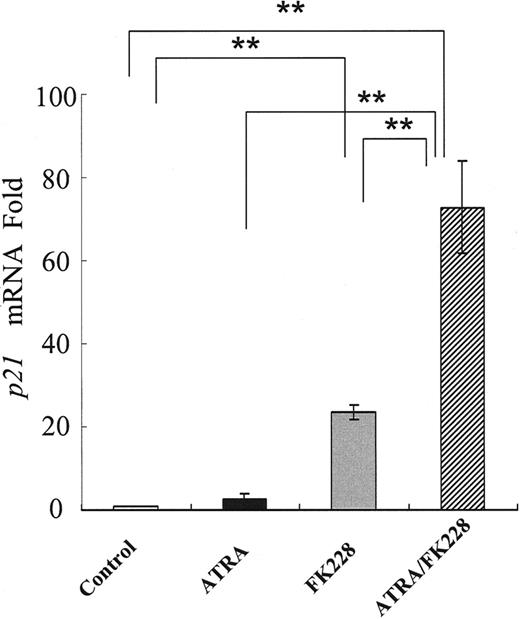
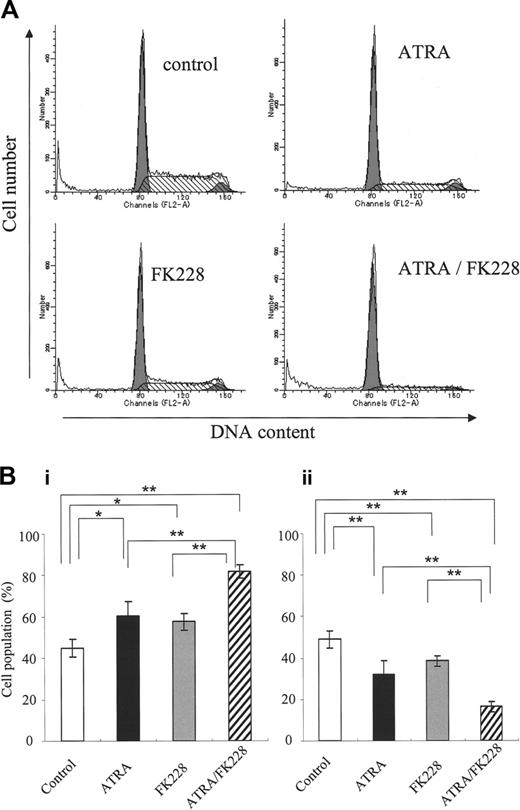
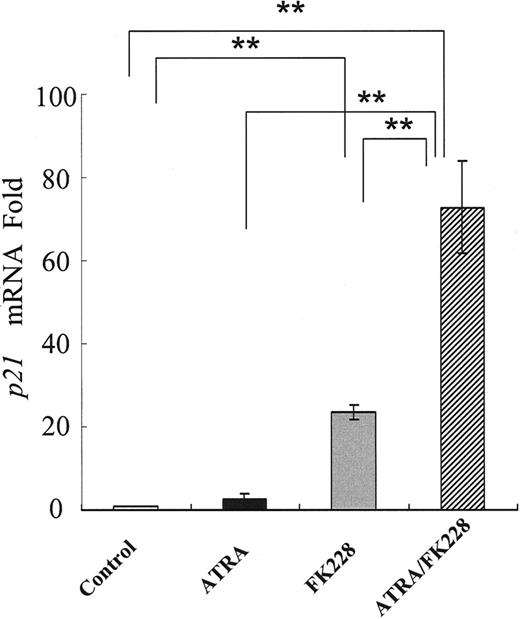
Because DOX induces apoptosis in the G2 phase,48 we investigated the potential cell-cycle effects of ATRA and/or FK228. As shown in Figure 6A-B, ATRA or FK228 alone moderately induced G1 arrest and the ATRA/FK228 combination enhanced it in NB4 cells. The mRNA level of CDKN1A, which is known to mediate G1 arrest,33 was increased in response to ATRA or FK228, with ATRA/FK228 showing synergistic effects (Figure 7).
Discussion
APL cells, in vitro and in clinical trials, exhibit exquisite sensitivity to anthracyclines. In this study, we observed that DOX cytotoxicity was significantly reduced by prior exposure to ATRA and the HDACI FK228. DOX is a well-known substrate for MDR1-encoded P-gp and previous studies had shown that the HDACI trichostatin A and sodium butyrate induced MDR1 gene expression in malignant cells.12,17,49 We and others (Paietta et al1 and Drach et al2 ) reported the lack of multidrug resistance protein P-gp in cells from APL patients.
In APL, the PML/RARα chimeric protein had been implicated in the suppression of MDR1 through chromatin remodeling.20 We therefore hypothesized that ATRA and FK228 promote the expression of MDR1 mRNA and P-gp through histone acetylation in the MDR1 promoter region of APL cells. Single treatments with ATRA or FK228 induced MDR1 mRNA in NB4 cells that do not ordinarily express the MDR1 gene. In addition, the ATRA/FK228 combination markedly enhanced MDR1 mRNA expression and induced P-gp protein at levels that confer poor prognosis in AML.9,37 This was associated with the histone acetylation seen in the MDR1 promoter region. However, the different patterns of ATRA/FK228-induced histone acetylation in histone H4 and in H3-Lys9 suggested that each locus on the histone tail is acetylated differently and that the ATRA/FK228 combination enriches both histone acetylation and the transcription activation of the MDR1 gene. Not surprisingly, therefore, the histone acetylation status in the promoter region and the initiator element containing the TIS in the MDR gene were almost identical.
ATRA/FK228 combination increases binding of the NF-YA to the MDR1 promoter CCAAT box in NB4 cells. NB4 cells were treated with ATRA (1 μM) and/or FK228 (3.0 nM) for 24 hours. Binding complexes were analyzed by gel shift assays using a CCAAT probe. Nuclear extracts from control cells were incubated in the presence of a 30-fold molar excess of unlabeled CCAAT (lane 1) and βRARE oligonucleotides (lane 2) and goat IgG (lane 3). In lanes 4, 6, 8, and 10, no competitors or antibodies were added. The βRARE consensus oligonucleotide does not contain a CCAAT binding sequence. Example of gel shift assay representative of 3 experiments that produced comparable results.
ATRA/FK228 combination increases binding of the NF-YA to the MDR1 promoter CCAAT box in NB4 cells. NB4 cells were treated with ATRA (1 μM) and/or FK228 (3.0 nM) for 24 hours. Binding complexes were analyzed by gel shift assays using a CCAAT probe. Nuclear extracts from control cells were incubated in the presence of a 30-fold molar excess of unlabeled CCAAT (lane 1) and βRARE oligonucleotides (lane 2) and goat IgG (lane 3). In lanes 4, 6, 8, and 10, no competitors or antibodies were added. The βRARE consensus oligonucleotide does not contain a CCAAT binding sequence. Example of gel shift assay representative of 3 experiments that produced comparable results.
ATRA/FK228 have combined effects on P-gp expression, and the P-gp inhibitor PSC833 reverses cytoprotective effects of ATRA/FK228. (A) Flow cytometric analysis of the P-gp expression using a PE-conjugated anti–P-gp antibody or a PE-conjugated isotype control antibody (IgG1). (i) NB4 control cells. (ii) NB4 cells treated with the ATRA (1.0 μM)/FK228 (3.0 nM) combination for 72 hours. (iii) HL60 DOX cells as the positive control. The data shown are representative of 2 experiments that produced comparable results. (B) Flow cytometric analysis of the Rh123 efflux in the presence/absence of PSC833. (i) Control NB4 cells and (ii) NB4 cells treated with the ATRA (1.0 μM)/FK228 (3.0 nM) combination for 72 hours. (iii) HL60 DOX cells as the positive control. The data are representative of 2 experiments that produced comparable results. Percentage of apoptotic annexin V–positive cells (Ci-ii) or cell viability detected by trypan blue–negative cell numbers (Di-ii) following 48- and 72-hour treatment with the ATRA (1.0 μM)/FK228 (3.0 nM) combination with or without PSC833 (1 μM) given 24 hours prior to DOX (17.0 nM). The mean ± SD of results were from 3 independent experiments and statistically significant differences were determined by ANOVA and Fisher post hoc tests (*P < .05).
ATRA/FK228 have combined effects on P-gp expression, and the P-gp inhibitor PSC833 reverses cytoprotective effects of ATRA/FK228. (A) Flow cytometric analysis of the P-gp expression using a PE-conjugated anti–P-gp antibody or a PE-conjugated isotype control antibody (IgG1). (i) NB4 control cells. (ii) NB4 cells treated with the ATRA (1.0 μM)/FK228 (3.0 nM) combination for 72 hours. (iii) HL60 DOX cells as the positive control. The data shown are representative of 2 experiments that produced comparable results. (B) Flow cytometric analysis of the Rh123 efflux in the presence/absence of PSC833. (i) Control NB4 cells and (ii) NB4 cells treated with the ATRA (1.0 μM)/FK228 (3.0 nM) combination for 72 hours. (iii) HL60 DOX cells as the positive control. The data are representative of 2 experiments that produced comparable results. Percentage of apoptotic annexin V–positive cells (Ci-ii) or cell viability detected by trypan blue–negative cell numbers (Di-ii) following 48- and 72-hour treatment with the ATRA (1.0 μM)/FK228 (3.0 nM) combination with or without PSC833 (1 μM) given 24 hours prior to DOX (17.0 nM). The mean ± SD of results were from 3 independent experiments and statistically significant differences were determined by ANOVA and Fisher post hoc tests (*P < .05).
Using a gel shift assay, we furthermore obtained evidence that ATRA caused NF-YA transcription factor binding on the CCAAT box in the MDR1 promoter of NB4 cells. In addition, although FK228 did not recruit NF-YA per se, it did potentiate the ATRA-induced NF-YA binding on the CCAAT box. The MDR1 promoter contains a CCAAT box (-82 to -73), an AP-1 site (-121 to -115), and 4 Sp1 sites (-86 to -78, -78 to -70, -56 to -48, and -50 to -42) located close together.12,18 These findings suggest that ATRA induces the MDR1 gene presumably after NF-Y is recruited to the CCAAT box with the coactivator complex, including p300 or P/CAF,12,19,50-55 through the coordinated effects of transcription factors, such as AP-1, which is inhibited, and Sp1, which is activated.43,56
Because ATRA treatment of PML/RARα-negative AML cells (Kasumi-1 and Kasumi-6) increased the expression of MDR1 mRNA, the elimination of RA receptor repression by PML/RARα affected by ATRA may not be the major mechanism in MDR1 gene induction in APL cells. Further studies will be required to elucidate the effects of FK228 on histone acetylation in the NFY promoter and the ATRA-associated interaction of transcription factors (NF-Y, AP-1, Sp1) with the coactivator complex including p300 or P/CAF in the MDR1 promoter of APL cells.
Recent studies have shown that DNA methylation is one of the mechanisms controlling MDR1 transcription.14 Further, Nakayama et al15 described an inverse correlation between methylation of the MDR1 promoter, which acts as an on-off switch, and transcription of the MDR1 gene in AML cells. The methyl-CpG–binding protein 2 (MeCP2) is also reported to be involved in the methylation-dependent silencing of MDR1, whereas combination treatment with the demethylation agent 5-Aza-dC and HDAC inhibitor TSA released MeCP2, reestablished histone acetylation, and significantly increased MDR1 expression.13 These findings indicate that the histone acetylation accomplished through NF-Y recruitment may therefore not be the sole event that reverses transcription repression.
ATRA/FK228 induces G0/G1 cell-cycle arrest in NB4 cells. (A) Example of flow cytometric cell-cycle analysis with PI stain of NB4 cells treated with ATRA (1 μM) and/or FK228 (3.0 nM) for 72 hours, as described in “Flow cytometric analysis.” (B) Graphs show the mean ± SD of data of G1-phase cell population (i) and S-phase cell population (ii) from 3 independent experiments. A statistically significant difference was determined by ANOVA and Fisher post hoc tests (*P < .05; **P < .01).
ATRA/FK228 induces G0/G1 cell-cycle arrest in NB4 cells. (A) Example of flow cytometric cell-cycle analysis with PI stain of NB4 cells treated with ATRA (1 μM) and/or FK228 (3.0 nM) for 72 hours, as described in “Flow cytometric analysis.” (B) Graphs show the mean ± SD of data of G1-phase cell population (i) and S-phase cell population (ii) from 3 independent experiments. A statistically significant difference was determined by ANOVA and Fisher post hoc tests (*P < .05; **P < .01).
ATRA and FK228 induce p21 mRNA in NB4 cells. Induction of p21 mRNA expression in NB4 cells treated with ATRA (1.0 μM) and/or FK228 (3.0 nM) for 24 hours analyzed by TaqMan RT-PCR analysis. The p21 mRNA expression in each sample was normalized to B2M mRNA expression. Control NB4 cells were used as the calibrator (p21 mRNA level in control NB4 cells = 1). Graphs show the mean ± SD of results from more than 3 independent experiments. A statistically significant difference was determined by ANOVA and Fisher post hoc tests (**P < .01).
ATRA and FK228 induce p21 mRNA in NB4 cells. Induction of p21 mRNA expression in NB4 cells treated with ATRA (1.0 μM) and/or FK228 (3.0 nM) for 24 hours analyzed by TaqMan RT-PCR analysis. The p21 mRNA expression in each sample was normalized to B2M mRNA expression. Control NB4 cells were used as the calibrator (p21 mRNA level in control NB4 cells = 1). Graphs show the mean ± SD of results from more than 3 independent experiments. A statistically significant difference was determined by ANOVA and Fisher post hoc tests (**P < .01).
In light of our observation that pretreatment with not only ATRA/FK228 but also ATRA and FK228 alone prevented DOX-induced growth inhibition, we suspect that ATRA and FK228 also repress DOX cytotoxicity by mechanisms other than P-gp. One possible mechanism could be mediated by the cell-cycle inhibitor p21, which is induced in response to HDACI and plays an important role in the G1 arrest of cancer cells.31-33 Consistent with these reports, we observed that p21 mRNA was induced during the G1 arrest in NB4 cells induced by ATRA and/or FK228 and that this effect was enhanced by ATRA/FK228. This p21-mediated cell-cycle arrest therefore provides another possible explanation for the prevention of DOX-induced apoptosis during G2 phase.
In conclusion, we have shown that ATRA/FK228 reduced DOX cytotoxicity in APL cells. This appeared to result from the fact that ATRA/FK228 increased MDR1 mRNA expression, and hence MDR1 promoter histone acetylation, by recruiting the transcription factor NF-YA into the CCAAT box, ultimately inducing P-gp in the NB4 cells. While further studies are necessary to confirm thebiologic and clinical significance of ATRA and/or FK228 effects on the cytotoxicity of DOX in the clinical samples from APL patients, a recent phase 2 clinical study reported the mean increase of 41% in MDR1 expression after FK228 administration (P = .04) in AML patients.57
In addition, ATRA/FK228-induced p21 mRNA and subsequent G1 cell-cycle arrest may also reduce the cytotoxicity of DOX, which induces apoptosis in the G2 phase. Of particular importance, this study demonstrates that the correct sequencing of novel therapies must be carefully worked out in future clinical trials of combinations of HDACIs, ATRA, and anthracyclines.
Prepublished online as Blood First Edition Paper, October 13, 2005; DOI 10.1182/blood-2004-10-4126.
Supported in part by The Institute for Environmental and Gender-Specific Medicine, Juntendo University Graduate School of Medicine; in part by grants from the National Cancer Institute (P01 CA55164, P01 CA49639, R01 CA89346, and CA16672) and the Paul and Mary Haas Chair in Genetics (M.A.); and grants from the Ichiro Kanehara Foundation and Juntendo University Project Research Program (Y.T.).
Y.T. and M.K. contributed equally to this work.
The publication costs of this article were defrayed in part by page charge payment. Therefore, and solely to indicate this fact, this article is hereby marked “advertisement” in accordance with 18 U.S.C. section 1734.
We thank Hiroaki Miyajima, Akemi Koyanagi, and Nobuko Tanaka for technical assistance and Rosemarie Lauzon for help in the preparation of the manuscript.

