Abstract
Glucocorticoid (GC) resistance is an adverse prognostic factor in childhood acute lymphoblastic leukemia (ALL), but little is known about causes of GC resistance. Up-regulation of the glucocorticoid receptor (GR) has been suggested as an essential step to the induction of apoptosis in leukemic cells. In this study we investigated whether baseline mRNA expression levels of the 5 different GR promoter transcripts (1A1, 1A2, 1A3, 1B, and 1C) or differences in the degree of regulation of the GR or GR promoter transcripts upon GC exposure are related to GC resistance. Therefore, mRNA levels of the 5 GR promoter transcripts and of the GR were measured by quantitative real-time reverse transcriptase–polymerase chain reaction (RT-PCR; Taqman) technology in primary ALL cells prior to and after 3, 8, and 24 hours of prednisolone exposure. GR expression is induced upon GC exposure in primary ALL patient samples, which is opposite to what is found in tissues in which GCs do not induce apoptosis. GC resistance in childhood ALL cannot be attributed to an inability of resistant cells to up-regulate the expression of the GR upon GC exposure, nor to differences in GR promoter usage (at baseline and upon GC exposure).
Introduction
Glucocorticoids (GCs) like prednisolone and dexamethasone have been used in the treatment of childhood acute lymphoblastic leukemia (ALL) for many years. Although poor early prednisone response as determined in the BFM (Berlin-Frankfurt-Munster) treatment protocols and in vitro cellular resistance to prednisolone are important adverse risk factors in the treatment of childhood ALL,1-3 little is known about causes underlying GC resistance.4,5
To induce apoptosis, GCs have to bind to the intracellular GC receptor (GR). Most cell types demonstrate a down-regulation of the amount of GR upon GC exposure,6-8 probably as part of a physiologic feedback mechanism.9 In contrast, an up-regulation of GR mRNA and protein levels has been demonstrated in various cell lines of lymphoid leukemias10-12 and has been described as essential for GC-induced apoptosis.13 Hence, resistance toward GCs in patient cells may be caused by lack of GR up-regulation upon GC exposure.13,14
Besides the functional GR-alpha transcript, several other 3′ splice variations of the GR have been described that are unable to bind GCs (GR-beta and GR-P). These variants retain a normal DNA binding motif and may compete with GR-alpha for binding to glucocorticoid responsive elements (GREs) of targeted genes or with transcription factors interacting with the GR, thereby interfering with GR-alpha function and causing resistance.15,16 We have shown before that leukemic cells from patients with ALL resistant to GCs express less of the functional GR-alpha variant,17 and that baseline mRNA expression levels of the GR transcripts GR-beta and GR-P are not relevant for GC resistance.17,18
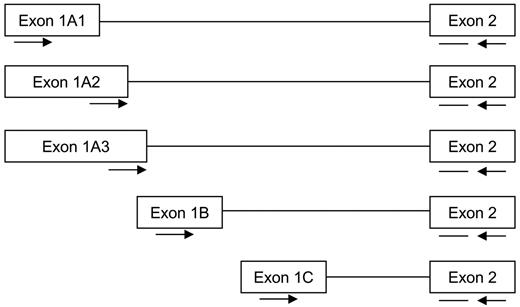
The GR gene has 3 different promoters, 1A, 1B, and 1C, which results in transcripts that include the corresponding exons 1A, 1B, and 1C, respectively. Since exon 1A can be alternatively spliced in 3 variants (1A1, 1A2, and 1A3), in total, 5 different 5′ GR transcript variants exist (Figure 1). These GR promoter transcripts are expressed at various levels in different cancer cell lines.19-22 Differential usage of these GR promoter transcripts might be responsible for differences in GC cytotoxicity in hematologic malignancies.19 This is supported by the fact that the 1A promoter, but not 1B or 1C, contains a GRE that may enhance GR-1A transcript production upon GC exposure.21
In the present study, we determined whether resistance to GCs in leukemic cells of children with ALL can be explained by altered baseline and/or GC-induced expression of 5′ GR promoter transcripts (1A1, 1A2, 1A3, 1B, and 1C), and of the 3′ GR splice variants (GR-alpha, GR-beta, and GR-P).
Patients, materials, and methods
Patient samples
Two study populations were included. For the baseline GR promoter study, 24 pediatric patients with ALL who had leukemic blasts in vitro sensitive to prednisolone were each matched to a patient with leukemic blasts that were in vitro resistant to prednisolone. Patients were matched according to age (1-9 years old and ≥ 10 years old), immunophenotype (precursor B-ALL and T-ALL) and white blood cell (WBC) count (< 50 × 109/L and ≥ 50 × 109/L). None of the patients had poor prognostic cytogenetic abnormalities like the t(9,22) and 11q23 (MLL) rearrangements. For the GR regulation study, 22 unmatched patients were included. Patient material was obtained prior to initial therapy after written informed consent was obtained from the patient and/or their parents in accordance with regulations and the Declaration of Helsinki; study protocols were first approved by the ethics committee of Erasmus MC, Rotterdam, the Netherlands.
Schematic overview of the different 5′ glucocorticoid receptor transcripts derived from the use of 3 different promoters. The GR promoter transcripts 1A, 1B, and 1C are alternatively spliced to exon 2. The locations of the forward primer (→), the reverse primer (←), and the probe (—) are indicated.
Schematic overview of the different 5′ glucocorticoid receptor transcripts derived from the use of 3 different promoters. The GR promoter transcripts 1A, 1B, and 1C are alternatively spliced to exon 2. The locations of the forward primer (→), the reverse primer (←), and the probe (—) are indicated.
Lymphoprep density gradient centrifugation (density, 1.077 g/mL; Nycomed Pharma, Oslo, Norway) was used to separate the mononuclear-cell fraction, and, when necessary, immunomagnetic beads were used to deplete nonleukemic cells from the samples. All samples therefore contained more than 90% of leukemic blasts.
MTT assay
In vitro drug cytotoxicity was assessed using the MTT assay as described earlier.23,24 Briefly, patient blasts were cultured with or without prednisolone disodiumphosphate in a concentration range of 0.06 to 250 μg/mL. At day 4, MTT was added, which can be reduced into formazan by viable cells only. The reduced product was quantified spectrophotometrically at 562 nm. Leukemic-cell survival was calculated by: (optical density [OD] drug-treated well/OD control well without drug) × 100%. The value of the concentration of the drug at which 50% of the cells are killed represents the LC50, which was used as measure of in vitro drug cytotoxicity. Leukemic cells with LC50 values lower than 0.1 μg/mL were considered in vitro prednisolone sensitive; samples with LC50 values exceeding 150 μg/mL were considered in vitro resistant, which has been previously described as having prognostic value.23,25
Prednisolone exposure
To study the effect of prednisolone exposure on GR mRNA levels in childhood leukemia, leukemic blasts were incubated in culture medium as used in the MTT assay supplemented with 250 μg/mL prednisolone for 3, 8, and 24 hours. In each case, leukemic blasts were incubated as well in culture medium without prednisolone as control to discard variations due to other mechanisms than prednisolone exposure.
Isolation of RNA and cDNA synthesis
Total RNA was extracted using the Trizol method (Gibco BRL, Life Technologies, Breda, the Netherlands) according to the protocol provided by the manufacturer with minor modifications to improve RNA quality.26 The RNA pellets were dissolved in 20 μL TE buffer (10 mM Tris-HCl, 1 mM EDTA, pH 8.0) and quantified spectrophotometrically. cDNA was synthesized as described before.26
Quantitative real-time RT-PCR
Levels of mRNA expression of the 3′ GR transcripts GR-alpha, GR-beta, and GR-P, the 5′ GR promoter transcripts GR-1A1, GR-1A2, GR-1A3, GR-1B, and GR-1C (ie, target PCRs), and 2 endogenous reference genes (ie, GAPDH and RNaseP) were measured by quantitative real-time reverse transcriptase–polymerase chain reaction (RT-PCR) based on Taqman chemistry using an ABI PRISM 7700 sequence detector (Applied Biosystems, Foster City, CA). Specific primers and probes were designed using GenBank accession codes AC091925 for the human GR gene, AC012634 and ACJ04038 for the GAPDH gene, and X15624 for RNaseP (Table 1). All primers and probes had melting temperatures of 65°C ± 1°C and 75°C ± 1°C, respectively (nearest neighbor method27 ). All PCR reactions had an amplification efficiency of at least 95% and were very specific, showing only a single PCR product on gel (data not shown). Genomic DNA (100 ng) served as a negative control and did not result in product amplification for any of these reactions, confirming the specificity of these reactions for RNA detection. Patient sample cDNA (40 ng) was amplified in duplo in the presence of 300 nM forward and reverse primers, 50 nM probe, 200 μM dNTPs, 4 mM MgCl2, and 1.25 U of AmpliTaq gold DNA polymerase in Taqman buffer A (Applied Biosystems) in a total volume of 50 μL. Samples were heated for 10 minutes at 95°C and amplified in 40 cycles of 15 seconds at 95°C and 60 seconds at 60°C. A positive control was amplified on each plate to verify the amplification efficiency within each experiment.26 The average cycle threshold (Ct) value was used to calculate mRNA expression levels of the PCR targets relative to the expression level of the 2 reference genes using the comparative Ct method27 using the following equation: relative expression = 2 – [Ct(target) – Ct(reference gene)] × 100.
Statistical methods
The nonparametric Wilcoxon signed-rank test for matched samples was used to compare GR promoter transcript expression of matched sensitive and resistant cases, as well as for the analysis of the GR promoter transcript regulation upon prednisolone exposure. To test whether the GR was up-regulated upon GC exposure and whether the degree of up-regulation was related to GC resistance, a linear mixed-effects model was fitted to the log-2 GR expressions, using as explanatory variables exposure time, GC sensitivity, prednisolone-exposed or control sample, and the individual patient, the last 1 having a random effect, the others with fixed effects. Log-2–transformed GR expression levels were used to correct for the nonnormal distribution of the data. By associating a random effect to each patient in the study, the model not only allows for samples corresponding to the same patient to be more correlated than otherwise, but also patients are taken as representing a larger population of similar patients. A P value of .05 or less was considered statistically significant (2-tailed–tested).
Results
Baseline GR promoter usage
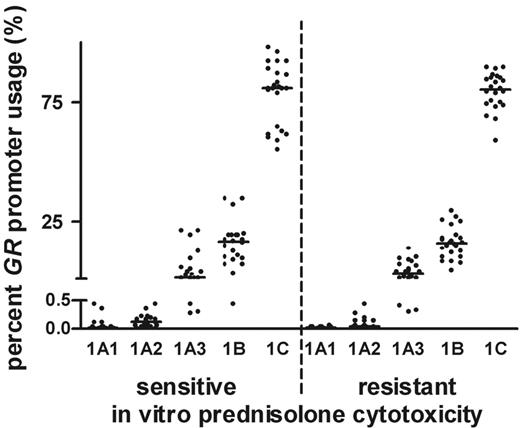
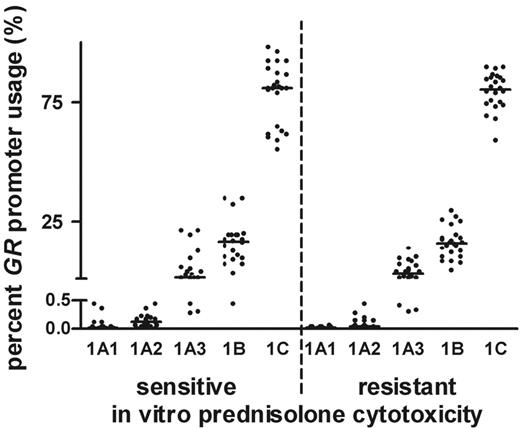
We explored whether GC-resistant ALL cells use promoter sites at the GR other than GC-sensitive cells. For this, expression levels from the 5 different 5′ GR promoter transcripts (ie, transcripts 1A1, 1A2, and 1A3 derived from promoter 1A; transcript 1B from promoter 1B; and transcript 1C from promoter 1C) were measured by quantitative real-time RT-PCR according to the strategy as outlined in Figure 1. This study included 24 patients with ALL that was in vitro sensitive to prednisolone, who were matched each to an in vitro–resistant patient (matching according to age, immunophenotype, and WBC count). The patient characteristics are depicted in Table 2. For each patient, GR 1A1, 1A2, 1A3, 1B, and 1C transcript expression levels were calculated as percent of the total expression level of the 5 transcripts combined. The highest expression was found for promoters 1B and 1C (ie, median 15.9% and 80.8%, respectively). The GR transcripts derived from the 1A promoter were lower expressed at 0.02%, 0.08%, and 2.8% for the 1A1, 1A2, and 1A3 transcripts, respectively. In a matched-pair analysis, we did not observe a relationship between the baseline expression levels of the 5 different GR promoter transcripts and in vitro prednisolone toxicity (Figure 2), even when analyzing precursor B-ALL and T-ALL samples separately.
5′ GR promoter transcript expression for in vitro prednisolone–sensitive and –resistant children with ALL. The mRNA expression of the 5′ GR promoter transcripts 1A1, 1A2, 1A3, 1B, and 1C as percentages of total GR promoter expression for 48 patients is depicted. The results are depicted as median (horizontal bars) and the 25th and 75th percentiles. Comparisons in expression levels of these 5 transcripts between GC-sensitive and -resistant patient samples were not significant.
5′ GR promoter transcript expression for in vitro prednisolone–sensitive and –resistant children with ALL. The mRNA expression of the 5′ GR promoter transcripts 1A1, 1A2, 1A3, 1B, and 1C as percentages of total GR promoter expression for 48 patients is depicted. The results are depicted as median (horizontal bars) and the 25th and 75th percentiles. Comparisons in expression levels of these 5 transcripts between GC-sensitive and -resistant patient samples were not significant.
GC-induced GR promoter usage
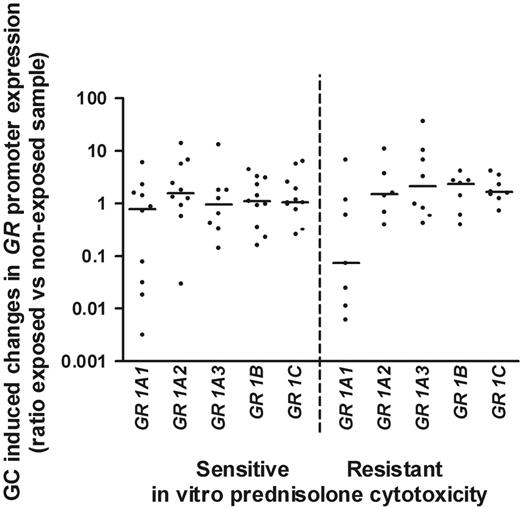
We next investigated whether specific promoter transcripts of the GR gene were up-regulated upon 8 hours of prednisolone exposure. Patient characteristics are depicted in Table 2. Similar to what was found for the baseline expression values, no significant changes for the percent expression of the five 5′ GR promoter transcripts (1A1-1A3, 1B, and 1C) were found between in vitro prednisolone–sensitive and –resistant cases (Figure 3).
GC-induced GR expression
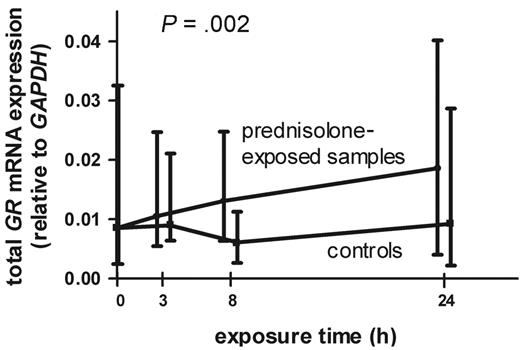
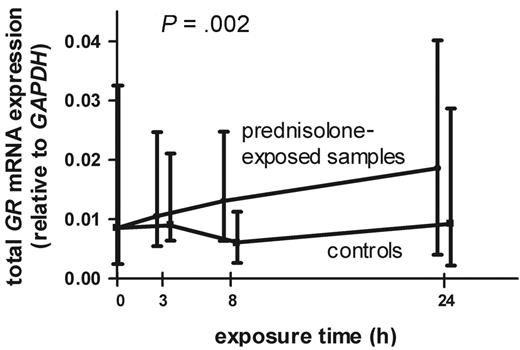
The effect of GC exposure on GR mRNA expression levels was analyzed by incubating leukemic cells for 3, 8, and 24 hours in culture medium with or without prednisolone. Characteristics of the included patients are depicted in Table 2. For each timepoint, mRNA expression levels of the 3′ GR splice variants GR-alpha, GR-beta, and GR-P were determined relative to the reference genes GAPDH and RNaseP. Both reference genes revealed the same data and, therefore, in the remaining part of this paper we describe the results obtained with GAPDH only. Total GR mRNA expression levels were defined as the sum of GR-alpha, GR-beta, and GR-P, and are depicted in Figure 4.
Glucocorticoid sensitivity is not related to differential use of GR promoters after 8 hours of prednisolone exposure in ALL. The ratio for the 5′ GR promoter transcripts between the prednisolone-exposed and control samples was calculated. The results are depicted as median (horizontal bars) and the 25th and 75th percentiles. Comparisons of the ratios of these 5 transcripts between GC-sensitive and -resistant patient samples were not significant.
Glucocorticoid sensitivity is not related to differential use of GR promoters after 8 hours of prednisolone exposure in ALL. The ratio for the 5′ GR promoter transcripts between the prednisolone-exposed and control samples was calculated. The results are depicted as median (horizontal bars) and the 25th and 75th percentiles. Comparisons of the ratios of these 5 transcripts between GC-sensitive and -resistant patient samples were not significant.
Regulation of the glucocorticoid receptor upon prednisolone exposure in ALL. Leukemic cells were incubated in culture medium with or without 250 μg/mL prednisolone for 3, 8, and 24 hours. The total GR mRNA expression as the sum of GR-alpha, GR-beta, and GR-P for both the prednisolone-incubated and control samples is depicted. The results are depicted as median (horizontal bars) and 25th and 75th percentiles.
Regulation of the glucocorticoid receptor upon prednisolone exposure in ALL. Leukemic cells were incubated in culture medium with or without 250 μg/mL prednisolone for 3, 8, and 24 hours. The total GR mRNA expression as the sum of GR-alpha, GR-beta, and GR-P for both the prednisolone-incubated and control samples is depicted. The results are depicted as median (horizontal bars) and 25th and 75th percentiles.
Using a linear mixed-effects model, we found the GR to be up-regulated upon GC exposure for 3, 8, and 24 hours compared with the control samples, incubated without prednisolone (P = .002). However, the degree of up-regulation was not related to GC sensitivity (P = .12). The relative distribution between GR-alpha, GR-beta, and GR-P expression levels did not change over time (with median expression levels of 68.8%, 0.03%, and 31.1%, respectively), in both the GC-sensitive and -resistant patient samples.
No difference was found within T-ALL or precursor B-ALL samples when analyzed separately as well. In addition, the three 3′ GR transcripts (GR-alpha, GR-beta, and GR-P) were also coordinately regulated in both sensitive and resistant patients.
Discussion
The ability to up-regulate GR expression upon GC exposure may be related to GC sensitivity in ALL as suggested in the literature after several cell-line studies.13,14 It is currently unknown whether GR up-regulation upon GC exposure occurs in pediatric ALL cells directly obtained from patients and whether an inability to up-regulate the GR is related to GC resistance. Also, no studies have been performed to address whether differential expression of the 5 different 5′ GR promoter transcripts (1A1, 1A2, 1A3, 1B, and 1C) is linked to GC resistance.
Our study shows that the baseline relative expression of the 5 different 5′ GR promoter transcripts in pediatric ALL samples was the same as described in cell lines:19,22 1B (15.9%) and 1C (80.8%) are the most abundantly expressed, followed by 1A3 (2.8%), 1A2 (0.08%), and 1A1 (0.02%). No correlation between the baseline expression levels of the different 5′ GR promoter transcripts and GC sensitivity was found. This is in contrast with a recent study in which mouse T-lymphocytes showing a relatively high expression of the GR-1A promoter were more susceptible to GC-induced cell death than those showing a relatively low expression of GR-1A.28 Since these studies were done using T lymphocytes only, we analyzed samples of patients with a precursor B-ALL and T-ALL separately. Again, no relation between GR promoter expression and in vitro prednisolone toxicity was found.
Since the GR-1A promoter contains a weak GRE sequence in contrast to the GR-promoters 1B and 1C (in which no GRE can be recognized), the regulation of the 3 GR promoters upon GC exposure has been hypothesized to be different.21 Differential regulation of the 5 different 5′ GR transcripts has been shown in 2 separate studies with the CEM-C7 T lymphoblast cell line as model system, in which GC treatment specifically led to the up-regulation of 1A3 promoter transcripts.19,22 However, in the present study we did not detect a significant difference in the GC-induced expression levels of any of the 5 different 5′ GR promoter transcripts in either the total study population or when analyzing the prednisolone-sensitive versus -resistant patient samples. Since all 5′ GR promoter transcripts (1A1-1A3, 1B, and 1C) were activated at the same level, the GRE sequence such as that present in promoter 1A but not 1B and 1C may not be functional in ALL cells. In vitro GC resistance was not caused by a differential regulation of the different GR promoter transcripts.
Besides promoter usage, the inability of leukemic cells to up-regulate the GR upon GC exposure could be an explanation for GC resistance. In correspondence with leukemic cell line studies,10-12 we also found an up-regulation of the GR upon prednisolone exposure in leukemic blasts from children with ALL. In contrast, other human-cell types, in which GCs do not induce apoptosis, are characterized by a down-regulation of the GR upon GC exposure.6-8 Thus, up-regulation of the GR may be an important hallmark of ALL cells that normally undergo apoptosis upon GC exposure. We found that the three 3′ GR splice variants GR-alpha, GR-beta, and GR-P were coordinately regulated over time. The percentage of these 3 splice variants of total GR expression was the same as that reported in the literature in non-GC–exposed ALL samples,17 and did not change after 3, 8, and 24 hours of prednisolone exposure.
Since relatively large differences in the degree of regulation of the GR were observed between sensitive and resistant cell lines, it has been hypothesized that this difference underlies GC resistance in childhood ALL.13,14 However, in our study we did not find differences in the degree of regulation of GR mRNA between in vitro–sensitive and –resistant leukemic samples. Since the studies relating GC resistance to the level of GR up-regulation have been done using T-cell leukemia cell lines, we also analyzed the precursor B-ALL and T-ALL samples separately. Again, no relation between the level of GR regulation and GC resistance could be found. The 3′ GR splice variants GR-alpha, GR-beta, and GR-P were found to be coordinately regulated upon GC exposure in both sensitive and resistant ALL samples, ruling out the possibility that GC resistance is determined by a preferential regulation of GR-beta and GR-P that may inhibit GR-alpha function.15,16 These results are in correspondence with 1 previous cell-line study in which GR-alpha and GR-beta mRNA expression levels were coordinately up-regulated upon GC exposure.22
As an alternative explanation for GC resistance, it could be that instead of mRNA levels, protein levels of the GR upon GC exposure are correlated with GC resistance (ie, posttranscriptional regulation instead of transcriptional regulation). However, it has been demonstrated before in leukemic cell lines that the GC-mediated up-regulation of GR expression is a transcriptional response.10,14,29 In a previous study we have shown that GR-alpha mRNA levels are related to protein levels in 9 different leukemic cell lines.17 Unfortunately, we did not have sufficient material to confirm these cell-line data in patient material.
In conclusion, neither the baseline expression of the five 5′ GR promoter transcripts nor the expression of these promoter transcripts after prednisolone exposure is related to GC resistance in pediatric ALL. Exposure to prednisolone did not induce a decrease of the GR as seen in other body tissues, but rather an up-regulation in ALL cells. However, GC resistance in ALL is not related to a defective up-regulation.
Prepublished online as Blood First Edition Paper, March 30, 2006; DOI 10.1182/blood-2006-01-0261.
An Inside Blood analysis of this article appears at the front of this issue.
The publication costs of this article were defrayed in part by page charge payment. Therefore, and solely to indicate this fact, this article is hereby marked “advertisement” in accordance with 18 U.S.C. section 1734.

