Abstract
Activating mutations in RAS, predominantly NRAS, are common in myeloid malignancies. Previous studies in animal models have shown that oncogenic NRAS is unable to induce myeloid malignancies effectively, and it was suggested that oncogenic NRAS might only act as a secondary mutation in leukemogenesis. In this study, we examined the leukemogenicity of NRAS using an improved mouse bone marrow transduction and transplantation model. We found that oncogenic NRAS rapidly and efficiently induced chronic myelomonocytic leukemia (CMML)– or acute myeloid leukemia (AML)– like disease in mice, indicating that mutated NRAS can function as an initiating oncogene in the induction of myeloid malignancies. In addition to CMML and AML, we found that NRAS induced mastocytosis in mice. This result indicates that activation of the RAS pathway also plays an important role in the pathogenesis of mastocytosis. The mouse model for NRAS leukemogenesis established here provides a system for further studying the molecular mechanisms in the pathogenesis of myeloid malignancies and for testing relevant therapies.
Introduction
RAS proteins are small GTPases that play a central role in transducing signals that regulate cell proliferation, survival, and differentiation and in neoplastic transformation. The 3 RAS genes encode 4 highly homologous proteins: H-, N-, and KRAS 4A and 4B, the latter 2 being alternatively spliced isoforms differing only at the COOH terminus (reviewed in Barbacid1 ). The RAS family members interact with a common set of activators and effectors and, therefore, share many biochemical and biologic functions (reviewed in Ulku and Der2 ). However, the RAS proteins associate with different microdomains of the plasma membrane as well as other internal cell membranes and are capable of generating distinct signal outputs (reviewed in Hancock3 ). Gene knockout studies in mice have revealed functional differences as well as redundancies among RAS proteins. Mice that lack the expression of Nras or Hras or both are viable and have no obvious abnormal phenotype.4,5 But mice lacking the Kras gene die during embryonic development between days 12 and 14.6,7 Interestingly, mice heterozygous for Kras (Kras+/–) and homozygous null for Nras (Nras–/–) die between embryonic day 10 and 12, whereas the Kras+/– mice are normal, suggesting that there is partial redundancy between NRas and KRas.6
Mutations that result in constitutive activation of RAS proteins are associated with approximately 30% of all human cancers, including 20% to 30% acute myeloid leukemia (AML) and 50% to 70% chronic myelomonocytic leukemia (CMML) [classified as myelodysplastic/myeloproliferative disease (MDS/MPD) according to the new WHO classification of myeloid neoplasms].8-11 Different RAS oncogenes are preferentially associated with different types of human cancer. For example, KRAS mutations are predominantly associated with pancreatic, lung, and colon cancers. In myeloid malignancies, NRAS mutations occur (in approximately 70% of cases) more frequently than KRAS mutations, whereas HRAS mutations are rare.8
The role of RAS oncogenes in leukemogenesis has been investigated using various mouse models. It was shown that transgenic mice expressing viral Hras driven by mouse mammary tumor virus (MMTV) promoter/enhancer developed B-lymphoblastic lymphomas at a low frequency.12 Transgenic mice expressing an activated Nras under the control of the IgH Eμ enhancer or the MMTV long terminal repeat (LTR) developed either T-cell and B-cell lymphomas or tumors of the epithelial origin.13,14 Transgenic mice expressing oncogenic Nras under the control of the myeloid specific hMRP8 promoter developed predominantly skin lesions.15 Even though some abnormality in the development of myeloid cells was observed in these mice, they failed to develop myeloid malignancies. In a bone marrow transduction and transplantation model using the murine stem cell virus (MSCV) vector, expression of oncogenic HRAS induced B-as well as T-lymphoid leukemia and lymphoma,16 whereas expression of oncogenic NRAS under the control of Moloney murine leukemia virus (Mo-MuLV) LTR induced various myeloid malignancies with a long latency (107-385 days) and incomplete penetrance.17 These studies suggested that mutations in addition to the activation of RAS might be required for the development of myeloid malignancies in mice. Because overexpression of oncogenic RAS induces senescence in embryonic fibroblasts, RAS mutations may only act as a secondary event in leukemogenesis.16,17 However, recently it was shown that expression of an oncogenic KRas in a conditional knock-in mouse strain efficiently induced MPD, indicating that oncogenic KRas is sufficient to initiate myeloid leukemia.18,19 The differences in results between the latter studies and the previous ones may be attributed to the differences in the expression of oncogenic RAS, in terms of cell types being targeted and/or protein expression levels. For example, unlike MSCV vectors, transcription from the Mo-MuLV LTR-based vectors is suppressed in early hematopoietic cells.20,21 The inefficient targeting of oncogenic NRAS into hematopoietic stem/progenitor cells and/or retroviral overexpression of the oncogene may account for the poor leukemogenic potential of activated NRAS in these models. Alternatively, because different RAS proteins may generate distinct signal outputs and play different roles in development, KRAS may have different leukemogenic potential compared with oncogenic HRAS and NRAS.
To test these possibilities, we examined the leukemogenic potential of oncogenic NRAS, the most frequently mutated RAS gene in myeloid malignancies, using the bone marrow transduction and transplantation model with a MSCV vector. Using this system, we and others have previously shown that expression of the BCR/ABL oncoprotein [the hallmark of human chronic myelogenous leukemia (CML) in which the Ras pathway is activated] in mice induces MPD resembling the chronic phase of human CML.22,23 In this study, we found that expression of oncogenic NRAS in mouse bone marrow cells rapidly and efficiently induced CMML- or AML-like diseases.
Materials and methods
DNA constructs
The NRASD12 gene was amplified by polymerase chain reaction from an EST for human NRAS (GenBank Accession no. N44803, IMAGE no. 272189) using the primers, 5′, AAG AAT TCG CGG CCG CCA TGA CTG AGT ACAAAC TGG TGG TGG TTG GAG CAG ATG GTG TTG GG, and 3′, CCA TCG ATT ACA TCA CCA CAC ATG GCA A. The gene was cloned into 5′-NotI and 3′-ClaI restriction enzyme sites in the MSCV vector, downstream of an internal ribosomal entry site (IRES) from the encephalomyocarditis virus (EMCV). Oncogenic NRAS was fused with 2 myc-tags at the N-terminus, the coding sequence of which was inserted between the NcoI and NotI sites downstream of the EMCV-IRES. GFP was expressed along with NRASD12 in a bi-cistronic construct, with the GFP gene being upstream of the IRES. The control vector consisted of only the GFP gene downstream of the EMCV-IRES. Construction of the BCR/ABL expression vector has been described previously.22
Retrovirus production and determination of viral titer
Retroviruses were produced and titered as previously described.24 The viral titer was calculated in transducing units (TUs) by multiplying the percentage of NIH3T3 cells expressing GFP and the total number of cells on the dish at the time of infection.
Bone marrow transduction/transplantation
Bone marrow cells from 5-fluorouracil (5-FU; 250 mg/kg) treated 6- to 8-week-old male donor BALB/c mice (Taconic Farms, Germantown, NY) were infected with retroviruses for 2 days and received transplants through the injection of 4 × 10⁵ cells into the tail vein of each of the lethally irradiated (2 × 4.5 Gy [2 × 450 rad], 4 hours between each dose) female recipient BALB/c mice as described.22 At the time of injection, 0.47% of the bone marrow cells were GFP positive in the group receiving a high titer of NRASD12 virus as well as in the group receiving the control vector, whereas only 0.16% cells were GFP positive in the group receiving a low titer of NRASD12 virus (calculated by flow cytometry by counting 50 000 events). The recipient mice were monitored for signs of disease from day 14 after transplantation. For the secondary transfers, 1 × 10⁶ bone marrow cells plus 1 × 10⁶ splenic cells from primary AML or CMML mice along with 105 normal bone marrow cells were injected into the tail veins of lethally irradiated recipient mice.
Flow cytometry analysis
Peripheral-blood or single-cell suspensions of murine tissues were treated with ACK [150 mM NH4Cl, 1 mM KHCO3, 0.1 mM Na2EDTA (pH 7.3)] to lyse red blood cells, washed in PBS, and resuspended in fluorescence activated cell sorting (FACS) buffer (PBS, 1% FCS, 0.1% sodium azide). White blood cells (0.5-1 million) were used for staining with each of the following antibodies, either alone or in combination, after blocking with purified anti–mouse CD16-CD32 (2.4G2; BD Pharmingen, San Jose, CA). The following antibodies used in the analysis were also purchased from the same source: PE-conjugated Gr-1 (RB6-8C5), B220 (RA3-6B2), CD19 (1D3), Thy-1.2 (30-H12), CD86, CD31, CD115 (M-CSFR), and Ter-119; biotinylated Mac-1 (M1/70), CD34 (RAM34), CD38 (90), CD16/32, and c-Kit (2B8); and Streptavidin-APC. PE-conjugated anti–mouse F4/80 (CI:A3-1) and anti–mouse macrophages-monocytes (MOMA-2) were purchased from Serotec, Raleigh, NC. Flow cytometry was performed on the FACSCalibur machine, and data were analyzed using Cell Quest (Becton Dickinson, San Jose, CA) or Flow Jo (Tree Star, Ashland, OR) software.
Hematopathologic analysis
Blood (3 μL) from each mouse was obtained by tail bleed and was diluted in 3 mL Isoton II (Fisher Scientific, Pittsburgh, PA). Total peripheral blood cell counts and white blood cell (WBC) counts after the lysis of red blood cells (RBCs) with ZAP-O-Globin (Beckman Coulter, Fullerton, CA) were measured using the Coulter Counter model Z1 (Coulter, Hialeah, FL). RBC counts were determined by subtracting WBC counts from the total blood cell counts. Hematocrit was measured by capillary centrifugation on a microhematocrit centrifuge (Stat Spin, Norwood, MA). Smears, cytospin, and touch preparations of blood and other murine tissues were stained with Hema 3 stain set (Fisher Scientific) for routine identification of cell morphology. Histology was performed on 4-μM thick paraformaldehyde-fixed, paraffin-embedded tissue sections. After deparaffinization, the sections were stained by hematoxylin and eosin or were used in histoimmunochemical assays. Tissue expression of GFP and myeloperoxidase (MPO) was determined by histoimmunochemistry using Vector VIP peroxidase substrate kit (Vector, Burlingame, CA) with anti-GFP25 and antimyeloperoxidase (no. N1578; Dako Cytomation, Carpinteria, CA) antibodies (per manufacturer's instructions).
Cytochemistry
For cytochemistry, bone marrow smears and liver and spleen touch-preps were stained for naphthol AS-d-chloroacetate esterase (NACE) and alphanaphthyl acetate esterase (ANAE) by using appropriate detection kits from Sigma-Aldrich (St Louis, MO), as per the manufacturer's instructions.
Southern blot analysis
Genomic DNA from liver tumor cells of the diseased mice was isolated using the Promega Wizard Genomic DNA Purification Kit (Promega, Madison, WI). Genomic DNA (15 μg) was digested with either XbaI or BglII, electrophoresed on 1% agarose gel, transferred onto Zeta-probe GT membrane (Bio Rad, Hercules, CA), and hybridized with a 32P-labeled 0.7-kb (kilobase) NcoI-SalI fragment corresponding to GFP as a probe. The blot was stripped with 0.1% boiling SDS solution and reprobed with 32P-labeled 1.4 kb irf-4 DNA fragment as a loading control. To generate a control for single-copy proviral integration, we performed single-cell sorting of 32D cells transduced with MSCV-BCR/ABL-IRES-GFP. We then tested the single-cell clones by Southern blotting and isolated a cell line with a single-copy provirus (Figure 7A-B, lane 1; single BglII band with equal intensity to XbaI band).
Western blot analysis
Cell lysates were prepared from infected NIH3T3 cells and from ACK-treated single-cell suspensions of mouse tissues by adding an equal volume of 2 × Laemmli sample buffer to the cell suspensions in PBS. The lysates were heated at 100°C for 5 minutes and centrifuged to remove debris. Lysates were then resolved on 6% to 18% gradient polyacrylamide gels, transferred to nitrocellulose membranes, and blotted with the following primary antibodies: anti-Ras (RAS10; Upstate Biotechnology, Lake Placid, NY), antiactin (AC40; Sigma, St Louis, MO), anti–myc tag 9E10 monoclonal antibody (from conditional media of 9E10 hybridoma cell line), and pAkt, Akt, pMek1/2, Mek1/2, pErk42/44, Erk42/44, pS6rp, and S6rp (all 1:1000; Cell Signaling Technologies, Beverly, MA). HRP-labeled goat anti–mouse IgG or goat anti–rabbit IgG (Southern Biotechnology, Birmingham, AL) was used as a secondary antibody. Calculation of ratios of NRASD12 to actin and pS6rp to actin were performed on a Macintosh computer using the public domain NIH Image program (developed at the US National Institutes of Health and available at http://rsb.info.nih.gov/nih-image/).
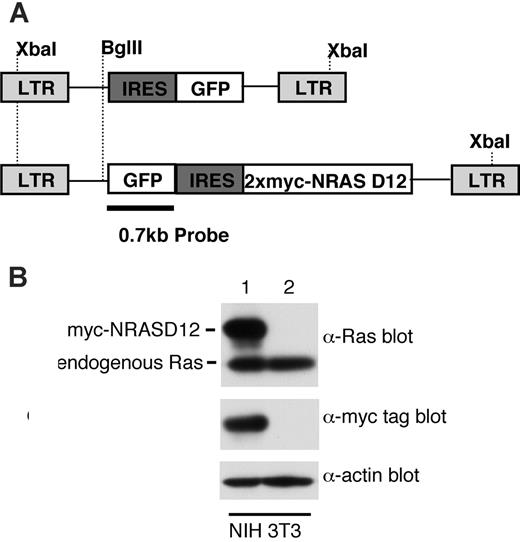
Expression of oncogenic NRAS by the MSCV retroviral vector. (A) A schematic diagram of retroviral DNA constructs used to transduce oncogenic NRAS and the vector control. Positions of restriction enzyme sites as well as probe used for Southern blot are indicated. (B) Western blot analysis of NIH3T3 cells infected with the NRAS retrovirus (lane 1) and the vector control (lane 2) using Ras and myc-tag antibodies. Detection of actin using an actin antibody was used as a loading control (bottom). The ratio between the intensity of exogenous RAS and endogenous Ras is about 1.5, and approximately 50% NIH3T3 cells were GFP positive (lane 1).
Expression of oncogenic NRAS by the MSCV retroviral vector. (A) A schematic diagram of retroviral DNA constructs used to transduce oncogenic NRAS and the vector control. Positions of restriction enzyme sites as well as probe used for Southern blot are indicated. (B) Western blot analysis of NIH3T3 cells infected with the NRAS retrovirus (lane 1) and the vector control (lane 2) using Ras and myc-tag antibodies. Detection of actin using an actin antibody was used as a loading control (bottom). The ratio between the intensity of exogenous RAS and endogenous Ras is about 1.5, and approximately 50% NIH3T3 cells were GFP positive (lane 1).
RAS-GTP assay
Levels of GTP-bound RAS in tissue samples were determined using the RAS activation assay kit (Upstate Biotechnology). Briefly, 1 × 10⁷ leukemic cells from AML and CMML mice were washed twice with PBS and lysed in the MLB buffer provided (25 mM HEPES, pH 7.5, 150 mM NaCl, 1% Igepal CA-630, 10 mM MgCl2, 1 mM EDTA, 10% glycerol, 10 μg/mL aprotinin, 10 μg/mL leupeptin). Lysates were incubated with Raf-1 RBD beads for 45 minutes at 4°C with gentle agitation. The beads were then collected by centrifugation and washed 3 times in MLB buffer and resuspended by boiling in 2 × Laemmli buffer. RAS was detected by Western blotting using a pan-RAS antibody (RAS10; Upstate Biotechnology). Total RAS levels were determined by Western blot analysis of an aliquot of the lysate removed before immunoprecipitation.
Bone marrow colony assays
Mononuclear bone marrow cells (1 × 10⁴) were suspended in methylcellulose medium with and without cytokines [M3434, which contains 50 ng/mL recombinant murine (rm) stem cell factor (SCF), 10 ng/mL rm interleukin 3 (IL-3), 10 ng/mL recombinant human (rh) IL-6, 3 U/mL rh erythropoietin (Epo), 10 μg/mL rh insulin, 200 μg/mL human transferrin, and M3231, which does not contain any cytokines, respectively; Stem Cell Technologies, Vancouver, BC, Canada] and plated in 1-mL duplicate cultures. The colonies were counted after 7 days in culture (in 5% CO2 at 37°C). For serial-replating assays, colonies were harvested every 7 days, and 1 × 10⁴ cells were replated in duplicate for each round.
Mice used in this project are housed in the Association for Assessment and Accreditation of Laboratory Animal Care International (AAALAC)– accredited Foster Animal Research Facility at Brandeis University. All experiments involving mice are approved by the Institutional Animal Care and Use Committee (IACUC) of Brandeis University.
Results
Oncogenic NRAS rapidly and efficiently induces CMML- and AML-like disease in mice
To determine the leukemogenicity of oncogenic NRAS, we constructed a retroviral vector expressing a myc-tagged NRASD12 mutant (Figure 1A). The expression of the activated NRAS protein was confirmed by Western blotting (Figure 1B). The level of exogenous NRAS is approximately 3 times that of endogenous Ras. We then infected bone marrow cells isolated from 5-fluorouracil–treated mice with retroviruses containing NRASD12 or vector alone and transplanted these cells into lethally irradiated syngeneic recipient mice.
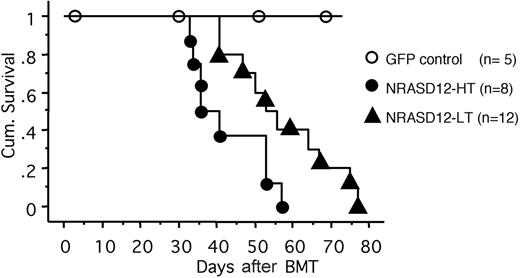
All the mice that received transplants of NRASD12-infected bone marrow cells (designated as NRASD12 mice) developed a fatal hematologic disease 4 to 11 weeks after bone marrow transplantation (BMT), with the latency of disease depending on the titer of the retrovirus used to infect the donor bone marrow cells (Figure 2). In contrast, all the vector control mice remained healthy during the course of the experiment (Figure 2).
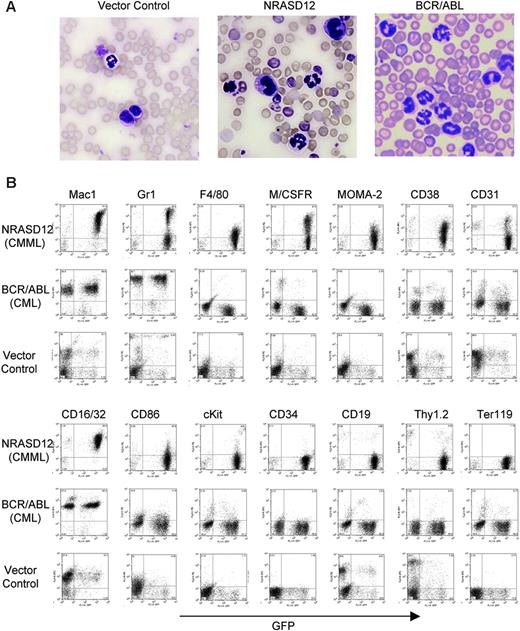
Hematopathologic analysis revealed that NRASD12 mice succumbed predominantly to either of 2 diseases with distinct characteristics. One disease is characterized by high peripheral WBC counts (typically ranging from 60 × 109 to 200 × 109/L [60 000 to 200 000/μL]) with a predominance of mature granulocytes and monocytes (Figure 3A). The diseased mice also develop anemia (hematocrit of about .286 [28.6%] on average, and peripheral RBC counts of about 3 ×10¹²/L [3 × 10⁶/μL]), massive splenomegaly (weighing 0.3-1.6 g, as compared with the normal spleen of 0.1 g), and moderate to massive hepatomegaly (weighing 1.3-3.6 g, as compared with the normal liver of about 1 g) as a result of infiltration of myeloid cells and extramedullary hematopoiesis. Bone marrow of the diseased mice was filled with myeloid cells, predominantly granulocytes and monocytes (data not shown). Consistent with the morphology of mature granulocytes and monocytes, flow cytometry analysis of peripheral WBCs showed 2 major populations. One expressed the granulocytic surface markers (Mac-1+, Gr-1hi, CD16/32+) and the other expressed monocytic cell-surface markers (Mac-1+,Gr-1lo/–, F4/80+, M/CSFR+, Moma-2+, CD16/32+, CD31+, CD86+, and CD38+) (Figure 3B). These features of oncogenic NRAS-induced MPD are similar to what is observed in the mouse models of other Ras pathway mutations18,19,26 yet different from that induced by BCR/ABL, which is characterized strictly by granulocytosis (Figure 3A-B). The leukemic cells from bone marrow, spleen, and liver of the diseased NRASD12 mice showed a flow cytometry profile similar to that of peripheral WBCs (data not shown). These features of the disease resemble human CMML.
Cumulative survival of NRASD12 mice and vector control mice. Cumulative survival of mice that received transplants of NRASD12 or control retrovirus–transduced bone marrow cells was generated by Kaplan-Meier survival analysis. Donor bone marrow cells were transduced under various titers of the NRASD12 retrovirus: approximately 6 × 10⁵ transduction units (TU)/mL for low titer (LT) and 7 × 10⁶ TU/mL for high titer (HT). The titer of vector control retrovirus in this particular experiment was 7 × 10⁶ TU/mL.
Cumulative survival of NRASD12 mice and vector control mice. Cumulative survival of mice that received transplants of NRASD12 or control retrovirus–transduced bone marrow cells was generated by Kaplan-Meier survival analysis. Donor bone marrow cells were transduced under various titers of the NRASD12 retrovirus: approximately 6 × 10⁵ transduction units (TU)/mL for low titer (LT) and 7 × 10⁶ TU/mL for high titer (HT). The titer of vector control retrovirus in this particular experiment was 7 × 10⁶ TU/mL.
Characterization of the NRASD12-induced CMML-like disease in mice. (A) Morphology of the peripheral WBCs of a representative vector control, NRASD12 and BCR-ABL mouse. Images were taken under a Zeiss Axioskop microscope (Carl Zeiss, Thornwood, NY) using a Zeiss Microscope Camera System and a 40×/1.0 oil-immersion objective lens. Images were processed with Adobe Photoshop 7.0 software (Adobe, San Jose, CA). (B) Flow cytometry analysis on the peripheral WBCs freshly isolated from a representative diseased NRASD12 mouse, BCR/ABL mouse, and a vector control mouse as indicated. The level of GFP expression is shown along the x-axis, and the y-axis shows the expression of cell-surface markers specified over each column.
Characterization of the NRASD12-induced CMML-like disease in mice. (A) Morphology of the peripheral WBCs of a representative vector control, NRASD12 and BCR-ABL mouse. Images were taken under a Zeiss Axioskop microscope (Carl Zeiss, Thornwood, NY) using a Zeiss Microscope Camera System and a 40×/1.0 oil-immersion objective lens. Images were processed with Adobe Photoshop 7.0 software (Adobe, San Jose, CA). (B) Flow cytometry analysis on the peripheral WBCs freshly isolated from a representative diseased NRASD12 mouse, BCR/ABL mouse, and a vector control mouse as indicated. The level of GFP expression is shown along the x-axis, and the y-axis shows the expression of cell-surface markers specified over each column.
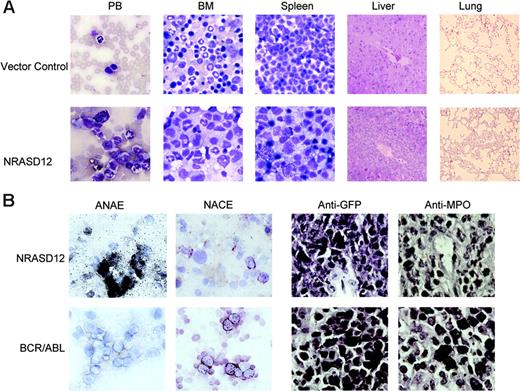
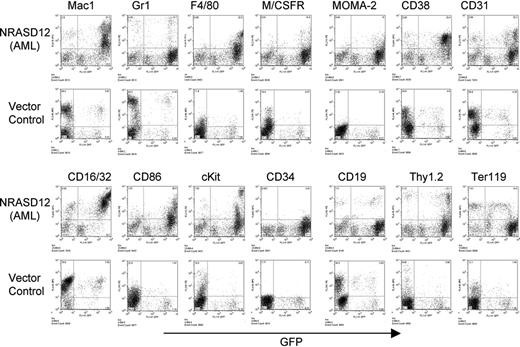
The other disease is characterized by a milder leukocytosis (ranging from 10 × 109 to 50 × 109/L [10 000 to 50 000/μL]) but generally more severe anemia (hematocrit of about .26 [26%]). Similar to the CMML mice, these mice also developed hepatosplenomegaly, resulting from infiltration of myeloid cells and extramedullary hematopoiesis (Figure 4A). Infiltration of leukemic cells was also seen in the lungs of the diseased mice (Figure 4A). The drastic difference between this disease and the CMML-like disease is that the myeloid cells in peripheral blood, spleen, liver, and bone marrow are mostly immature (Figure 4A) (approximately 29% ± 4% blast cells in the peripheral blood of AML mice as compared with 0.8% ± 1.3% in CMML mice). Flow cytometry analyses show that the majority of the GFP-positive cells are Mac-1+ CD38+, and CD16/32+ but Gr-1lo/–, M/CSFR–, and MOMA-2–. A fraction of the leukemic cells also express CD117 (c-Kit), CD34, Thy1.2, F4/80, CD86, and CD31, indicating a mixed blast and differentiated monocytic population (Figure 5). Consistent with the immunophenotyping, cytochemical and histoimmunochemical analyses revealed that most tumor cells are ANAE positive, but NACE and MPO negative (Figure 4B). These features of the disease resemble human acute monocytic leukemia (AML-M5). Similar results were seen in 2 other repeating experiments (summarized in Table 1). In all our experiments, mice receiving bone marrow cells transduced with a high titer of NRASD12 retroviruses exhibited predominantly the AML-like disease (90% of the diseased mice on average) and generally had shorter latencies, whereas the incidence of AML-like disease decreased in low-titer virus mice (approximately 50%-60% AML).
Hematopathologic, cytochemical, and histoimmunologic analysis of the N-RasD12–induced AML-like disease in mice. (A) Hematopathologic analysis of affected tissues in a representative NRASD12 mouse that succumbed to AML-like disease. Peripheral blood smears, bone marrow smears, and spleen touch preparations (from left to right) from vector control (top row) and a NRASD12 mouse (bottom row) were stained with the HEMA3 stains. Original magnification was × 630. Paraffin sections of liver and lung (rightmost columns) from vector control and NRASD12 mice were stained with hematoxylin and eosin. Images are magnified × 200. (B) Esterase staining for specific and nonspecific esterases (the left 2 columns) on WBCs from a diseased NRASD12 (top row) and a BCR-ABL (bottom row) mouse. The right 2 columns show a histoimmunochemical analysis of spleen sections from a diseased NRASD12 mouse with AML-like disease and a BCR-ABL mouse with CML-like disease, with anti-GFP (staining for leukemic cells) and anti-MPO antibodies, as indicated.
Hematopathologic, cytochemical, and histoimmunologic analysis of the N-RasD12–induced AML-like disease in mice. (A) Hematopathologic analysis of affected tissues in a representative NRASD12 mouse that succumbed to AML-like disease. Peripheral blood smears, bone marrow smears, and spleen touch preparations (from left to right) from vector control (top row) and a NRASD12 mouse (bottom row) were stained with the HEMA3 stains. Original magnification was × 630. Paraffin sections of liver and lung (rightmost columns) from vector control and NRASD12 mice were stained with hematoxylin and eosin. Images are magnified × 200. (B) Esterase staining for specific and nonspecific esterases (the left 2 columns) on WBCs from a diseased NRASD12 (top row) and a BCR-ABL (bottom row) mouse. The right 2 columns show a histoimmunochemical analysis of spleen sections from a diseased NRASD12 mouse with AML-like disease and a BCR-ABL mouse with CML-like disease, with anti-GFP (staining for leukemic cells) and anti-MPO antibodies, as indicated.
To assess the in vitro growth of bone marrow progenitors from NRASD12 AML and CMML mice, we performed bone marrow colony assays. Bone marrow cells from AML, CMML, and vector control mice were cultured in methylcellulose in the presence and absence of cytokines (SCF, IL-3, IL-6, and Epo). AML cells, but not CMML and normal marrow cells, were able to grow in the absence of cytokines at a low efficiency (Table 2). Surprisingly, the number of colonies in cultures from AML and CMML cells was markedly reduced compared with the normal marrow cells in the presence of cytokines. In addition, the in vitro self-renewal capacities of progenitor cells from AML and CMML mice, as measured by serial replating assay, were reduced compared with normal marrow cells (Table 2). It is possible that growth of leukemic cells requires the in vivo environment. Alternatively, the frequency of progenitors with self-renewal capacity is low in diseased mice, possibly because of the presence of large numbers of nonproliferating tumor progeny. Note that, although the frequency of replating colony-forming units (CFUs) is reduced in the marrow, the total number is not necessarily low and may even be elevated as a result of the massive infiltration of myeloid cells in the spleen.
Immunophenotyping of bone marrow cells isolated from NRASD12 mouse with AML-like disease and from a vector control mouse. The expression of GFP is shown along the x-axis, and the y-axis shows the expression of cell-surface markers specified over each column.
Immunophenotyping of bone marrow cells isolated from NRASD12 mouse with AML-like disease and from a vector control mouse. The expression of GFP is shown along the x-axis, and the y-axis shows the expression of cell-surface markers specified over each column.
To assess the inheritability of AML- and CMML-like disease in vivo, we performed secondary transfer experiments (Table 3). Each lethally irradiated recipient mouse received a transplant of 1 × 10⁶ bone marrow cells plus 1 × 10⁶ splenic cells from primary AML or CMML mice along with 1 × 10⁵ normal bone marrow cells. Most of the recipients of tumor cells from primary AML mice did develop an AML-like disease. Some secondary mice also developed T-cell tumors, and a few mice did not develop signs of disease (Table 3; data not shown). Among the CMML secondary recipient mice, 2 of 8 developed CMML-like disease, whereas 4 developed AML and 2 died before diagnosis could be made. These results demonstrate that NRASD12-induced leukemia is transplantable, an indication of the existence of self-renewal leukemic stem cells in diseased mice.
In addition to the above predominant phenotypes, the majority of diseased mice have an increased number of mast cells in the peripheral blood, bone marrow, spleen, and liver (data not shown). These cells have a positive reaction to naphthyl AS-d chloracetate, are stained by Toluidine Blue, and express high levels of c-Kit (Figure 5; data not shown). The level of mastocytosis varied from animal to animal, with the proportion of mast cells in the peripheral blood and other tissues ranging from 5% to 35%, as determined by the proportion of cells expressing high levels of c-Kit. These results demonstrate that oncogenic NRAS can also induce mastocytosis in mice. Consistently, it was recently shown that expression of oncogenic NRAS in a transgenic mouse strain using tetracycline transactivator driven by the Vav hematopoietic promoter induces mast cell disease.27 Interestingly, the c-Kithi mast cells expressed high levels of GFP (Figure 5), suggesting that induction of mastocytosis requires high levels of oncogenic N-Ras and that the myeloid and mast cell diseases arise from different target cells.
Clonality of NRASD12-induced leukemia
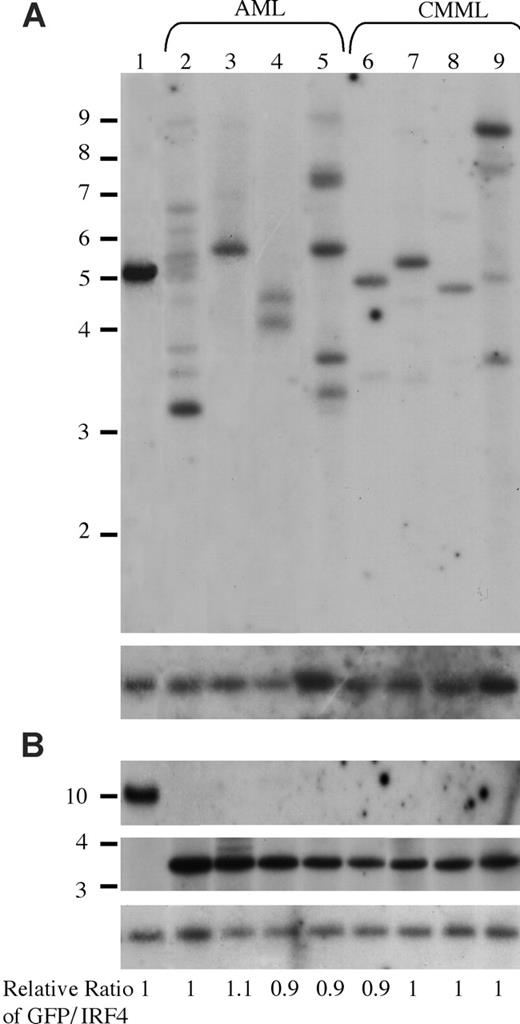
It is interesting that oncogenic NRAS induces both AML and CMML in mice and that a higher NRASD12 retroviral titer correlates more frequently with the development of AML. To gain insights into the mechanism of NRASD12-induced AML versus CMML, we first examined the clonality of AML versus CMML by Southern blot analysis on genomic DNA isolated from AML and CMML cells (Figure 6). Restriction enzyme BglII, which recognizes a unique site in the NRASD12 proviral DNA, was used to check proviral integration and XbaI, which cleaves the NRASD12 proviral DNA at the long terminal repeats, was used to check the integrity and the total amount of proviruses (Figure 1A). Genomic DNA isolated from a cloned MSCV-BCR/ABL-IRES-GFP– infected 32D cell line was used as a single-copy provirus control (see “Materials and methods” and Figure 6 lane 1). The gene encoding GFP was used as a probe. After probing with 32P-labeled GFP, the blot was stripped and reprobed with a 32P-labeled irf-4 DNA fragment to check for loading. The relative ratios of proviral DNA to the irf4 loading control of most samples are equal or close to that of the cell line control (Figure 6), indicating that most leukemic cells have a single copy of proviral DNA. Lanes 2, 5, and 9 show several BglII bands, indicating the oligoclonal nature of the disease. Although some lanes (eg, lanes 7 and 8) appear to have a single band, the intensity of these bands is weaker than the single-copy proviral control, as well as their corresponding XbaI band. This implies the presence of additional clones, albeit smaller. These results indicate that the majority of AML as well as CMML are oligoclonal.
Analysis of NRASD12 proviral integration in AML and CMML tissues. (A) For analysis of NRASD12 proviral integration in diseased mice, genomic DNA from the livers of NRASD12 mice that succumbed to AML-like disease (lanes 2-5) and CMML-like disease (lanes 6-9) was digested with BglII and probed with a 0.7-kb 32P-labeled GFP probe. Lane 1 is a control to establish levels of a single copy of the provirus. The blot was then stripped and reprobed with a 1.4-kb 32P-labeled irf4 probe as a loading control (bottom). (B) Genomic DNA was digested with XbaI, which cuts within the LTRs, to show intactness of the provirus. The top panel shows the MSCV-BCR/ABL-IRES-GFP single copy provirus control, which is larger in size than the RAS provirus. The blot was stripped and reprobed with an irf4 probe as a loading control (bottom). The relative ratios of proviral DNA to the irf4 loading control as compared with that of the cell line control are shown.
Analysis of NRASD12 proviral integration in AML and CMML tissues. (A) For analysis of NRASD12 proviral integration in diseased mice, genomic DNA from the livers of NRASD12 mice that succumbed to AML-like disease (lanes 2-5) and CMML-like disease (lanes 6-9) was digested with BglII and probed with a 0.7-kb 32P-labeled GFP probe. Lane 1 is a control to establish levels of a single copy of the provirus. The blot was then stripped and reprobed with a 1.4-kb 32P-labeled irf4 probe as a loading control (bottom). (B) Genomic DNA was digested with XbaI, which cuts within the LTRs, to show intactness of the provirus. The top panel shows the MSCV-BCR/ABL-IRES-GFP single copy provirus control, which is larger in size than the RAS provirus. The blot was stripped and reprobed with an irf4 probe as a loading control (bottom). The relative ratios of proviral DNA to the irf4 loading control as compared with that of the cell line control are shown.
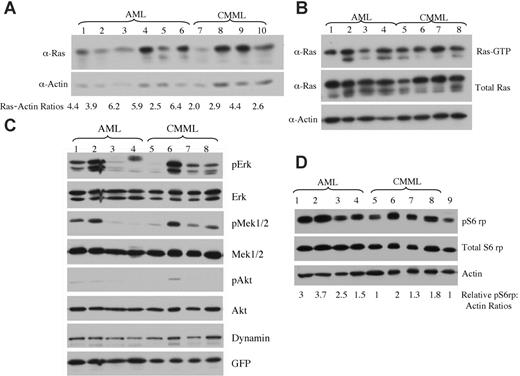
Expression levels of oncogenic NRAS and activation of downstream effectors in AML versus CMML mice. (A) Lysates of tumor cells isolated from livers of mice with AML or CMML were run on a 6% to 18% gradient polyacrylamide gel and transferred to a nitrocellulose membrane. The membranes were blotted with anti-Ras and antiactin antibodies to show the expression of oncogenic NRAS with actin as loading control. The ratio of relative expression of 2Xmyc-NRASD12 to that of actin was calculated using the NIH Image 1.63 software. (B) Level of activated Ras in AML and CMML samples was measured by using Raf1-RBD to pull down GTP-bound Ras proteins. (C-D) Activation of effector pathways downstream of Ras was tested in AML and CMML samples by immunoblotting for the indicated proteins. Relative ratios of pS6rp and actin are indicated (D). Samples in lanes 1 to 8 of panels B, C, and D were the same. Lane 9 in panel D is the sample from a vector control mouse.
Expression levels of oncogenic NRAS and activation of downstream effectors in AML versus CMML mice. (A) Lysates of tumor cells isolated from livers of mice with AML or CMML were run on a 6% to 18% gradient polyacrylamide gel and transferred to a nitrocellulose membrane. The membranes were blotted with anti-Ras and antiactin antibodies to show the expression of oncogenic NRAS with actin as loading control. The ratio of relative expression of 2Xmyc-NRASD12 to that of actin was calculated using the NIH Image 1.63 software. (B) Level of activated Ras in AML and CMML samples was measured by using Raf1-RBD to pull down GTP-bound Ras proteins. (C-D) Activation of effector pathways downstream of Ras was tested in AML and CMML samples by immunoblotting for the indicated proteins. Relative ratios of pS6rp and actin are indicated (D). Samples in lanes 1 to 8 of panels B, C, and D were the same. Lane 9 in panel D is the sample from a vector control mouse.
Expression levels of NRASD12 and activation of RAS downstream signaling pathways in AML versus CMML
Because retrovirus-mediated transgene expression varies in target cells depending on its site of integration in the host chromosome,28 the probability of transduced cells with high levels of transgene expression increases with increasing retroviral titer. We examined whether the expression level of NRASD12 was responsible for the distinct diseases induced in mice. We checked the expression of oncogenic NRAS by Western blot analysis on tumor cell lysates from AML and CMML mice (Figure 7A). We calculated the ratios of myc-NRASD12 to actin using the NIH Image1.63 software. We found that AML samples generally expressed NRASD12 at higher levels as compared with the CMML samples, and this difference was statistically significant, with a P value of .04. All samples contained a comparable proportion of GFP-positive cells (data not shown), ruling out the possibility that the difference is due to the number of leukemic cells in the samples. Consistent with NRASD12 expression, the average levels of GFP expression are also significantly higher in samples from AML compared with CMML mice (data not shown). These results suggest that overexpression of oncogenic NRAS may contribute to the development of AML. Note that not all AML samples had higher NRASD12 expression than CMML samples, suggesting that the mechanism of development of AML may vary in different mice.
We further examined the activation (GTP-binding) of NRAS in samples from CMML and AML mice. We used the Raf1-RBD to pull down RAS-GTP from lysates of leukemic cells from CMML and AML mice and detected RAS-GTP by Western blot analysis using a pan-RAS antibody. A large fraction of overexpressed NRAS and some endogenous Ras proteins were found in GTP-bound form in samples from CMML and AML mice (Figure 7B).
The activation of signaling proteins Mek, Erk, Akt, and phospho-S6 ribosomal protein (pS6rp) that are downstream of RAS was also examined on samples from AML and CMML mice (Figure 7C-D). The MAPK pathway was variably activated in most AML and CMML samples (as evidenced by constitutive phosphorylation of Mek and Erk) (Figure 7C). Akt, however, was only weakly activated in a fraction of leukemic samples. Interestingly, phosphorylation of S6rp was elevated consistently in all NRASD12 AML samples, as well as in most CMML samples (Figure 7D). The average level of pS6rp was significantly higher in AML samples than that of CMML (P = .04), suggesting that the activation of S6rp may play an important role in the pathogenesis of AML.
Discussion
In this study we have established that oncogenic NRAS can rapidly and efficiently induce myeloid malignancies resembling human CMML and AML. The results demonstrate that oncogenic NRAS can function as an initiating oncogene in the induction of myeloid malignancies. Our new model for oncogenic NRAS-induced myeloid malignancies is more effective and efficient than previous mouse models. It is likely that the ability of MSCV to target transgene expression in hematopoietic stem/progenitor cells makes the induction of myeloid malignancies by oncogenic NRAS more effective.
Activating RAS mutations have been found in a broad range of myeloid malignancies, including CMML, AML, MDS, and juvenile myelomonocytic leukemia (JMML) (reviewed in Reuter et al9 ). Similar to oncogenic KRAS, shown in a recent conditional knock-in mouse strain,18,19 oncogenic NRAS can efficiently induce an MPD resembling human CMML in mice. These results suggest that both oncogenic NRAS and KRAS are sufficient in the induction of CMML. Conditional knock-in of cancer-related genes in mice is a powerful tool for developing mouse models for human cancers, for further studies of cancer progression, and for testing cancer therapies. The mouse BMT model system, however, is advantageous in performing in vivo structure-function analyses of cancer-related genes by screening a large number of mutants.29,30 Examining the leukemogenic potential of various mutants of oncogenic RAS using this model will help to identify critical effector(s) of oncogenic RAS in the pathogenesis of myeloid malignancies. Such research is important for developing therapeutic interventions for myeloid malignancies.
Different from the expression of oncogenic KRAS under the control of its endogenous promoter, oncogenic NRAS also induced AML in the mouse bone marrow transduction and transplantation model. Interestingly, the proportions of CMML versus AML induced by oncogenic NRAS are affected by retroviral titers (40% versus 60% in low-titer virus mice and 10% versus 90% in high-titer virus mice, respectively). This correlation may be because retroviral titer can affect the levels of transgene expression and the probability of insertional activation of oncogenes. Indeed, we found that oncogenic NRAS is expressed at higher levels in the majority of AML mice as compared with CMML mice (Figure 7A), suggesting that overexpression of oncogenic NRAS may contribute to the development of AML in mice. Consistent with this hypothesis, it has been shown that overexpression of oncogenic and wild-type RAS is commonly found in human AML.31,32 However, although oncogenic NRAS-induced AML contained multiple tumor clones (Figure 6), we could not rule out the possibility that secondary mutations because of proviral integration also contribute to the development of AML.
Unlike oncogenic transcription factor fusion proteins, which often associate with a specific subtype of AML (eg, AML1/ETO is mostly found in M2 subtype of AML), RAS mutations have been found in all subtypes of AML, although there is a preference of RAS mutations in acute monocytic leukemia (AML-M5) and acute myelomonocytic leukemia (AML-M4) (reviewed in Bos8 ). In this study, we found that oncogenic NRAS predominantly induced acute monocytic leukemia. It is possible that oncogenic RAS primarily transforms monocytic cells, whereas the presence of other oncogenes may contribute to the development of other subtypes of AML (eg, coexpression of oncogenic RAS and PML-RARα may facilitate the development of acute promyelocytic leukemia). This hypothesis can be tested by detailed studies of clinical samples from various patients with AML and subsequently by studies of cooperation between oncogenic RAS and other oncogenes in animal models. In addition, certain features of AML induced by oncogenic NRAS differ from those induced by transcription factor type of oncogenes. Our bone marrow cell replating and secondary transfer experiments have shown that the frequency of the self-renewing leukemic stem cell was low in NRASD12-induced AML. It is likely that AML with RAS mutations as the initiating oncogenic event differs from those initiated by transcription factor type of oncogenes.
The importance of the RAS pathway in the pathogenesis of myeloid malignancies is also reflected in functional activation of RAS by altering genes that directly or indirectly regulate RAS, such as BCR/ABL. Although both oncogenic RAS and BCR/ABL efficiently induce MPD in mice, the diseases are distinctive from one another. In particular, NRAS-induced CMML-like disease involves expansion of both granulocytic and monocytic lineages, whereas BCR/ABL-induced CML-like disease is largely restricted to the granulocytic lineage (Figure 3). These results suggest that, although BCR/ABL activates the RAS pathway and RAS plays an important role in BCR/ABL leukemogenesis (reviewed in Ren33 ), other signaling pathways activated by BCR/ABL may restrict lineage-specific transformation. Identification of such pathways will help to understand the role of signaling in the determination and/or selection of granulocytic versus monocytic lineages.
RAS proteins can interact with a wide spectrum of effectors that play either positive or negative roles in the control of cell proliferation and survival.34 Cellular transformation of different cell types by oncogenic RAS has been shown to require different RAS effectors.35 We found that Mek, Erk, and Akt were variably activated in most NRASD12-induced AML and CMML (Figure 7C). The variations seen in the activation of Ras downstream signaling proteins may be due to different signaling pathways involved in NRASD12 leukemogenesis in different mice or due to different compositions of tumor cells. We will test these possibilities in future experiments. Interestingly, phosphorylation of S6rp was consistently elevated in NRASD12 AML samples (Figure 7D), and the average level of pS6rp was significantly higher in AML samples than that of CMML. The phosphorylation of S6rp correlates with an increase in translation, particularly of mRNAs encoding proteins involved in cell-cycle progression and protein synthesis.36 Up-regulation of translation is necessary for sustained cell growth and division. Our results suggest that the pathway(s) leading to activation of S6rp may play an important role in NRAS leukemogenesis, in particular the development of AML.
As mentioned earlier, both oncogenic NRAS and KRAS are implicated in human myeloid malignancies. However, although both NRAS and KRAS are capable of activating a common set of downstream effectors, it is evident that the association with different microdomains of the plasma membrane as well as other internal cell membranes allows the RAS proteins to access different pools of RAS regulators and/or effectors and, therefore, generates distinct signal outputs.3 It is possible that NRAS and KRAS activate different combinations of downstream signaling pathways and cooperate with different secondary mutations in the pathogenesis of leukemia. Consistent with this idea, recent studies showed that NRAS and KRAS mutations are preferentially associated with distinct cytogenetic subgroups in AML.37 In addition, differences in the modification processes of NRAS and KRAS also provide distinct targets for developing therapies. Studies of both NRAS and KRAS leukemogenesis, therefore, are needed. The mouse model for NRAS leukemogenesis established here would be useful for further studying the molecular mechanism in the pathogenesis of myeloid malignancies and for testing relevant therapies.
Prepublished online as Blood First Edition Paper, June 8, 2006; DOI 10.1182/blood-2004-08-009498.
Supported by the National Cancer Institute (grant CA68008) (R.R.).
C.P. and R.S. contributed equally to this work.
The publication costs of this article were defrayed in part by page charge payment. Therefore, and solely to indicate this fact, this article is hereby marked “advertisement” in accordance with 18 U.S.C. section 1734.
We thank Kirsten Tracy for assistance in analyzing diseased mice.

