Abstract
There is growing recognition that HIV-1 infection leads to an activation of the immune system that includes perturbations of cytokine expression, redistribution of lymphocyte subpopulations, cell dysfunction, and cell death. Here, we explored the relationships between HIV-1 infection and immune activation in chronically HIV-1–infected human lymph nodes. In addition to CD4 T-cell depletion, we found increased effector T-cell frequencies associated with profound up-regulation of an activation marker CD38 in naive, central memory, and effector CD4+ and CD8+ T cells. Likewise, Fas death receptor (CD95) was more frequently detectable on T cells from HIV-1 nodes. Dendritic cell (DC) depletion was dramatic, with plasmacytoid DCs (PDCs) 40-fold and myeloid DCs (MDCs) 20-fold less frequent in HIV+ nodes than in control nodes. Cytokine dysregulation was evident, with IL-2 and IL-15 as much as 2 or 3 logs greater in infected nodes than in control nodes. Thus, activated effector cells are inappropriately attracted and/or retained in lymphoid tissue in chronic HIV-1 infection. High-level cytokine expression in turn activates and retains more cells at these sites, leading to lymphadenopathy and massive bystander activation that characterizes HIV-1 infection. Strategies targeting these activation pathways may lead to new therapies.
Introduction
CD4 T-cell loss is a hallmark of progressive HIV-1 disease.1,2 Rapid depletion of memory CD4+ T cells occurs during the acute stage of HIV-1 infection,3 followed by a more gradual loss of circulating CD4+ T cells accompanied by progressive functional impairment.4 Despite an extensive literature that has characterized the cellular phenotypes and cellular function in progressive HIV-1 infection,5 the mechanisms whereby HIV-1 infection promotes progressive immune deficiency remain poorly understood. There is a growing recognition that HIV-1 infection leads to a general activation of the immune system, which results in complex perturbations of cytokine expression, redistribution and sequestration of lymphocyte subpopulations, heightened cellular turnover, and both cell dysfunction and cell death (reviewed in Grossman et al6 ).
In the present work, we explored these relationships by studying cytokine expression spectra and distributions of T-cell subsets in chronically infected human lymphoid tissue where many critical events in HIV-1 pathogenesis are thought to occur.7 We compared freshly excised and cultured lymph nodes obtained from patients with chronic HIV-1 with those from patients without HIV-1. We found that chronically infected lymph nodes contain proportionally fewer CD4+ T cells, increased proportions of effector T cells, and fewer plasmacytoid and myeloid dendritic cells (PDCs and MDCs, respectively). Chronic HIV-1 infection leads to dramatic changes in the lymph node cytokine profile, and within the infected nodes, both CD8+ and CD4+ T cells are abnormally activated.
Patients, materials, and methods
Patients
Whole pelvic lymph nodes were obtained from adult men and women with and without HIV-1 who were undergoing medically indicated surgery at University Hospitals of Cleveland (Cleveland, OH). A total of 36% of the patients were male, and median age was 49 years (range, 43-53 years) and 38 years (range, 35-54 years) in the HIV-1− and HIV-1+ groups, respectively (Tables 1–2). Among the HIV-1+ group, 70% were receiving combination antiretroviral therapy (ART), 30% had plasma HIV-1 RNA levels less than 100 copies/mL, the median CD4+ T-cell count was 255 CD4 cells/μL blood (interquartile range, 55-320 CD4 cells/μL blood), and the median HIV-1 RNA load was 30 500 copies/mL plasma (range, 75-82 500 copies/mL plasma). This protocol was approved by the institutional review board at Case Western Reserve University/University Hospitals of Cleveland. All patients provided written informed consent in accordance with the Declaration of Helsinki.
Human lymph node histoculture
Lymph nodes were dissected, cultured at the air-liquid interface, and maintained as described elsewhere.8 Tissue blocks were placed on collagen sponge gels and cultured for 15 days in culture medium composed of RPMI 1640 (GIBCO BRL, Grand Island, NY) containing 15% heat-inactivated fetal calf serum (FCS; Summit Biotechnology, Fort Collins, CO), nonessential amino acids (1 mM), sodium pyruvate (1 mM), l-glutamine (292 μg/mL), amphotericin B (2.5 μg/mL; GIBCO BRL) and gentamicin (50 μg/mL; Quality Control Inc, Rockville, MD). Using p24 enzyme-linked immunosorbent assay (ELISA), we detected HIV-1 replication in tissues of 8 of 11 patients with HIV-1, with a median p24 production of 1046 pg/mL (range, 645-2462 pg/mL).
Flow cytometry
Upon receipt of tissue on day 1, single-cell suspensions were prepared from tissue blocks by digestion with a 5 mg/mL solution of collagenase IV (GIBCO BRL) in RPMI 5% FCS for 30 minutes. Digested blocks were shaken out with a pestle, and the released cells were washed with staining buffer (PBS 2% NMS [GIBCO BRL]). Lymphocytes were identified according to their light-scatter properties and then analyzed for surface-marker expression using the following fluorochrome-labeled monoclonal antibodies: anti-CD95–FITC, anti-CD4–PE-Alexa610, anti-CD38–PerCP-Cy5.5, anti-CD3–PE-Cy7, anti-CD25–APC, anti-CD8–APC-Cy7, anti-CD45RO–APC, anti-CD62L–APC-Cy7, anti-CD20–PE, and anti-CD19–PE-Cy5 (Caltag Laboratories, Burlingame, CA). MDCs and PDCs were identified by their failure to stain with the FITC-conjugated lineage cocktail (CD3, CD14, CD16, CD19, CD20, and CD56 monoclonal antibodies [mAbs]; Becton Dickinson, San Jose, CA) and by binding of CD123-PE, HLA-DR–PE-Cy5.5, and CD11c-APC (Caltag Laboratories). Cells were then washed, fixed in PBS containing 4% formaldehyde, and acquired on an LSRII flow cytometer (Becton Dickinson) equipped with lasers emitting at wavelengths 355, 488, 532, 407 and 638 nm using the DIVA 4.1.2 software (Becton Dickinson, San Jose, CA). Data were analyzed with the Flowjo software (Tree Star, San Carlos, CA).
Cytokine production
Levels of the cytokines IL-1α, IL-1β, IL-2, IL-4, IL-7, IL-10, IL-12, IL-15, IL-16, macrophage inflammatory protein-1α (MIP-1α; CCL3), MIP-1β (CCL4), regulated on activation normally T-cell expressed and secreted (RANTES; CCL5), monokine induced by IFN-γ (MIG; CXCL9), granulocyte-macrophage colony-stimulating factor (GM-CSF), IFN-γ–inducible protein-10 (IP-10; CXCL10), IFN-γ, tumor necrosis factor (TNF)–α, transforming growth factor-β (TGF-β), and stromal derived factor-1β (SDF-1β; CXCL12) in culture medium were evaluated using a multiplex bead array assay. All the antibodies and cytokine standards were purchased as antibody pairs from R&D Systems (Minneapolis, MN). Individual Luminex bead sets (Luminex, Riverside, CA) were coupled to cytokine-specific capture antibodies according to the manufacturer's recommendations. Conjugated beads were washed and kept at 4°C until use. Biotinylated polyclonal antibodies were used at twice the concentrations recommended for a classical ELISA (according to the manufacturer, R&D Systems, Minneapolis, MN). All assay procedures were performed in assay buffer containing PBS supplemented with 1% normal mouse serum (GIBCO BRL), 1% normal goat serum (GIBCO BRL), and 20 mM Tris-HCl (pH 7.4). The assays were run using 1200 beads per set of each of 20 cytokines measured per well in a total volume of 50 μL. A total of 50 μL of each sample was added to the well and incubated overnight at 4°C in a Millipore Multiscreen plate (Millipore, Billerica, MA). The liquid was then aspirated using a Vacuum Manifold (Millipore), and the plates were washed twice with 200 μL of assay buffer. The beads were then resuspended in 50 μL of assay buffer containing biotinylated polyclonal antibodies against the measured cytokines for 30 minutes at room temperature. The plates were washed twice with PBS, the beads were resuspended in 50 μL of assay buffer, and 50 μL of a 16 μg/mL solution of streptavidin-PE (Molecular Probes, Eugene, OR) was added to each well. The plates were read on a Luminex-100 platform. For each bead set of the 20 tested, a minimum of 61 beads was collected. The median fluorescence intensity of these beads was recorded for each bead and was used for analysis with the Bioplex Manager software (version 4.0; Bio-Rad, Hercules, CA) using a 5P regression algorithm.
Statistical analysis
We used conventional measures of central tendency and dispersion to describe the data. Unless otherwise specified, we use medians (25th-75th percentiles) to summarize continuous variables. We compared data obtained with a minimum of 6 tissue blocks per experimental condition from each donor (n), which were considered a single experiment. We compared continuous variables between groups using the Mann-Whitney U test, without correction for multiple comparisons, and used the Spearman rank correlation coefficient to test for associations between pairs of continuous variables. All tests are 2-tailed, and a P value of .05 or lower was considered nominally significant.
Results
Abnormal activation and depletion of CD4 T cells in lymph nodes of patients chronically infected with HIV-1
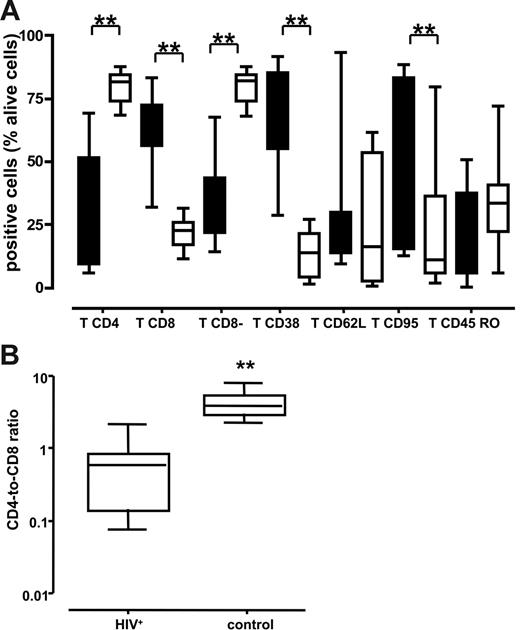
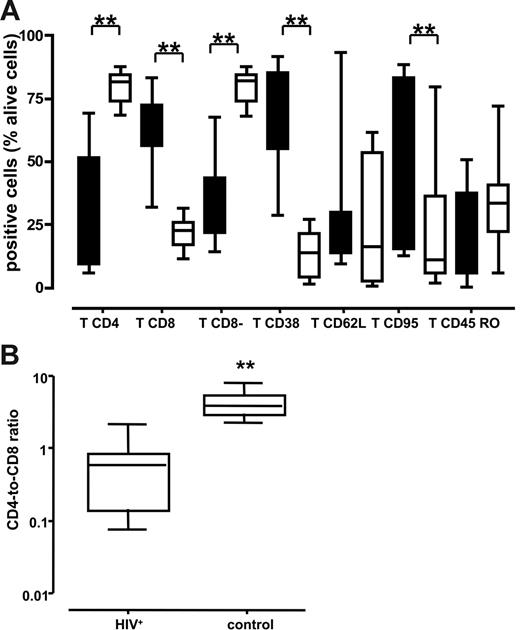
We immunotyped cells from normal and chronically HIV-1–infected lymph nodes by digesting tissue blocks with collagenase IV and flow cytometric analyses. Cells were isolated from 3 tissue blocks from each lymph node obtained from 10 patients with HIV-1 and 10 patients without HIV-1. Cells were immunostained for expression of CD3, CD8, CD4, CD38, CD95, CD62L, and CD45RO. The pooled data are presented in Figure 1A. The fraction of T lymphocytes that were CD4+ was significantly smaller in the HIV-1+ nodes than in the lymph nodes from patients without HIV-1: 37.1% (range, 9%-51.5%) versus 81.7% (range, 73.6%-84.6%) (P < .001). This was further confirmed by enumerating CD8− T lymphocytes that predominantly consisted of CD4+ T cells and CD4+ cells that down-regulated CD4 as a result of HIV-1 infection. In HIV-1–infected lymph nodes, the fraction of these cells was smaller than in uninfected nodes: 35.25% (range, 21.5%-43.45%) versus 82% (range, 73.6%-84.35%) (P < .001). Accordingly, the fraction of CD8+ T lymphocytes in the HIV-1–infected lymph nodes was larger than in the nodes of patients without HIV-1: 63.2% (range, 56%-72.5%) versus 22.6% (range, 16.7%-25.8%) (P < .001). Not surprisingly therefore, the CD4/CD8 T-cell ratio was dramatically lower in the HIV-1+ nodes than in the uninfected lymph nodes: 0.59 (range, 0.14-0.84) versus 3.95 (range, 2.97-5.70) (P < .001) (Figure 1B).
Lymphocytes of various immunotypes in lymph nodes of patients chronically infected with HIV-1 and patients without HIV-1. Phenotype of cells was characterized by flow cytometry after staining with specific antibodies against surface markers at day 1 after surgery. The numbers shown are the percentage of viable T cells. **P < .05 as evaluated by nonparametric Mann-Whitney test. (A) Distribution of lymph node lymphocytes. Boxes represent the 25th-75th percentile of data; medians are indicated, and bars represent the data range of patients with chronic HIV-1 (n = 10; ▪) and patients without HIV-1 (n = 10; □). (B) Ratio of CD4/CD8 lymphocytes. Boxes represent the 25th-75th percentile of data; medians are indicated, and bars indicate the data ranges of the ratio for lymph nodes from 10 chronically infected (left panel) and 10 uninfected (right panel) individuals. For each donor tissue, the number of CD4 and CD8 T cells was measured in 3 pooled tissue blocks and uninfected control.
Lymphocytes of various immunotypes in lymph nodes of patients chronically infected with HIV-1 and patients without HIV-1. Phenotype of cells was characterized by flow cytometry after staining with specific antibodies against surface markers at day 1 after surgery. The numbers shown are the percentage of viable T cells. **P < .05 as evaluated by nonparametric Mann-Whitney test. (A) Distribution of lymph node lymphocytes. Boxes represent the 25th-75th percentile of data; medians are indicated, and bars represent the data range of patients with chronic HIV-1 (n = 10; ▪) and patients without HIV-1 (n = 10; □). (B) Ratio of CD4/CD8 lymphocytes. Boxes represent the 25th-75th percentile of data; medians are indicated, and bars indicate the data ranges of the ratio for lymph nodes from 10 chronically infected (left panel) and 10 uninfected (right panel) individuals. For each donor tissue, the number of CD4 and CD8 T cells was measured in 3 pooled tissue blocks and uninfected control.
Analysis of lymphocyte activation revealed that there were substantially more T cells expressing CD38 in the HIV-1–infected lymph nodes than in lymph nodes from people without HIV-1: 73.3% (range, 54.8%-85.4%) versus 13.7% (range, 3.8%-21.4%) (P < .001). We found no significant differences in tissue expression of the lymphoid adhesion molecule CD62L or in the proportion of cells expressing the CD45RO isoform between donors with and without HIV-1 (P = .28 and .17, respectively). We also measured expression of the Fas death receptor CD95 and we found that CD95 was more frequently detectable on T cells isolated from HIV-1–infected lymph nodes than on T cells from lymph nodes of patients without HIV-1 (51.4% [range, 15.1%-83.3%] versus 10.9% [range, 5.5%-36.3%]; P = .015). Thus, lymph nodes from patients with chronic HIV-1 infection contained proportionally fewer CD4 T cells than did lymph nodes from patients without HIV-1, and those T cells that remained in the tissue revealed a heightened activation status and increased expression of the Fas death receptor.
Lymph nodes in chronic HIV-1 infection are abnormally enriched for effector T cells
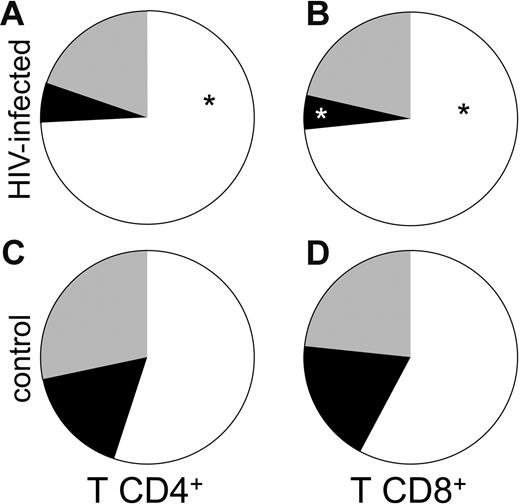
We hypothesized that the heightened state of immune activation in these tissues might be related to the accumulation of effector T cells at these sites, as viral replication at these sites may attract and promote retention of these cells that are otherwise expected to accumulate in tissue rather than lymph nodes.9 We therefore evaluated the proportions of CD4+ and CD8+ T cells with central memory (CD45RO+ CD62L+), effector (CD45RO+/− CD62L−) and naive (CD45RO− CD62L+) phenotypes in these lymph nodes. As shown in Figure 2A, the fraction of effector CD4+ T cells in HIV-1–infected lymph nodes (n = 8) was larger than in uninfected control tissues (n = 5) (Figure 2C): 74.3% ± 6.3% versus 54.9% ± 5%; P = .05. In contrast, the fraction of central memory CD4+ T cells was larger in uninfected lymph nodes than in HIV-1–infected ones: 16.6% ± 2.4% (n = 5) versus 5.9% ± 2% (n = 8), but this difference did not reach statistical significance (P = .06). The proportions of naive cells in lymph nodes from patients with chronic HIV-1 and patients without HIV-1 were similar: 19.8% ± 6% (n = 8) versus 28.4% ± 8.9% (n = 5; P = .21).
Subpopulation of naive and memory CD4 and CD8 T cells in lymph nodes of patients with chronic HIV-1 and patients without HIV-1. Cells were phenotyped by flow cytometry at day 1 after surgery. Presented are the mean numbers of living T cells expressing CD4 (A-B) or CD8 (C-D) in lymph nodes from infected (A and C) or uninfected (B and D) individuals. The results represent means of the data obtained with sets of 3 tissue blocks derived from 8 donors with HIV-1 and 5 patients without HIV-1. ▪ indicates the mean for central memory T cells; ⊡, the mean for naive T cells; and □, effector T cells. *P < .05 for the difference between chronic HIV-1–infected and uninfected control tissue as evaluated by nonparametric Mann-Whitney test. (A) CD4 T lymphocytes subpopulation in chronic HIV-1–infected lymph nodes. (B) CD8 T lymphocyte subpopulation in chronic HIV-1–infected lymph nodes. (C) CD4 T lymphocyte subpopulation in uninfected control lymph nodes. (D) CD8 T lymphocyte subpopulation in uninfected control lymph nodes.
Subpopulation of naive and memory CD4 and CD8 T cells in lymph nodes of patients with chronic HIV-1 and patients without HIV-1. Cells were phenotyped by flow cytometry at day 1 after surgery. Presented are the mean numbers of living T cells expressing CD4 (A-B) or CD8 (C-D) in lymph nodes from infected (A and C) or uninfected (B and D) individuals. The results represent means of the data obtained with sets of 3 tissue blocks derived from 8 donors with HIV-1 and 5 patients without HIV-1. ▪ indicates the mean for central memory T cells; ⊡, the mean for naive T cells; and □, effector T cells. *P < .05 for the difference between chronic HIV-1–infected and uninfected control tissue as evaluated by nonparametric Mann-Whitney test. (A) CD4 T lymphocytes subpopulation in chronic HIV-1–infected lymph nodes. (B) CD8 T lymphocyte subpopulation in chronic HIV-1–infected lymph nodes. (C) CD4 T lymphocyte subpopulation in uninfected control lymph nodes. (D) CD8 T lymphocyte subpopulation in uninfected control lymph nodes.
As among CD4+ T cells, the fraction of effector CD8+ T cells was significantly larger in nodes from donors with chronic HIV-1 infection (Figure 2B) than in nodes from donors without HIV-1 (Figure 2D): 73.3% ± 5% (n = 8) versus 57.8% ± 5.4% (n = 5) (P = .03). Likewise, the fraction of central memory CD8+ T lymphocytes was larger in uninfected control lymph nodes than in lymph nodes from donors with HIV-1: 18.8% ± 5.7% (n = 5) versus 5.3% ± 1.5% (n = 8) (P = .008). As among the CD4+ T lymphocytes, the fractions of naive CD8+ T cells in lymph nodes from donors with chronic HIV-1 infection and donors without HIV-1 were not significantly different: 21.3% ± 6% (n = 8) versus 23.4% ± 6.4% (n = 5) (P = .4). Thus, lymph nodes from patients with HIV-1 have a disproportional enrichment in both CD4+ and CD8+ T cells with an effector phenotype, and a diminution in the proportion of cells with a “central memory” phenotype.
Chronic HIV-1 infection is associated with increased CD38 expression in naive and memory lymph node T cells
Because immune activation has been proposed as driving determinant of T-cell loss and immune deficiency in HIV-1 infection, we evaluated the expression of the activation marker CD38 on different maturation subsets of lymph node T cells.
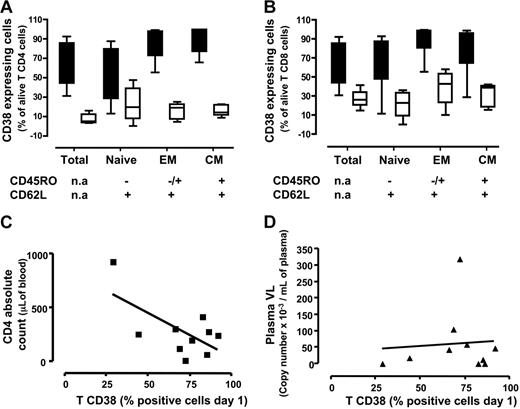
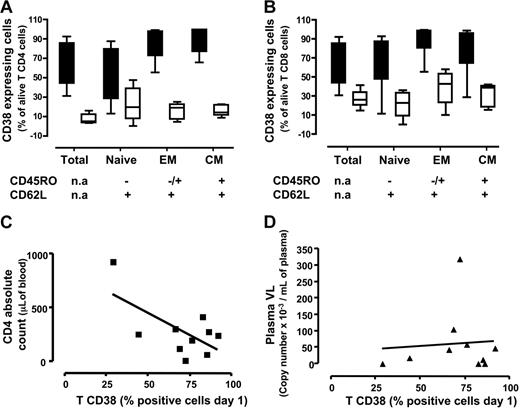
CD38 expression was more frequent among CD4+ T lymphocytes in chronically HIV-1–infected lymph nodes than in nodes from patients without HIV-1: 55.8% (range, 44%-85.7%) (n = 8) versus 9% (range, 3.9%-15%) (n = 5; P < .001) (Figure 3A). Higher frequencies of CD38 expression were seen in the HIV-1+ nodes than in HIV-1− nodes for each subset of CD4+ T cells examined: among effector cells these frequencies were 87.4% (range, 72.3%-97.6%) (n = 8) versus 18.7% (range, 6.8-22.7) (n = 5; P < .001), and among central memory cells, 91.4% (range, 76.6%-99.6%) (n = 8) were CD38+ in the HIV-1+ nodes versus 14% (range, 10.8%-21.8%) in HIV-1− nodes (n = 5; P < .001). Among naive cells, these frequencies were also higher in HIV-1–infected nodes than in infected patients: 46.1% (range, 27.8%-19.4%) (n = 8) versus 19.8% (7%-38.8%) (n = 5), but the latter difference did not reach statistical significance (P = .1).
Activation status memory/naive subtypes among CD4 and CD8 T cells in lymph nodes from patients with chronic HIV-1 and patients without HIV-1. Cells were stained for lineage markers, activation (CD38), and memory/naive markers expression on day 1 after surgery. (A-B) Medians (25th-75th percentile) for data obtained with sets of 3 tissue blocks derived from each of 8 patients with chronic HIV-1 and 5 patients without HIV-1. (A) Percentage of cells expressing CD38 among total, naive, effector memory, and central memory CD4 lymphocytes. (B) Percentage of cells expressing CD38 among total, naive, effector memory, and central memory CD8 lymphocytes. Fraction of total T cells expressing CD38 correlated to clinical data from patient CD4 cell count (C) and plasmatic viral load (D). (C) Correlation between the fraction of T cells expressing CD38 at day 1 and the number CD4 T cells. (D) Correlation between the fraction of T cells expressing CD38 at day 1 and the plasmatic viral load. Lines represent linear regressions.
Activation status memory/naive subtypes among CD4 and CD8 T cells in lymph nodes from patients with chronic HIV-1 and patients without HIV-1. Cells were stained for lineage markers, activation (CD38), and memory/naive markers expression on day 1 after surgery. (A-B) Medians (25th-75th percentile) for data obtained with sets of 3 tissue blocks derived from each of 8 patients with chronic HIV-1 and 5 patients without HIV-1. (A) Percentage of cells expressing CD38 among total, naive, effector memory, and central memory CD4 lymphocytes. (B) Percentage of cells expressing CD38 among total, naive, effector memory, and central memory CD8 lymphocytes. Fraction of total T cells expressing CD38 correlated to clinical data from patient CD4 cell count (C) and plasmatic viral load (D). (C) Correlation between the fraction of T cells expressing CD38 at day 1 and the number CD4 T cells. (D) Correlation between the fraction of T cells expressing CD38 at day 1 and the plasmatic viral load. Lines represent linear regressions.
Among CD8+ T cells, CD38 expression was also more common in the HIV-1–infected nodes than in the nodes of patients without HIV-1: 55.85% (range, 44%-85.7%) (n = 8) versus 26.2% (range, 19.7%-33.8%) (n = 5; P < .001) (Figure 3B). As observed among CD4+ T lymphocytes, CD8+ T-cell maturation subsets were more frequently expressing CD38 in the HIV-1–infected nodes than in the nodes of patients without HIV-1. Among effector cells, these frequencies were 92% (range, 80.6%-98.9%) (n = 8) versus 42.6% (range, 22.9%-53.4%) (n = 5; P < .003), and among central memory cells, they were 97.4% (range, 64.2%-96.3%) (n = 8) versus 39% (18.4%-41.1%) (n = 5; P < .01) in the HIV-1–infected and control nodes, respectively. Akin to naive CD4+ T cells, frequency of CD38 expression among naive CD8+ T cells was higher: 77.4% (range, 47.4%-87.3%) (n = 8) versus 22.5% (range, 8.8%-33.1%) (n = 5); in this population, however, the differences were statistically significant (P < .001).
To study further the relationship between immune activation in lymph nodes of patients with HIV-1 and clinical indices, we examined the relationship between T-cell CD38 expression and CD4 T-cell counts and plasma HIV-1 RNA levels. Importantly, we observed no correlation between the frequencies of CD38+ T cells and plasma HIV-1 RNA levels (R = 0.012, P < .8; n = 10) (Figure 3D). On the other hand, and as shown in Figure 3C, there was a strong negative correlation between the frequencies of CD38+ T cells and the absolute CD4 cell count (R = 0.63, P < .05; n = 10).
Thus, in the lymph nodes of patients with chronic HIV-1, all the studied subsets of both CD4+ and CD8+ T cells express the activation marker CD38 at frequencies exceeding those seen in lymph nodes from patients without HIV-1. Moreover, the proportion of phenotypically activated (CD38+) T cells in these nodes is inversely related to the circulating CD4+ T-cell count, but not to the plasma level of HIV-1.
Both MDCs and PDCs are depleted in the lymph nodes of patients with HIV-1
As professional antigen-presenting cells are central to the generation of immune responses, we enumerated these cells in lymphoid tissues using flow cytometry. We identified DCs by their lack of expression of the T-cell, B-cell, macrophage, and natural killer (NK) lineage markers CD3, CD19 CD20, CD14, CD16, and CD56 (Lin−) in conjunction with the expression of HLA-DR and CD11c for MDCs and HLA-DR and CD123 for PDCs.
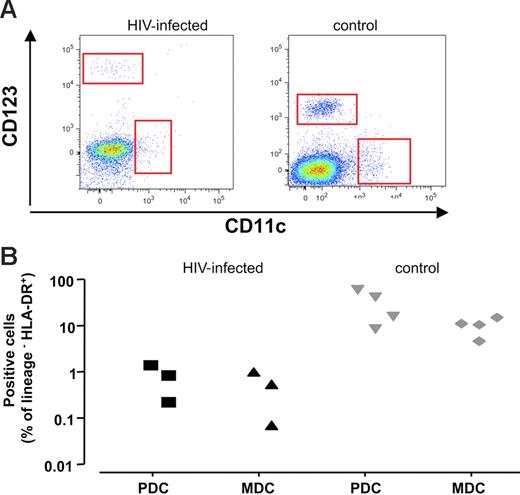
In a typical experiment, (Figure 4A) we observed fewer MDCs and PDCs in HIV-1–infected lymph nodes (left panel) compared with uninfected lymph nodes (right panel). MDCs constituted 0.46% ± 0.2% of Lin− HLA-DR+ cells in infected tissue (n = 3), while in uninfected tissues, these cells constituted 8.9% ± 1.8% of Lin− HLA-DR+ cells (n = 4; P < .02). Likewise, PDCs accounted for 0.73% ± 0.3% of Lin− HLA-DR+ (n = 3) cells in HIV-1–infected tissues and 27.1% ± 10.1% in uninfected control tissues (n = 4; P < .05). Also, this decrease was apparent when the fraction of DCs among all viable cells was estimated; in chronically HIV-1–infected tissue, PDCs accounted for 0.02% ± 0.01% of viable cells (n = 3), and in uninfected tissue, these cells constituted 0.71% ± 0.08% (n = 4; P = .05). MDCs accounted for 0.74% ± 0.13% in uninfected control tissue (n = 4), and represented 0.06% ± 0.02% in HIV-1–infected tissue (n = 3; P = .05).
PDCs and MDCs in lymph nodes from patients with chronic HIV-1 and patients without HIV-1. Phenotype of cells was characterized by flow cytometry after staining with specific antibodies against surface markers. DCs are defined as viable Lin− HLA-DR+ cells expressing particular surface markers CD123 for PDCs and CD11c for MDCs. (A) Flow cytometry of PDCs and MDCs in lymph nodes. Dot-plot of cells lymph nodes from representative patients with chronic HIV-1 (left panel) and patients without HIV-1 (right panel). (B) Number of PDCs and MDCs in lymph nodes in 3 different donors. Presented are values of the cell numbers expressed as percentages of Lin− HLA-DR+ cells for sets of 3 tissue blocks derived from each of 3 patients with chronic HIV-1 and 4 patients without HIV-1.
PDCs and MDCs in lymph nodes from patients with chronic HIV-1 and patients without HIV-1. Phenotype of cells was characterized by flow cytometry after staining with specific antibodies against surface markers. DCs are defined as viable Lin− HLA-DR+ cells expressing particular surface markers CD123 for PDCs and CD11c for MDCs. (A) Flow cytometry of PDCs and MDCs in lymph nodes. Dot-plot of cells lymph nodes from representative patients with chronic HIV-1 (left panel) and patients without HIV-1 (right panel). (B) Number of PDCs and MDCs in lymph nodes in 3 different donors. Presented are values of the cell numbers expressed as percentages of Lin− HLA-DR+ cells for sets of 3 tissue blocks derived from each of 3 patients with chronic HIV-1 and 4 patients without HIV-1.
Thus, in the lymph nodes of patients with chronic HIV-1 infection, we observed a dramatic decrease in the proportions of both PDCs and MDCs compared with those seen in normal nodes.
Chronic HIV-1 infection alters the cytokine environment in lymph nodes
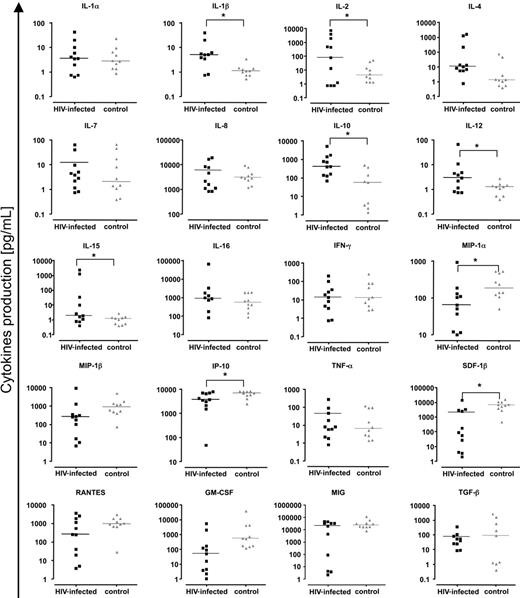
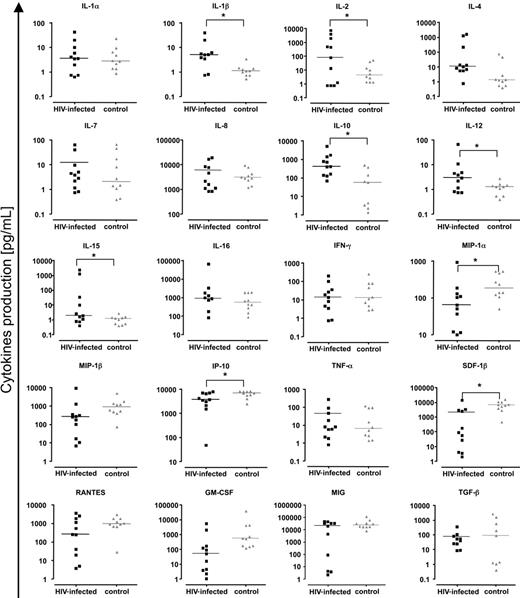
Because we found a heightened accumulation of effector T cells in the lymph nodes of patients with HIV-1 and a high immune activation level in all T-cell populations, we examined the spontaneous expression of cytokines in these tissues to explore the potential mediators of immune activation. Concentrations of 20 cytokines—IL-1α, IL-1β, IL-2, IL-4, IL-7, IL-8, IL-10, IL-12, IL-15, IL-16, MIP-1α (CCL3), MIP-1β (CCL4), IFN-γ, RANTES (CCL5), IP-10 (CXCL10), GM-CSF, MIG (CXCL9), TNF-α, TGF-β, and SDF-1β (CXCL12)—released into the lymph node culture medium after 15 days, were determined using a multiplex bead-based assay (Luminex). Figure 5 shows the cytokine concentrations expressed by cultured lymph nodes obtained from each of 10 patients with HIV-1 and from 10 patients without HIV-1. For HIV-1+ lymph nodes we found increased levels of the following cytokines: IL-1β (P = .019), IL-2 (P = .05), IL-10 (P = .02), IL-12 (P = .019), and IL-15 (P = .05). In contrast, concentrations of MIP-1α (P = .02), SDF-1β (P = .002), and IP-10 (P = .05) were diminished in HIV-1+ lymph nodes compared with levels in the control nodes. Thus there was a profound perturbation in the levels of cytokines released by cultured lymphoid tissues from patients with HIV-1. We found no significant correlation between levels of any of these abnormally expressed cytokines and the expression of CD38 on total T-cell populations or on central memory or effector T cells. In a broader search, when all cytokine levels were correlated with activation markers, IFN-γ levels were significantly related to the expression of CD38 on CD8+ effector T cells (R = 0.34, P = 0.03).
Chemokines and cytokines in lymph nodes of patients with chronic HIV-1 and patients without HIV-1. Presented are concentrations of chemokines/cytokines released by uninfected and HIV-1–infected lymph nodes (6 or fewer blocks number 27 or less in 3 mL of medium) over 15 days in culture. Black symbols indicate chronic HIV-1–infected lymph nodes; gray symbols, normal lymph nodes. For HIV-1–infected lymph nodes, each square represents data from 1 of 10 donors. For uninfected lymph nodes, each triangle represents data from 1 of 10 donors. Line denotes median of the concentrations for each cytokine. *Statistical significance for a nonparametric Mann-Whitney test performed on the median of concentrations (P < .05).
Chemokines and cytokines in lymph nodes of patients with chronic HIV-1 and patients without HIV-1. Presented are concentrations of chemokines/cytokines released by uninfected and HIV-1–infected lymph nodes (6 or fewer blocks number 27 or less in 3 mL of medium) over 15 days in culture. Black symbols indicate chronic HIV-1–infected lymph nodes; gray symbols, normal lymph nodes. For HIV-1–infected lymph nodes, each square represents data from 1 of 10 donors. For uninfected lymph nodes, each triangle represents data from 1 of 10 donors. Line denotes median of the concentrations for each cytokine. *Statistical significance for a nonparametric Mann-Whitney test performed on the median of concentrations (P < .05).
Discussion
The pathogenesis of immune dysfunction and immune cell losses in chronic HIV-1 infection is not well understood. Critical events are thought to occur in lymphoid tissue during HIV-1 infection.10–12 For this reason, we decided to compare phenotypes of selected immune cell populations and the expression of selected cytokines in lymphoid tissues of patients with chronic HIV-1 infection and of patients without HIV-1.
We placed freshly excised dissected lymph nodes in an ex vivo system8 that maintains them for at least 2 weeks under conditions that retain both cytoarchitecture8 and cell-surface phenotypes—at least in normal nodes.13 This approach allowed us to examine both the distribution of lymphocyte phenotypes in these tissues and the cytokine expression that is the direct or indirect result of sustained HIV-1 replication.
In the present study, we analyzed lymph nodes obtained surgically from 11 patients with chronic HIV-1 infection and lymph nodes from 11 patients without HIV-1. Not surprisingly, we found that in chronic HIV-1 infection there is a profound relative depletion of CD4+ T cells in lymph nodes with a resultant dramatic decrease in the CD4/CD8 ratio, consistent with a number of earlier reports.14,15 We also found that the HIV-1–infected nodes were characterized by a profound (20- to 40-fold) depletion of both PDCs and MDCs. A more modest depletion of these cells from circulation has been reported earlier.16–18 The more dramatic exclusion or depletion of these cells from lymphoid tissues likely has profound consequences for the generation of adaptive immune responses in patients with chronic HIV-1 infection. The degree to which these perturbances induced by HIV-1 can coexist with relative protection from major opportunistic infections and the degree to which these perturbations promote systemic immune deficiencies in chronic HIV-1 infection remain to be defined.
It is well recognized that T-cell depletion during the course of HIV-1 infection is not restricted to infected cells;19–24 diminished thymic function,25–27 peripheral naive T-cell expansion failure,28 and distorted lymphoid architecture,29 as well as heightened cellular turnover4,30–32 have been implicated as underlying these depletions. In the current studies we examined cellular activation in lymphoid tissue, as heightened activation has been implicated as an underlying mediator of T-cell depletion in HIV-1 infection.6,33–35 In this regard, high levels of bystander apoptotic cell death have been found in lymphoid tissues of patients with chronic HIV-1 and macaques with SIV,24,36 and a similar phenomenon has been reported for the circulating blood cells as well.37–39
For an activation marker, we chose to examine CD38 since T-cell expression of this antigen is induced by a variety of activation stimuli, including T-cell receptor engagement,40,41 cytokine stimulation,42 and exposure to toll-like receptor ligands (M.M.L. et al, unpublished data, November 2006). Moreover, expression of CD38 on peripheral blood cells has been found to be a strong correlate of HIV-1 disease progression risk,43,44 and in some studies was more predictive than plasma levels of HIV-1.43,45 Increased activation was observed in each of the 3 defined CD4+ and CD8+ T-cell maturation subsets: naive, central memory, and effector cells. While it should be noted that resting naive T cells also may express CD38,46,47 the dramatic increase in naive T cells expressing this marker in HIV-1–infected lymph nodes suggests that this population is likely activated as well. We propose that dysregulated activation underlies the profound expansion failure of circulating naive T cells in HIV-1 infection.28 How immune activation promotes naive T-cell expansion failure remains to be determined. As we show here that these cells have evidence of in situ activation, we propose that this may underlie the functional impairment that we have observed ex vivo.
We draw several conclusions from these observations. First, these data indicate that immune activation, as reflected by expression of CD38 in these nodes, is profound even in persons with well-controlled HIV-1 replication. Second, the magnitude of this activation and its reflection in both CD4+ and CD8+ T cells provides further evidence that immune activation in this setting is not a reflection of HIV-1–specific immune responses, as the frequencies of activated cells we observed here far exceed the plausible frequency of HIV-1–reactive T cells.48 Finally, we propose that these activation events are not a consequence of T-cell–receptor engagement, since not only are memory and effector cells affected, but there is also apparent activation of naive T cells in which the distribution of T-cell–receptor specificities is far too broad to be realistically activated by each cognate peptide these cells recognize. Thus, these observations suggest that T-cell activation in the lymph nodes of patients with HIV-1 is a bystander consequence of exposure to cytokines or other broad activating signals. In this regard, it will be important to evaluate the relationships among HIV-1 replication and other potential drivers of immune activation in chronic HIV-1 infection, such as translocated microbial products on activation markers such as CD38 and Ki-67, and the frequencies of circulating central memory T cells in S phase of the cell cycle.28,49
Plasma levels of HIV-1 RNA were not related to the immune activation as reflected by CD38 expression, nor were levels of HIV-1 expressed in the lymph node tissues related to CD38 expression. These data suggest that immune activation in lymphoid tissue is also not a consequence of HIV-1 antigenic load or other factors related to HIV-1 replication directly. If these findings are confirmed by other studies, the implication is that neither the amount of virus nor the concentration of viral products such as tat, nef, or vpr50–52 that have been proposed to be important in pathogenesis of HIV-1–related immune deficiency are likely underlying determinants of immune activation in the HIV-1–infected lymph node.
Even with the small numbers of experiments shown here, what does seem to correlate with immune activation in lymphoid tissue is the number of circulating CD4+ T cells. On the one hand, this could represent a homeostatic response to cellular depletion. Alternatively, other factors that could drive bystander T-cell activation include inflammatory cytokines or combinations of cytokines expressed by an overrepresented effector T-cell population in infected lymph nodes or microbial products either translocated from the HIV-1–damaged gut53 or coming from activation of latent microbial infections.
To evaluate the cytokine environment in these HIV-1 lymph nodes, we analyzed a panel of cytokines that were released by these nodes in conditions that preserved the architecture and intercellular relationships of the tissue. In these conditions, we have demonstrated profound perturbations in the levels of cytokines expressed into the culture medium. Most dramatic were increases in the levels of IL-2, IL-10, IL-1β, and so forth in the HIV-1+ nodes. As an example, the median levels of IL-2 released by in the HIV-1+ nodes exceeded by more than 10-fold the median levels of this cytokine released by control nodes; in some infected nodes, these levels exceeded the highest levels in uninfected nodes by 100-fold or more. While median levels of IL-15 were similar in the infected and control nodes, IL-15 levels in 3 infected nodes exceeded the highest levels in normal nodes by 10- to 1000-fold. Several cytokines were found in substantially diminished levels in the infected nodes. Each of the 3 beta chemokines were found in lower levels in the HIV-1–infected nodes, but this difference was significant only for MIP-1α. Likewise, levels of the CXCR4 ligand SDF-1β were diminished in the HIV-1–infected nodes.
In this small study, we were unable to demonstrate either a relationship between the abnormal levels of these cytokines in culture medium and the proportions of cells expressing CD38 in these nodes or to link activation level to HIV-1 replication in lymph nodes. While this might represent a truly negative result, a relationship may not be revealed due to the insufficient number of samples for this analysis. Also, for cytokines, it is possible that the apparent levels, as measured, are consequences of a combination of both their expression and their absorption and the ex vivo conditions of culture. Additional studies in larger populations and using methods that may quantitate more consistently expression levels in vivo54 may help to clarify these relationships if they exist. Alternatively, factors or cytokines other than those we have measured, or complex interactions among these factors, may be driving activation in this setting.
Extrapolating our data to the situation in vivo we propose that deterioration of the lymph node structure and function in the course of chronic HIV-1 infection is a complicated phenomenon that includes the death of infected cells and activation of other cells, both infected and uninfected. In this setting, activated effector cells are excessively attracted or retained in these infected nodes. These activated cells are likely to be the source of elevated cytokines that in turn may activate new cells. This vicious circle of activation and cytokine dysregulation leads to a massive activation of lymphoid tissue. As is the case in other instances of immune activation, the activated cells are primed for apoptosis, and this, accordingly, results in a massive cell death. This death phenomenon is not restricted to T cells but also may include DCs, as these cells are dramatically depleted from the chronically infected lymph node, and this depletion may be especially contributory to the demonstrable impairment in both innate and adaptive immune defenses in chronic HIV-1 infection.19,55,56 A better understanding of the mechanisms by which chronic HIV-1 infection induces immune activation that results in CD4+ T-cell depletion may provide a new insight into HIV-1 pathogenesis and reveal new targets for immune-based interventions to slow HIV-1 disease progression.
Authorship
Contribution: A.B., S.J.I., A.L., C.V., and K.G. performed research; A.B., J.C.G., B.R., S.F.S., L.B.M., and M.M.L. designed the research and analyzed data; A.B., J.C.G., B.R., L.B.M., and M.M.L. wrote the paper; and R.D. contributed vital new reagents.
Conflict-of-interest disclosure: The authors declare no competing financial interests.
Correspondence: Leonid B. Margolis, Laboratory of Cellular and Molecular Biology, Bldg 10, Rm 9D58, National Institute of Child Health and Human Development, National Institutes of Health, Bethesda, MD 20892; e-mail: margolis@helix.nih.gov.
An Inside Blood analysis of this article appears at the front of this issue.
The publication costs of this article were defrayed in part by page charge payment. Therefore, and solely to indicate this fact, this article is hereby marked “advertisement” in accordance with 18 USC section 1734.
Acknowledgments
We are thankful to all members of the Cleveland Immunopathogenesis Consortium (the Bad Boys of Cleveland) for helping to establish a general framework for our studies of HIV-1 pathogenesis.
This work was supported in part by the Intramural Research Program of the National Institutes of Health (NIH), National Institute of Child Health and Human Development, and by award AI 36219 from the center for AIDS research at the National Institute of Allergy and Infectious Diseases (NIAID).

