Abstract
Human blood contains 2 populations of dendritic cells (DCs): plasmacytoid and myeloid (mDC). mDCs are subdivided into 3 subsets using the surface markers CD16, CD1c, and BDCA-3. Their role as pathogen sentinels and adjuvant targets was tested by phenotypic and functional analysis. We show that mDC subsets are immature and express mRNA for most toll-like receptors (TLRs), except for TLR3 in CD16-mDCs. The most represented subsets, CD16- and CD1c-mDCs, are similarly responsive to all TLR agonists. Among 31 cytokines tested, both subsets produce CXCL8 (IL-8)/tumor necrosis factor-α (TNF-α)/IL-6/CCL3 (MIP-1α)/CCL4 (MIP-1β)/IL-1β. CXCL8 (IL-8) is the predominant cytokine produced by CD1c-mDCs on TLR engagement, whereas all other cytokines, particularly TNF-α, are secreted in 10-fold to 100-fold higher amounts by CD16-mDCs. CD16-mDCs cocultured with human umbilical vein endothelial cells induce a significantly higher production of CXCL10 (IP-10), granulocyte-macrophage colony-stimulating factor, and granulocyte colony-stimulating factor than CD1c-mDCs. In addition, interleukin-3 and type I interferons are stimuli specifically for DC maturation rather than cytokine secretion, whereas TNF-α is almost ineffective in inducing either function, suggesting a mechanism of T-cell–DC crosstalk and of rapid induction of antigen-presenting cell function during viral infection rather than inflammation. In conclusion, CD16-mDCs show strong proinflammatory activity, whereas CD1c-mDCs appear to be mainly inducers of chemotaxis.
Introduction
Dendritic cells (DCs) play a central role in immune responses. In peripheral tissues, DCs are activated by pathogen recognition and subsequently acquire the ability to engulf antigens and microorganisms.1 During activation or maturation, DCs secrete cytokines with a variety of roles in the immune response. Mature DCs migrate into lymphoid organs, up-regulate costimulatory molecules, present the processed antigens on major histocompatibility complex molecules, and thus can activate T cells through the combined engagement of T cell receptors and CD28.1,2
DCs can be divided into a variety of subtypes with different localizations and specialized functions in immune responses.2–5 In humans, different DCs can be generated in vitro from CD34+ precursor cells from bone marrow, cord blood, and adult blood, or from blood monocytes.3 In the blood of healthy donors, 2 main populations of circulating DCs, termed myeloid (mDCs) and plasmacytoid DCs (pDCs), were identified. Phenotypically, these DC subsets are characterized by the absence of lineage marker expression (CD3, CD14, CD19, CD56), high expression of the HLA-DR molecule, and specific expression of CD11c on mDCs, BDCA-2, and BDCA-4 on pDCs.6,7 The 2 DC populations are similarly efficient antigen-presenting cells (APCs),7,8 but pDCs produce high amounts of type I interferons (IFNs) in response to microbial stimuli and are activated by CpGs and not by lipopolysaccharide (LPS), whereas mDCs are activated by LPS and not by CpGs and do not produce type I IFNs on microbial stimulation.7,9 It was subsequently proposed that 5 different DC subsets circulate in human blood, which are characterized by the specific expression of the antigens CD1c(BDCA-1), CD16, BDCA-3, CD123, and CD34,10 in which the CD123+ DCs represent the pDC population. This study highlighted that the 5 DC subsets have a differential ability to activate allogenic T cells. Another study confirmed the presence in the blood of these 5 DC subtypes and, analyzing the expression profile of the nonactivated DC populations separated ex vivo, suggested that BDCA-1+ and BDCA-3+ DCs are similar, whereas CD16+ and CD123+ DCs clustered as a distinct population of cells.11 In addition, they showed similar results in tonsil cells, with the exception of CD16+ DCs, which were found only in peripheral blood. This last DC subset may be the DC population previously identified as a potent effector in antibody-dependent cellular cytotoxicity.12,13
DCs interact with pathogens through specialized receptors termed pattern recognition receptors (PRRs), which recognize characteristic pathogen-specific molecular patterns14,15 and thus discriminate self from nonself. The most studied PRRs are the toll-like receptors (TLRs), a family of molecules expressed on the cell surface and in endosomes that are able to recognize typical pathogen molecules such as LPS of the bacterial cell wall, peptidoglycan of Gram-negative bacteria, flagellin of bacterial flagella, zymosan of yeast, single- or double-strand RNA of viruses, or viral and bacterial DNA CpG motifs.14,15 Up to 10 different TLRs were identified in humans.14,15 The principal agonists known are Pam or MALP-2 for TLR2 alone or in combination with TLR1 and TLR6, PolyI:C for TLR3, LPS for TLR4, flagellin for TLR5, R848 for TLR7/8, Imiquimod for TLR7, PolyU and single-strand RNA for TLR7/TLR8, and CpGs for TLR9.14–19 No agonist has been identified for TLR10. Blood pDC functions and mDC APC potential were extensively investigated with consistent data.7,8,10,20–22 No data exist regarding the response of mDC subsets to microbial stimuli. Because the response to TLR agonists is key for the role of mDCs, both as pathogen sentinels and as targets for vaccine adjuvants, we decided to characterize extensively the phenotype of blood DCs and to evaluate the production of a large panel of cytokines by the 2 major mDC subtypes induced by the principal TLR agonists known. In addition, we analyzed the response of these mDC subsets to interleukin-3 (IL-3), tumor necrosis factor-α (TNF-α), and type I IFNs, 3 fundamental cytokines for immune responses and DC biology.
Materials and methods
Antibodies used for flow cytometry
CD3, CD14, CD19, CD56-PE-Cy5, CD34-FITC/-ECD, CD207-PE, streptavidin-PE-Cy7 (Beckman Coulter, Fullerton, CA); HLA-DR-APC/-APC-Cy-7, CD11c-APC/-PE, CD16-PE-Cy-7/-PE/-FITC, CD34, CD2, CD11b, CD13, CD80, TNF-α, CD21, CD1a, CD11a, CD50, CD54, CD58, CD85j, CD89, CD95, CD178, CD206, CD209, CDw137L, CD40, CD83, CD86, CD123, TNFRII-PE, CD40/CD80/TNF-α/IL-8-FITC, TNFRI-bio (Pharmingen-Becton Dickinson, San Jose, CA); CD1c-PE/-FITC, BDCA-3-APC/-PE, BDCA-2-bio/-PE (Miltenyi Biotec, Bergisch Gladbach, Germany); CCR1 through CCR9 and CXCR1 through CXCR6-PE (RandD Systems, Minneapolis, MN); CD1b-PE (Ancell, Bayport, MN); Streptavidin-Pacific Blue (Molecular Probes-Invitrogen, Carlsbad, CA); and Streptavidin-PE (Southern Biotech, Birmingham, AL).
Donors
Buffy coats from healthy HIV-, hepatitis B virus- and hepatitis C virus-negative donors were obtained from the Blood Transfusion Section, Alta Val D'Elsa Hospital, Poggibonsi. Informed consent was obtained before all blood donations. The study protocol was approved by the institute's ethical committee and conforms to the ethical guidelines of the 1975 Declaration of Helsinki. Bone marrow samples were obtained from donors for allogenic stem cell transplantation courtesy of the Pediatric Hematology Unit of IRCCS Policlinico San Matteo, Pavia. The study protocol was approved by the internal review board and patients' parents or donors gave written informed consent. After having obtained informed consent from the mothers, umbilical cord samples were provided courtesy of the Pediatrics, Obstetrics, and Reproduction Medicine Department, Università degli Studi, Siena.
Flow cytometric analysis
For surface stainings, cells were incubated with appropriate antibody mixes for 15 min at 4°C. For fluorescent-activated cell sorter (FACS) analysis of cytokine production, cells were cultured with different stimuli as described in the Cell cultures section of Materials and methods and Brefeldin A was added 30 minutes after beginning the induction. Stimulated cells were washed, fixed using 2% formaldehyde solution in phosphate-buffered saline (PBS) for 15 minutes at 4°C, and permeabilized using 200 μL of PBS, 1% BSA, 0.5% saponin solution for 20 minutes at room temperature. Permeabilized cells were washed and stained with anti-TNF-α and anti-IL-8 antibodies as described. Stained cells were washed and analyzed using LSRII or FACSCanto flow cytometers and DIVA software (Becton Dickinson).
Cell preparation
Peripheral blood mononuclear cells (PBMCs) and bone marrow mononuclear cells were obtained from buffy coats and fresh bone marrow samples, respectively, by Ficoll Hypaque (Amersham Biosciences, Uppsala, Sweden) density gradient centrifugation. Fresh purified PBMCs were stained with antilineage (CD3/CD14/CD19/CD56), anti-CD11c/-CD16/-CD1c/-BDCA-3 antibodies for 15 minutes at 4°C in dark condition at cell concentration of 108 cells/mL with shaking. Cells were then washed, resuspended in 3 mL of PBS, filtered through a 30 μM filter (Becton Dickinson), and sorted using a FACSAria cell sorter (Becton Dickinson) in high-speed/purity mode. The subpopulations of mDCs were gated as lineage-negative, CD11c bright, and CD16, CD1c, or BDCA-3-positive, respectively. The subsets obtained were ≥99% pure (data not shown). Highly purified monocytes (>98%) were obtained from PBMCs by MACS (Miltenyi Biotec) using a one-step positive selection with anti-CD14-coated magnetic microbeads according to the manufacturer's instructions.
Human umbilical vein endothelial cells (HUVECs) were isolated from umbilical cord veins and cultured on gelatin-coated dishes (culture plates).23 Cells were grown to confluence in M199 medium (Invitrogen-Life Technologies, Carlsbad, CA) containing 20% FCS (Sigma-Aldrich, St. Louis, MO), 0.1 mg/ml bovine brain extracts, 10 U/mL heparin (Pfizer, La Jolla, CA), and antibiotics. HUVECs were used for experiments at passage 2 or 3.
Cell cultures
Immature Mo-DCs were obtained by culturing monocytes for 5 to 6 days in RPMI-1640 (Invitrogen-Life Technologies) supplemented with 10% Fetal Calf Serum (Hyclone, Logan, UT) and 1% penicillin-streptomycin-glutamine solution (Invitrogen-Life Technologies) (complete RPMI medium), with IL-4 (10% of supernatant from IL-4 secreting cell line, provided by A. Lanzavecchia, Institute for Research in Biomedicine, Bellinzona, Switzerland) and 50 ng/mL of granulocyte-macrophage colony-stimulating factor (GM-CSF) (Gentaur, Brussels, Belgium).
Total mDCs or CD16 and CD1c-mDC subsets were cultured overnight or for 40 hours in 100 μL complete medium alone or with stimuli. The concentration of the stimuli was titrated using total mDCs, and the best concentration to stimulate mDCs was used to induce mDC subsets. The working concentrations of the stimuli used are the following: Pam 1 μg/mL, PolyI:C 10 μg/mL, LPS 1 μg/mL, flagellin 1 μg/mL, R848 5 μM, imiquimod 20 μM, PolyU 1 μg/mL, CpG 2216 10 μg/mL, TNF-α 1 μg/mL, IL-3 100 ng/mL, and type I IFNs 105 U/mL.
HUVECs were washed with PBS and cultured overnight in complete RPMI medium alone or with LPS, TNF-α, or a combination of the 2 stimuli or in the presence of LPS-stimulated DC subsets. Both TNF-α and LPS were titrated accordingly from 1000 ng/mL down to 10 ng/mL. Neutralizing antibodies for TNF-α (Pharmingen-Becton Dickinson) and for IFN-γ were used at 50 μg/mL.
Real-time polymerase chain reaction
Total RNA was extracted from purified mDC subsets using TRIzol® reagent (Invitrogen-Life Technologies) according to the manufacturer's instructions. Yeast tRNA (Becton Dickinson) was added as a carrier during precipitation to improve the RNA yields. Because the primer pairs for TLR6, TLR9, and TLR10 were designed on the same exon, total RNA was cleaned from DNA using Deoxyribonuclease I Amplification Grade (Invitrogen-Life Technologies). The cDNA was synthesized from purified RNA using ThermoScript RT-PCR System (Invitrogen-Life Technologies) and used as template in the real-time polymerase chain reaction (PCR). The PCR mixture of 25 μL for each sample was prepared using the iQ SYBR® Green Supermix (Bio-Rad, Hercules, CA), to which were added 1.2 μL reference dye, Brilliant SYBR Green QPCR Master Mix (Stratagene, La Jolla, CA), 1 μL of cDNA template, and the primer pairs for TLR genes or glyceraldehyde phosphate dehydrogenase (GAPDH), a housekeeping gene used as a control reference, at a final concentration of 200 nM/primer. Samples were prepared in triplicate and run in a Chromo-4 machine (Bio-Rad) using appropriate 96-well plates. Sample mixtures underwent the following reaction protocol: initial denaturation at 95°C for 3 minutes, followed by 60 cycles of 95°C for 15 seconds and 60°C for 30 seconds. As controls, samples without cDNA and derived from RNA not treated with reverse transcriptase or with DNase I were used. After PCR, the melting curve for each product was determined. Finally, the correct size of the PCR products was checked by agarose gel electrophoresis.
The statistical analysis of results was done calculating the geometric mean of the obtained ΔCT (TLR expression measured relative to that of the housekeeping gene GAPDH), and the relative standard deviation was calculated as follows: , where σmax is the standard deviation of the most variable sample and n is the number of samples assessed.
Primers
The primers used for real-time PCR in this study are listed in Table 1The expected lengths of the PCR product for each primer set are reported. The primer pair for TLR4 detects the 4 different TLR4 isoforms naturally generated by differential splicing. The efficiency of each primer pair, calculated using serial dilutions of titrated cDNA obtained from total PBMCs, was approximately 100%.
Multicytokine array technology system
Culture supernatants were analyzed using a Bio-Plex array reader (Bio-Rad) and multicytokine array kits from Upstate (Millipore, Billerica, MA), Biosource (Invitrogen) or Bio-Rad according to the manufacturer's instructions. Briefly, differentially stained microbeads, each type of which is coated with antibodies recognizing different cytokines, were incubated with culture supernatants, washed, and incubated with biotinylated detection antibodies. Then the beads with the sandwich between antibodies and cytokines were washed, incubated with streptavidin-PE, washed again, and read in the Bio-Rad array reader.
Results
Phenotypic characterization of human blood mDC subsets
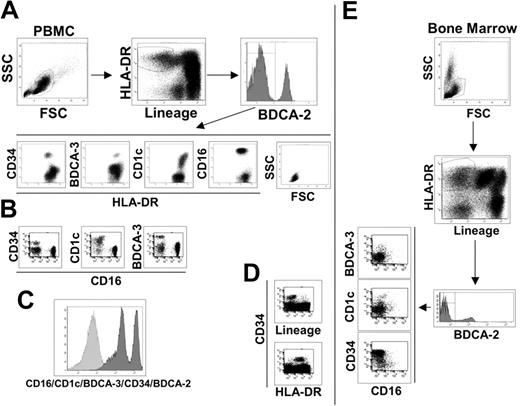
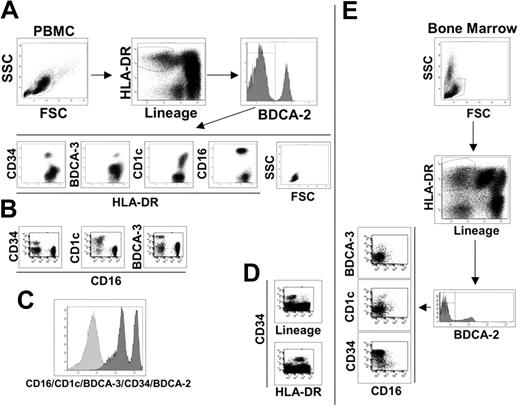
To identify peripheral blood mDCs, we stained human PBMCs as described (“Materials and methods”) and used the following gate sequence: within live cells, we gated on lineage negative/HLA-DR-positive cells (Lin-/HLA-DR+), and pDCs were excluded based on their BDCA-2 expression as indicated in Figure 1A. The BDCA-2 negative cells can be considered putative myeloid DCs, which have typical lymphocyte morphology and can be divided into 4 subsetscharacterized by the specific expression of the surface markers, CD34, BDCA-3, CD1c, and CD16 (Figure 1A). Each molecule identifies a single population of cells as observed by their staining combinations. As an example, we report here the dot plots of CD16 versus CD34, CD1c, and BDCA-3, which show the absence of double-positive cells (Figure 1B). The major mDC subset is the CD16+ population (65% to 75%), whereas CD1c+ cells represent approximately 10% to 20%, BDCA-3+ cells 3% to 5% and CD34+ cells 10% (data not shown). There is no other cell population inside the Lin-/HLA-DR+ PBMCs, as demonstrated by the histogram in Figure 1C, showing the staining of Lin-/HLA-DR+ cells with a mixture of antibodies for CD16/CD1c/BDCA-3/CD34/BDCA-2.
Phenotypic dissection of peripheral-blood DCs. (A) Sequential analysis to identify blood DC populations as indicated by the arrows. Live PBMCs were gated on lineage negative/HLA-DR+ cells and divided into BDCA-2 positive (pDCs) and negative populations. BDCA-2 negative were further divided into 4 subsets characterized by CD34, BDCA-3, CD1c, and CD16 surface expression. SSC and FSC highlight the typical lymphomonocytic morphology of these cells. (B) Each of the 4 surface antigens identifies a single, nonoverlapping population of cells as exemplified by the dot plots of CD16 versus CD34, CD1c, and BDCA-3 reported here. (C) Histogram of the lineage-negative/HLA-DR+ cell population stained with a mixture of antibodies against the indicated cell subset markers. (D) All CD34+ cells are lineage-negative/HLA-DR+ as shown in these fluorescent dot plots. Data reported in A, B, C, and D are representative of one donor out of 10. (E) The same sequential analysis of bone marrow cells as shown in A and B for PBMCs. Representative data from one donor out of 10.
Phenotypic dissection of peripheral-blood DCs. (A) Sequential analysis to identify blood DC populations as indicated by the arrows. Live PBMCs were gated on lineage negative/HLA-DR+ cells and divided into BDCA-2 positive (pDCs) and negative populations. BDCA-2 negative were further divided into 4 subsets characterized by CD34, BDCA-3, CD1c, and CD16 surface expression. SSC and FSC highlight the typical lymphomonocytic morphology of these cells. (B) Each of the 4 surface antigens identifies a single, nonoverlapping population of cells as exemplified by the dot plots of CD16 versus CD34, CD1c, and BDCA-3 reported here. (C) Histogram of the lineage-negative/HLA-DR+ cell population stained with a mixture of antibodies against the indicated cell subset markers. (D) All CD34+ cells are lineage-negative/HLA-DR+ as shown in these fluorescent dot plots. Data reported in A, B, C, and D are representative of one donor out of 10. (E) The same sequential analysis of bone marrow cells as shown in A and B for PBMCs. Representative data from one donor out of 10.
It was previously established that the CD34 surface marker characterized circulating progenitor cells.24 In human PBMCs, we found that all CD34+ cells are Lin-/HLA-DR+ (Figure 1D) and that the CD34+ cell population does not express CD11c and CD86, which are typical markers of mDCs (Table 2)Therefore, we conclude that the absence of lineage markers and the expression of class II molecules, at least in the case of the CD34+ cell population, are not sufficient criteria for the identification of peripheral blood cells as DCs. This conclusion is supported by the analysis of bone marrow, the primary source of progenitor cells, in which the Lin-/HLA-DR+ population is strongly enriched in CD34+ cells (Figure 1E). However, even if CD34+ cells cannot be considered a DC population, it is likely that this subset contained DC progenitors. In fact, CD34+ blood precursors are used to generate a variety of cell types, in vitro, including different DC populations. In contrast, CD16, CD1c, and BDCA-3-positive cell populations expressed the typical surface markers of mDCs, CD11c, and CD86, and thus can be considered mDCs subsets (Table 2). The myeloid origin of these 3 DC populations is highlighted by the expression of the CD13 myeloid marker that was not present in pDCs and CD34+ progenitor cells (Table 2). As revealed by the extensive analysis of surface molecules listed in Table 2, the mDC subsets were negative for the DC activation markers CD40, CD80, and CD83, indicating the immature status of these cells. This finding is reinforced by the absence of expression of the costimulatory molecule 4-1BBL and of DC-SIGN, which promote DC-T cell interaction and DC migration.25–27 As expected, the mDC subsets expressed the principal adhesion molecules and integrins but lacked expression of the Fc receptor for IgA1 and IgA2 and of langerin, the specific markers for Langerhans cells. Very interesting is the absence of mannose receptor expression, which is one of the most important scavenger receptors. Surprisingly, the mDC subsets did not express FasL, whereas they showed Fas expression. Regarding cultured DCs, blood mDC subsets were negative for CD1a, one of the nonclassic antigen-presenting molecules that is also considered a specific marker for Mo-DCs. This observation confirms the phenotypical difference between in vitro generated DCs and ex vivo DCs, as indicated also by our experiments that showed how Mo-DCs cannot be divided into the same subsets (data not shown). However, the mDC subtypes are positive for CD1b expression, another key molecule of the CD1 family.
Finally, the chemokine receptor profile of the 3 mDC subsets did not suggest any significant migratory differences among the cell subtypes (data not shown).
TLR expression profile and response to their agonists
Blood mDCs are well studied as APCs. Myeloid DCs and pDCs are very similar in their antigen presentation ability. In addition, the allogenic T cell induction capacity of the blood mDC subsets was previously addressed. Therefore, we focused our study on the responses of the mDC subsets to microbial stimuli. TLRs are the most important and studied PRRs and we decided to compare the TLR expression profile of the mDC subsets with their response to the known TLR agonists.
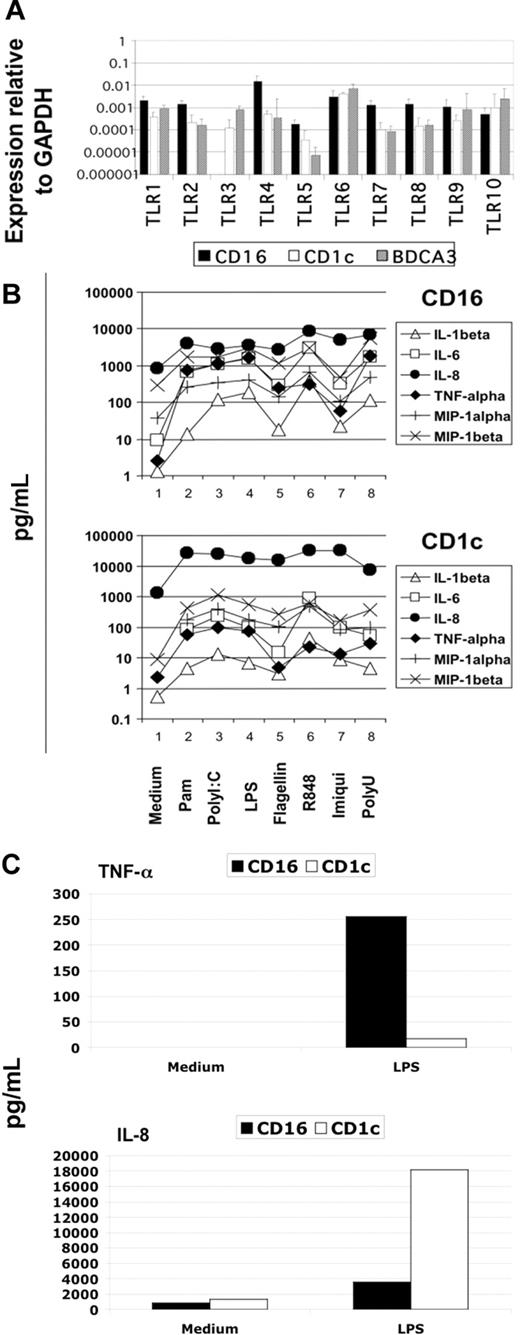
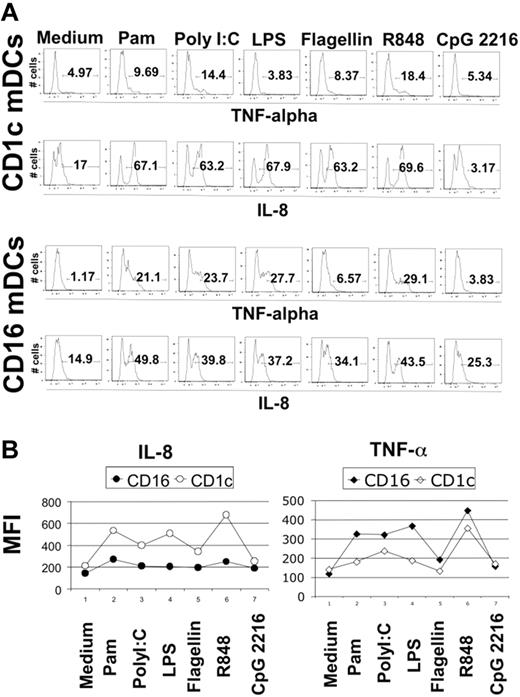
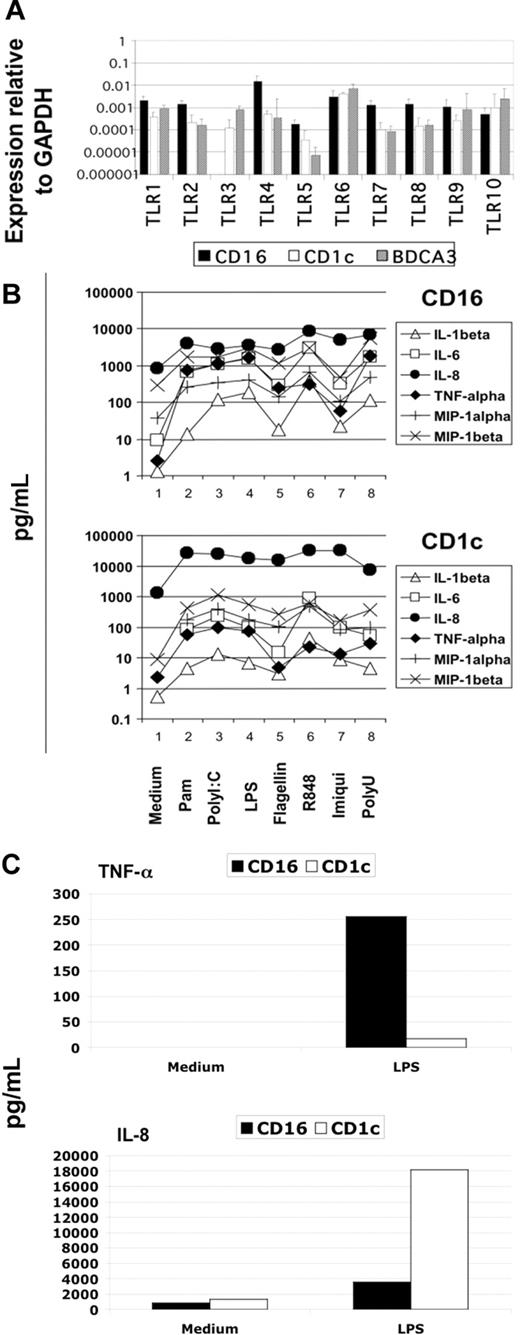
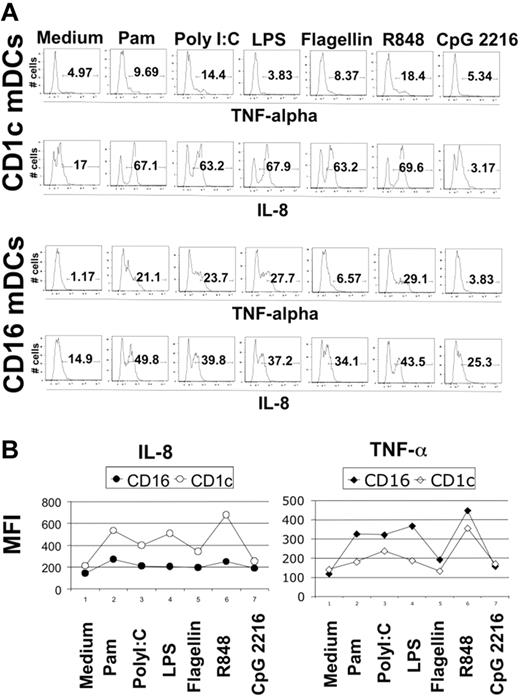
Blood DCs were sorted as described in “Material and methods,” and their TLR expression profile was analyzed using the highly sensitive method of real-time PCR. We detected the expression of all TLRs known in the 3 DC subtypes with the interesting exception of TLR3 in CD16-mDCs in 5 of 5 donors (Figure 2A). Generally, the expression of TLRs in CD16-mDCs was higher than in CD1c and BDCA-3-mDCs, except for TLR6 and TLR10 (Figure 2A). After this analysis, we focused our investigation on the secretion of a large panel of cytokines by CD16 and CD1c-mDCs in response to the principal TLR agonists. BDCA-3-mDCs are too rare to obtain enough cells for these functional studies. Highly purified mDCs and CD16 and CD1c-mDC subsets were cultured overnight with the TLR agonists, and a panel of 31 cytokines was measured in the culture supernatants using the multicytokine array system. As shown in Table 3, the principal cytokines produced by activated total mDCs were CCL3 (MIP-1α)/CCL4 (MIP-1β)/TNF-α/IL-6/CXCL8 (IL-8), indicating that circulating DCs have a strong proinflammatory activity. The quantities of cytokines secreted were as follows: CXCL8 (IL-8) ≥ TNF-α ≥ IL-6 ≥ CCL4 (MIP-1β) > CCL3 (MIP-1α), depending on the TLR agonist stimulation (data not shown). Total mDCs were able to produce also IL-1β, IFN-γ, GM-CSF, and granulocyte colony-stimulating factor (G-CSF), even if at low concentration. Among these cytokines, IL-1β displayed the highest level of production (Table 3, data not shown). Surprisingly, IL-12p70 was undetectable. Both CD16 and CD1c-mDCs showed strong responsiveness to all the principal TLR agonists known, with the exception of CpG, as expected. Interestingly, this response included PolyI:C for CD16-mDCs, which did not reveal detectable TLR3 expression. Generally, CD16-mDCs displayed a higher ability to produce cytokines than CD1c-mDCs (Figure 2B), and IL-1β is the cytokine secreted at lowest amounts in both mDC subsets (Figure 2B), whereas CXCL8 (IL-8) was constitutively expressed (Figure 2B, C). The CD16-mDC cytokine secretion pattern was very similar to that of total mDCs, because CD16-mDCs are the dominant mDC subset (Figure 2B). In contrast, the cytokine secretion pattern of CD1c-mDCs showed a strong specialization to produce CXCL8 (IL-8), which was secreted at concentrations at least one log higher than any other cytokine. In addition, CXCL8 (IL-8) production induced by most TLR agonists was approximately one log higher in CD1c-mDCs than in CD16-mDCs (Figure 2B). All other cytokines were produced at lower amounts by CD1c-mDCs than by CD16-mDCs, and this phenomenon was most dramatic for TNF-α, which was among the least abundant cytokines produced by CD1c-mDCs (Figure 2B). Figure 2C highlights the difference in CXCL8 (IL-8) and TNF-α production between the 2 mDC subsets in response to LPS, one of the most potent microbial stimuli. Thus, the major difference between CD16 and CD1c-mDC subsets appears to be the production of CXCL8 (IL-8) and TNF-α, 2 cytokines with key roles in innate immune responses (Figure 2B, C). TNF-α is a primary proinflammatory stimulus and is considered the principal readout for DCs activated by microbial stimuli, whereas CXCL8 (IL-8) is a central chemoattractant stimulus for immune cells. The differential production of CXCL8 (IL-8) and TNF-α between the mDC subsets was further confirmed by intracellular staining experiments. Here, the early addition of Brefeldin A prevented possible secondary effects of cytokines secreted in culture medium. Figure 3A shows the fluorescence histograms of TNF-α and CXCL8 (IL-8), with the percentage of positive cells, for both DC subsets stimulated with the indicated TLR agonists, whereas in Figure 3B, the MFI of the same histograms are reported.
Cytokine secretion of mDC subsets on TLR-mediated stimulation. (A) TLR expression profile of mDC subsets obtained from 5 donors using quantitative real-time PCR. Results are geometric means reported in logarithmic scale. (B) Differential cytokine secretion pattern between CD1c and CD16 mDC subsets in response to the indicated TLR agonists. Results are shown in logarithmic scale. Representative data from one donor out of 3. (C) Differential CXCL8(IL-8) and TNF-α production between CD16 and CD1c mDC subsets in response to LPS. Representative data from one donor out of 3.
Cytokine secretion of mDC subsets on TLR-mediated stimulation. (A) TLR expression profile of mDC subsets obtained from 5 donors using quantitative real-time PCR. Results are geometric means reported in logarithmic scale. (B) Differential cytokine secretion pattern between CD1c and CD16 mDC subsets in response to the indicated TLR agonists. Results are shown in logarithmic scale. Representative data from one donor out of 3. (C) Differential CXCL8(IL-8) and TNF-α production between CD16 and CD1c mDC subsets in response to LPS. Representative data from one donor out of 3.
Intracellular staining for CXCL8 (IL-8) and TNF-α in CD1c and CD16-mDCs. (A) Percentage of CXCL8 (IL-8) and TNF-α positive CD1c and CD16-mDCs after stimulation with the indicated TLR agonists. Fluorescence histograms are shown. (B) MFI of CXCL8 (IL-8) and TNF-α in the same experiment. Representative data from one donor out of 5.
Intracellular staining for CXCL8 (IL-8) and TNF-α in CD1c and CD16-mDCs. (A) Percentage of CXCL8 (IL-8) and TNF-α positive CD1c and CD16-mDCs after stimulation with the indicated TLR agonists. Fluorescence histograms are shown. (B) MFI of CXCL8 (IL-8) and TNF-α in the same experiment. Representative data from one donor out of 5.
In conclusion, the most represented mDC subsets, CD16 and CD1c-mDCs, responded strongly to all TLR agonists known, with the exception of CpG, and primarily secreted proinflammatory cytokines and chemokines. The CD1c-mDC subset was prevalently specialized in CXCL8 (IL-8) production and secretes very low amounts of TNF-α. The CD16-mDC subset produced higher amounts of most cytokines, particularly TNF-α, but significantly less CXCL8 (IL-8) than CD1c-mDCs in response to most of the TLR agonists. In addition, we found that there is no clear correspondence between the mRNA expression of TLR3 and the response to PolyI:C in the CD16-mDC subsets.
Stimulation of mDC subsets with cytokines
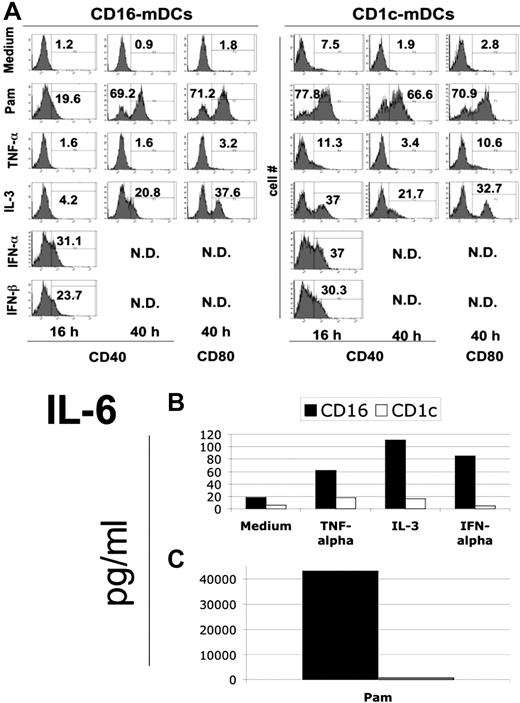
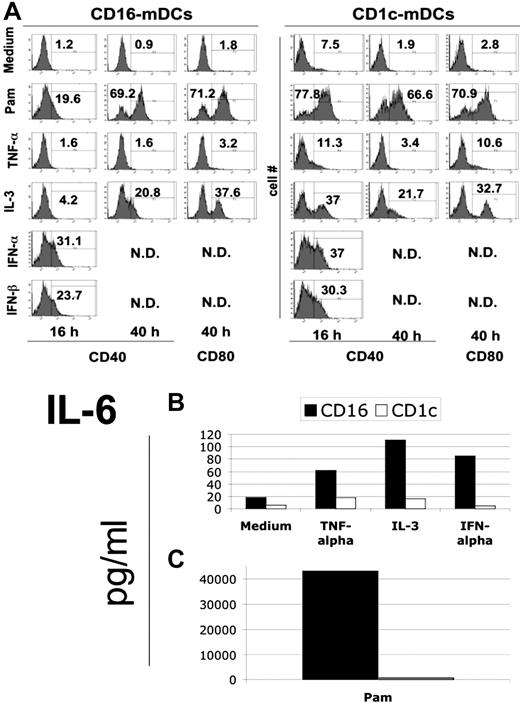
TNF-α plays a key role in inflammation through its pleiotropic activity.28 One of the most important functions of this cytokine is the maturation of DCs2 as observed in the mouse and human cultured DCs. IL-3 is an important stimulus to increase the viability and for differentiation of different cell types, including pDCs.7 Type I IFNs have not only an antiviral activity, but also a primary regulatory role in innate immunity, especially in DC activation.29 We investigated the effect of these fundamental endogenous stimuli on cytokine secretion and maturation of mDC subsets. As shown in Figure 4A, CD1c-mDCs responded more rapidly to microbial and IL-3 stimulation. IL-3 revealed a strong ability to induce mDC subset maturation, which was effective in CD1c-mDCs already after 16 hours. Type I IFNs are potent inducers of maturation of both mDC subsets (Figure 4A). The most interesting observation is that TNF-α was almost ineffective in inducing maturation of the mDC subsets. Because cultured DCs, including the widely used Mo-DCs, strongly mature on TNF-α stimulation, this new finding reveals an important biologic difference between cultured and ex vivo human DCs.
Maturation of mDC subsets after cytokine induction. (A) Expression of CD40 and CD80 molecules after the induction with the indicated endogenous stimuli for the reported time period in CD16 (left panel) and CD1c (right panel) mDCs. Fluorescence histograms with percentage of positive cells for both markers are reported. Representative data of one donor out of 3. (B) IL-6 secretion by mDC subsets after 40-hour stimulation with TNF-α, IL-3, type I interferons. (C) IL-6 secretion by mDC subsets in the same conditions as B on Pam stimulation. Note the difference in scale between B and C. Representative data of one donor out of 3.
Maturation of mDC subsets after cytokine induction. (A) Expression of CD40 and CD80 molecules after the induction with the indicated endogenous stimuli for the reported time period in CD16 (left panel) and CD1c (right panel) mDCs. Fluorescence histograms with percentage of positive cells for both markers are reported. Representative data of one donor out of 3. (B) IL-6 secretion by mDC subsets after 40-hour stimulation with TNF-α, IL-3, type I interferons. (C) IL-6 secretion by mDC subsets in the same conditions as B on Pam stimulation. Note the difference in scale between B and C. Representative data of one donor out of 3.
Regarding cytokine secretion, the induction potential of TNF-α, IL-3, and type I IFNs was very weak. In fact, the cytokine production on endogenous stimulation was more than 2 logs lower compared with TLR agonists (Figure 4B, C). As an example, we report here IL-6 production. Albeit at low levels, we confirmed the predominant production of CXCL8 (IL-8) by CD1c-mDCs in response to cytokines (data not shown). Noticeably, CD1c-mDCs did not secrete cytokines after type I IFN stimulation (Figure 4B, C).
Different cytokine production in the coculture of DC subsets and endothelial cells
The major difference in cytokine production between CD16 and CD1c-mDCs concerns TNF-α. Among the effects mediated by this cytokine, we consider central to innate immune response the effects on endothelial cells such as an increase of permeability and adhesion with blood cells, proliferation, and cytokine secretion.30,31
To evaluate the differential physiological impact of the mDC subsets on early immune responses, we cultured both stimulated mDC populations with HUVECs and tested the supernatants of these cocultures for a range of 31 cytokines.
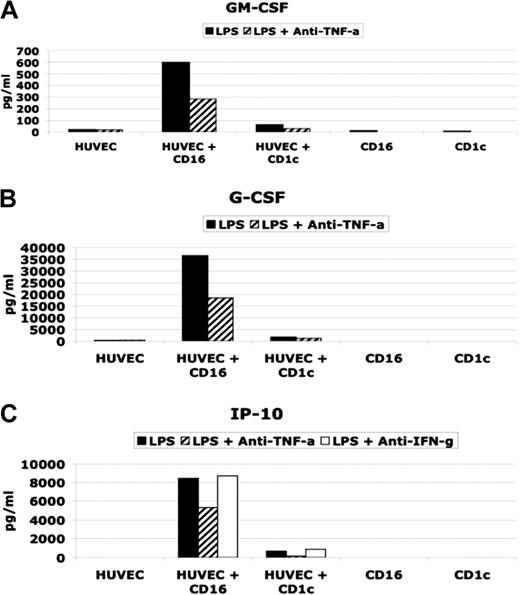
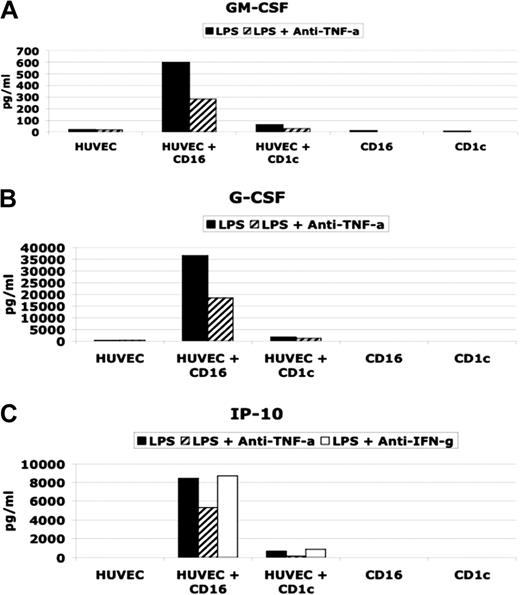
As shown in Figure 5, LPS-activated CD16-mDCs were able to induce in HUVECs the production of significant amounts of GM-CSF, G-CSF, and CXCL10 (IP-10), whereas CD1c-mDCs did not have the same effect. Stimulated mDC subsets secreted little or no GM-CSF, G-CSF, or CXCL10 (IP-10) (Table 3 and Figure 5). LPS alone was not a stimulus for GM-CSF, G-CSF, and CXCL10 (IP-10) secretion by HUVECs (Figure 5), whereas TNF-α or the combination of LPS and TNF-α strongly induced these cytokines in HUVECs (data not shown). In addition, using neutralizing antibodies for TNF-α, we observed a partial block of cytokine secretion. Because CXCL10 (IP-10) secretion has been reported to be induced by IFN-γ,32 and we have detected IFN-γ production by the DC subsets (Table 3), we tested whether neutralizing antibodies for IFN-γ blocked CXCL10(IP-10) induction (Figure 5C). Our results indicate that TNF-α but not IFN-γ played a central role in CXCL10 (IP-10) induction in HUVECs.
Effect on HUVEC cytokine secretion by CD16 and CD1c-mDCs. (A and B) GM-CSF and G-CSF secretion in HUVEC/DC coculture stimulated with LPS in presence or absence of neutralizing anti TNF-α antibodies. (C) (CXCL10) IP-10 secretion in HUVEC/DC coculture stimulated with LPS in presence or absence of neutralizing anti-TNF-α and anti-IFN-γ antibodies.
Effect on HUVEC cytokine secretion by CD16 and CD1c-mDCs. (A and B) GM-CSF and G-CSF secretion in HUVEC/DC coculture stimulated with LPS in presence or absence of neutralizing anti TNF-α antibodies. (C) (CXCL10) IP-10 secretion in HUVEC/DC coculture stimulated with LPS in presence or absence of neutralizing anti-TNF-α and anti-IFN-γ antibodies.
Taken together, these results demonstrate that the difference in GM-CSF, G-CSF, and CXCL10 (IP-10) production between the cultures of HUVECs with CD16 and with CD1c-mDCs is attributable to the big difference in TNF-α secretion by the mDC subsets, which, in turn, stimulate HUVECs to produce CXCL10 (IP-10), GM-CSF, and G-CSF.
Discussion
In this study, we confirmed the existence in the human blood of 3 previously identified DC populations characterized by the expression of the surface antigens CD16, CD1c, and BDCA-3.10,11 We showed that these 3 cell populations are subsets of immature circulating mDCs and, together with pDCs, they appear to represent the totality of DC subtypes in human blood. CD16 and CD1c-mDCs were the most represented mDC subsets, whereas BDCA-3-mDCs was very rare. The CD34+ blood cell population can no longer be considered a DC subset, because we showed that all circulating CD34+ cells were Lin-/HLA-DR+ and that this cell population was negative for CD11c and CD86, the principal markers for myeloid circulating DCs. In addition, the CD34+ population in the bone marrow, a well-accepted source of progenitor cells, was the major subset of Lin-/HLA-DR+ cells, reinforcing that this staining combination is not sufficient to identify circulating DCs. This observation is in line with a previously published study that clearly showed low allostimulation capacity of CD34+ blood cells.10
Cytokines and chemokines are central to define the role of DCs in immune responses, especially in innate immunity.2,33 In fact, the primary effect of the pathogen encounter on DCs is the induction of cytokine and chemokine production.34,35 Moreover, these molecules have a crucial impact on the ensuing adaptive immune response.34,36,37
For the first time, we analyzed a large panel of cytokines secreted by mDC subsets in response to a complete set of known TLR agonists. The major cytokines secreted by mDCs were CXCL8 (IL-8)/IL-6/TNF-α/CCL4 (MIP-1β)/CCL3 (MIP-1α) and, to a lesser extent, IL-1β; these have a primary role in the induction of inflammation. IL-6 is also an important T and B cell activator. Cytokine secretion by mDCs started after 1 hour of stimulation (data not shown). In contrast to published results,6,9 our data showed the absence of detectable IL-12p70 in culture supernatants of stimulated total mDCs or mDC subsets. This discrepancy may be explained by the use of a combination of IL-12p40 and p70 mAbs6,38 or because the studies showed a clear IL-12p70 production only after a synergistic action of microbial stimuli.39–41 This last finding is consistent with our experiments that demonstrated IL-12p70 production by mDCs after stimulation with fixed bacteria (D.P., unpublished data). We do not have any conclusive explanation for the discrepancy with a study that detected significant IL-12p70 secretion only after PolyI:C stimulation.9
CD16 and CD1c-mDC subsets are broadly responsive to microbial stimulation, with the exception of CpG, as previously demonstrated. Interestingly, CD16-mDCs were good responders to PolyI:C even if they lack detectable TLR3 expression. This observation suggests that PolyI:C can activate cells through TLR3-independent mechanisms, as previously described for mouse DCs.42 In addition, CD16-mDCs displayed a stronger capacity than CD1c-mDCs in cytokine production.
The central finding of our study is the difference in CXCL8 (IL-8) and, above all, TNF-α production by the 2 subsets studied. CXCL8 (IL-8) plays a key role in innate immunity because it is the primary chemoattractive stimulus for granulocytes, monocytes, and lymphocytes.33 TNF-α, the major proinflammatory cytokine, is considered the most important readout for activated DCs and it is one of the principal maturation stimuli, especially for human cultured DCs.2,28 CD1c-mDCs displayed a marked specialization in producing IL-8, compared with other cytokines and in particular with TNF-α, and secreted significantly higher amounts of IL-8 and lower amounts of TNF-α than CD16-mDCs after the engagement of most of the TLR agonists. These data suggest a central role in the induction of inflammation only for CD16-mDCs. In line with this idea, the CD16+ DC population stained by the M-DC8 antibody was found to be committed to antibody-dependent cellular cytotoxicity through CD16 molecules and to high secretion of TNF-α.12,13 The M-DC8+ cells were found accumulated in inflamed tonsils and Peyer patches of the ileum in bacterially infected patients, and their frequency increased in the blood of patients with severe bacterial sepsis. Moreover, chronically inflamed ileal biopsies from patients with Crohn's disease showed a dense infiltration of MDC-8+ cells.43 Cell recruitment is the crucial early event in immune responses, and DCs are involved in this process by the production of chemoattractants and through the activation of endothelium to increase permeability and to secrete chemokines. Transwell migration assays using granulocytes and monocytes did not reveal major differences in the chemotactic potential of supernatants of both mDC subsets (data not shown). As we compare cocktails of cytokines, it may be that other substances, such as CCL3 (MIP-1α) and CCL4 (MIP-1β), contained in the CD16mDC supernatants compensated for the relatively lower amounts of CXCL8 (IL-8) present. Alternatively, the differential production of CXCL8 (IL-8) may have effects in vivo that are not adequately represented by the in vitro migration assays.
On the contrary, we found clear induction of CXCL10 (IP-10), GM-CSF, and G-CSF only when endothelial cells were cultured with CD16-mDCs. TNF-α played a central but not exclusive role in this activation process, because IL-1 and IL-6 have also been shown to activate endothelial cells.30,31 These results highlight the functional specialization of the mDC subsets studied; CD16-mDCs display a complete set of functions for the induction of innate immunity, whereas CD1c-mDCs are restricted to chemoattractant activity.
Because we found that CCL2 (MCP-1) was strongly induced by both mDC subsets (data not shown), CXCL10 (IP-10) strongly attracts T cells,32 and circulating DCs are cells ready to migrate and undergo activation in the tissues, we speculate that CD16-mDCs are central in assembling all the components of innate and adaptive immunity, recruiting T cells and monocytes that are induced by GM-CSF and G-CSF to differentiate into dendritic cells and macrophages, respectively. Although the CD1c-mDCs were shown to have strong efficiency in inducing T cell activation,10 this subset has only an accessory role for cell recruitment by contributing high amounts of CXCL8 (IL-8). TNF-α induced vasodilatation, necrosis, fibrosis, temperature increase, immune cell activation, and effects mediated by cell-to-cell contact complete the picture.
Type I interferons and IL-3 have a central role in immune responses and DC biology. IL-3 is secreted primarily by activated T cells, affects growth and generation of many cell types, including DCs, and is an important survival stimulus for pDCs,7,33 whereas type I interferons are the most potent antiviral cytokines that exert also an important regulatory effect, especially in pDC stimulation.29 Our results show that IL-3 and type I IFNs have a strong ability to induce CD16 and CD1c-mDC maturation but a very weak potential to induce cytokine production. Surprisingly, TNF-α is almost ineffective for CD16 and CD1c-mDC maturation, even if mDCs express at least one of the 2 forms of the TNFR. These new findings suggest a key role of IL-3 in the interplay between blood mDC subsets and T cells and confirm the important regulatory role of type I interferons that could be central to block viral infection. The prompt induction of maturation but weak cytokine response might be a way to accelerate the adaptive immune response avoiding the dangerous consequences of proinflammatory cytokine secretion in the bloodstream. The inability of TNF-α to induce CD16 and CD1c-mDC maturation suggest that these mDC subsets are activated principally by microbial rather than inflammatory stimuli, which highlights their role in the early encounter of pathogens as circulating DCs.
The publication costs of this article were defrayed in part by page charge payment. Therefore, and solely to indicate this fact, this article is hereby marked “advertisement” in accordance with 18 USC section 1734.
Acknowledgments
This work was supported in part by a grant from the European Commission 6th framework Program (Contract LSHB-CT-2004-512 074 DC-THERA NETWORK OF EXELLENCE).
Thanks to Ennio De Gregorio and Ugo D'Oro for critical reading of the manuscript and to Valerio Reguzzi for assistance in PCR data analysis.
Authorship
Contribution: D.P. designed and performed research, collected and analyzed data, and wrote the paper; S.T. performed sorting and assistance in flow cytometry experiments and data analysis; E.B. performed sorting and real-time PCR experiments and analyzed PCR data; V.S. performed blood and bone marrow cell stainings; S.N. performed sorting and assistance in flow cytometry experiments and data analysis; C.S. assisted in sorting experiments; M.B. prepared and cultured HUVECs and assisted in the HUVEC/DC experiments; D.M. provided bone marrow samples; F.L. provided bone marrow samples; and A.W. analyzed data and wrote the paper.
Conflict-of-interest disclosure: D.P., S.T., E.B., V.S., S.N., C.S., and A.W. are employed by Novartis Vaccines.
Correspondence: Andreas Wack, Molecular Immunology Department, Research Center, Novartis Vaccines, via Fiorentina 1 Siena, Italy; e-mail: andreas_wack@chiron.com.

