Abstract
Monoclonal gammopathy of undetermined significance (MGUS) can progress to multiple myeloma (MM). Although these diseases share many of the same genetic features, it is still unclear whether global gene-expression profiling might identify prior genomic signatures that distinguish them. Through significance analysis of microarrays, 52 genes involved in important pathways related to cancer were differentially expressed in the plasma cells of healthy subjects (normal plasma-cell [NPC]; n = 22) and patients with stringently defined MGUS/smoldering MM (n = 24) and symptomatic MM (n = 351) (P < .001). Unsupervised hierarchical clustering of 351 patients with MM, 44 with MGUS (24 + 20), and 16 with MM from MGUS created 2 major cluster branches, one containing 82% of the MGUS patients and the other containing 28% of the MM patients, termed MGUS-like MM (MGUS-L MM). Using the same clustering approach on an independent cohort of 214 patients with MM, 27% were found to be MGUS-L. This molecular signature, despite its association with a lower incidence of complete remission (P = .006), was associated with low-risk clinical and molecular features and superior survival (P < .01). The MGUS-L signature was also seen in plasma cells from 15 of 20 patients surviving more than 10 years after autotransplantation. These data provide insight into the molecular mechanisms of plasma-cell dyscrasias.
Introduction
Multiple myeloma (MM) is a prototypical clonal B-cell malignancy with a terminally differentiated plasma-cell (PC) phenotype. According to longitudinal follow-up of residents of Olmsted County, Minnesota, the annual rate of progression to MM from monoclonal gammopathy of undetermined significance (MGUS) is 1%.1 This clinically benign condition, with distinct neoplastic features such as aneuploidy, increases in frequency with advancing age and reaches 5.3% in persons 70 years of age and older.2 Although the median patient age is approximately 70 years, MM has been diagnosed in teenagers with clinical features and clinical courses resembling those of elderly patients. Family clusters of MM have also been reported,3 but exposure to chemical and physical carcinogens is generally considered etiologic in MM4 ; HHV8 infection of dendritic cells could not be confirmed.5,6 A long latency phase of 15 to 20 years passed before an increase in MM incidence was documented in Japan as a result of the nuclear fallout from the atomic bombs.7 Thus, it is plausible to assume that younger patients are likely to develop MM acutely, whereas a smoldering clinical course has been frequently documented to precede the onset of symptomatic MM in the elderly. Smoldering MM (SMM) can be considered an advanced phase of MGUS; even at the time of progression, SMM-evolved MM usually lacks osteolytic lesions or other cardinal features of symptomatic MM. MM remains hypoproliferative, with a long lifespan of malignant B cells, that assumes high-grade proliferative features only in the terminal phase, from which all human MM cell lines have been derived.8,9
Most genetic lesions typical of MM are already present at the MGUS stage.10-12 Although these genetic abnormalities can be detected only in interphase cells in MGUS, their detection by metaphase karyotyping in one third of patients with MM reflects increased mitotic activity (possibly reflecting the ability of cells to proliferate outside the confines of the bone marrow milieu) and confers an adverse prognosis.13
Although gene-expression profiling (GEP) of CD138-selected cells from bone marrow aspirates was able to distinguish between NPC and MM, it was difficult to distinguish between MM and MGUS.14-16 GEP studies with whole genome microarrays on larger cohorts of healthy subjects and patients with MGUS, SMM, and MM permitted the discovery of genes that were differentially expressed in comparisons of NPC and of MGUS and MM. Unsupervised hierarchical clustering led to the identification of MGUS with features of MM and of MM with features of MGUS.
Patients, materials, and methods
International Myeloma Working Group criteria were used to classify patients as having MGUS, SMM, or symptomatic MM. For a diagnosis of MGUS, levels of monoclonal protein could not exceed 30 g/L, and bone marrow infiltration with plasma cells could not be less than 10%. Also excluded for this diagnosis was any evidence of related organ or tissueimpairment (ROTI) defined as hypercalcemia, renal impairment, anemia, or bone lesions attributed to plasma-cell proliferation. For SMM, ROTI had to be absent, but levels of bone marrow plasmacytosis could exceed 10% and monoclonal protein levels could be greater than 30 g/L.
The analysis described here made use of samples from 22 healthy donors, patients with MGUS (n = 44), SMM (n = 12), or MM with MGUS history (referred to as MM from MGUS [n = 16]), and 351 patients with newly diagnosed MM subsequently treated with total therapy 2 (TT2), a tandem transplantation trial for symptomatic or progressive MM.17 Test sets consisted of 214 patients with MM enrolled in TT3 and 20 patients surviving more than 10 years after treatment with TT1.18 Table 1 lists laboratory parameters for patients with MGUS and SMM (at diagnosis or progression to MM) and for patients with MM (before the initiation of therapy). For patients with MGUS/SMM, data were also retrieved from records of the referring institution. Thirty-two patients in the MGUS/SMM group had been enrolled in a prospective observational Southwest Oncology Group study (SWOG 0210) that called for clinical staging with bone marrow biopsy, skeletal survey, MRI at initial registration, and follow-up at 3- to 6-month intervals.
Samples were broken into groups. Group A (19 MGUS and 5 SMM) was composed of patients with documented stable disease parameters for at least 2.5 years (median, 4.3 years; mean, 5.5 years; range, 2.5-14.5 years). SMM patients included in group A had less than 20% PCs at their latest follow-up. For group B (25 MGUS and 7 SMM), the most recent follow-up was less than 2.5 years (median, 1.5 years; mean, 2.0 years; range, 0-7.3 years). Group C was composed of 16 patients with MM from MGUS (12 MGUS and 4 SMM); criteria were relevant for at least 1 year (median, 4.5 years; mean, 6.2 years; range, 1.1-19 years). In keeping with institutional and federal policies, written informed consent was obtained before bone marrow aspirate removal from the posterior iliac crest under local anesthesia.
The institutional review board of the University of Arkansas for Medical Sciences (Little Rock, AR) approved these studies.
Sample processing and molecular analyses
Plasma-cell isolation, total RNA extraction, cRNA synthesis, and hybridization to microarrays (U133 Plus 2.0; Affymetrix, Santa Clara, CA) were performed as described previously.19 Differences between MGUS (n = 24; group A) and NPC (n = 22) were determined by first filtering out all genes with an absent detection call in more than half these samples or by a χ2 value of more than 3.84. Significance analysis of microarray (SAM),20 with a false discovery rate (FDR) of 1%, was then applied to 9935 probe sets. A total of 2864 probe sets was differentially expressed between the 2 groups. Genes making up a myeloid-cell or a normal plasma-cell contamination signature were further subtracted. The contamination signature, including 5351 probe sets, was defined by the comparison of 95 MM contaminated by myeloid cells or normal plasma cells to 256 MM without contamination (SAM FDR less than 1%).19 This led to the identification of 2181 probe sets, with 1736 overexpressed and 444 underexpressed in MGUS compared with normal plasma cells (Table S1, available on the Blood website; see the Supplemental Tables link at the top of the online article). By using the same strategy, 458 genes with 161 overexpressed and 297 underexpressed in MGUS were found differentially expressed in a comparison between MGUS (n = 24; group A) and MM (n = 351) (Table S2). With the use of SAM intersect analysis, 52 genes were found to be significantly differentially expressed in both comparisons. Unsupervised hierarchical cluster analysis21 and supervised colorgram analysis22 were used on log2-transformed signal intensity values of the 52 SAM-defined genes. We recently reported on a validated molecular classification of MM into 7 disease subtypes based on commonalities of gene-expression signatures.19 In this classification scheme, “spiked” expression of MMSET (MS), MAF/MAFB (MF), and proliferation (PR) signatures together constituted high-risk disease, whereas hyperdiploidy (HY), low bone disease (LB), and CCND1/CCND3 translocations (CCND1/CCND3 also spike with CD20/MS4A1 and VPREB3 expression) represented low-risk MM.19 All patients in this study were also classified into 7 molecular subgroups based on a recently described 700-gene model.19 The classification of the training and test sets has been described.19 Approximately one third of CD138-enriched cells from patients with newly diagnosed disease in training and test sets and nearly all MGUS and SMM patients had myeloid-cell gene-expression signatures attributable to contamination of the selected fraction with cells of this lineage.19 Such patients were not included in a previous molecular classification of MM.19 No significant difference was observed in the proportions of MM patients with myeloid signature in MGUS-L and non–MGUS-L MM of the training set (24% vs 28%; P = .56), suggesting that the MGUS-L designation was not an artifact of the cell purification procedure. Because of the presence of strong myeloid signatures in the PCs of MGUS and SMM, these patients could not be accurately classified with the 7-subgroup model applied to MM. However, as with most patients with MM regardless of myeloid signature, translocation spikes can be observed. Thus, of the 56 patients with MGUS/SMM, 12 (21%) had CCND1 spikes, 2 (3%) had CCND3 spikes, 2 (3%) had MAF spikes, 4 had MAFB spikes, and none had MMSET/FGFR3 spikes. When the 7-subgroup model was applied to the MGUS/SMM patients, all samples with CCND1 or CCND3 spikes were classified as the CD-2 subtype. Moreover, all these patients expressed CD20 (MS4A1) and VPREB3 (data not shown), as previously reported for this subclass.19 In addition, all samples with MAF and MAFB spikes were classified as the MF subtype. These data indicate that in spite of myeloid contamination, a gene-expression signature consistent with these translocations could be recognized. For triple-color interphase fluorescence in situ hybridization (FISH) analysis of abnormalities of chromosomes 1q21 and 13q14, we used procedures previously described.23
Statistical analyses
The Kaplan-Meier Method24 was used to estimate overall survival, with group comparisons made using the log-rank test.25 Overall survival was defined from the date of registration until death from any cause; survivors were censored at the time of last contact. Univariate and multivariate analyses of prognostic factors were performed with Cox regression.26 The cumulative incidence of complete remission was estimated using the method outlined in Gooley et al27 and was compared with the log-rank test.
Gene-expression data
All microarray data have been deposited in the NIH Gene Expression Omnibus (GEO; National Center for Biotechnology Information [NCBI], http://www.ncbi.nlm.nih.gov/geo/) under accession number GSE2658 for 351 patients with MM in the training set and 214 with MM in the test set and under accession number GSE5900 for 22 patients with NPC, 44 with MGUS, and 12 with SMM.
Results
Clinical, laboratory, and molecular features in patients with MGUS, SMM, and MM
As expected, patients with MM had features of greater tumor burden and aggressiveness than subjects with MGUS or SMM (Table 1). Thus, higher proportions of patients in the MM group had elevations of β2-microglobulin (B2M), C-reactive protein (CRP), lactate dehydrogenase (LDH), creatinine, and bone marrow plasmacytosis and lower levels of hemoglobin and albumin. Focal lesions were absent in all subjects with MGUS but present in 17% of patients with SMM and 80% of patients with MM, 59% of whom had at least 3 focal lesions. Cytogenetic abnormalities were absent in all patients with MGUS and SMM and present in one third of patients with MM. Patients with MM from MGUS tended to be older and, as a group, to have higher hemoglobin levels, fewer cytogenetic abnormalities, lower levels of marrow plasmacytosis, and fewer MRI lesions than patients with MM in whom a history of MGUS/SMM was not documented.
Identifying genes uniquely dysregulated in PCs of MGUS in the context of PCs of healthy subjects and patients with MM
SAM intersection analyses identified 52 genes with differential expression levels across NPC, MGUS, and MM; these were involved in cell-cycle control, DNA synthesis, chromosome assembly, nuclear protein import, gene transcription, cell aging, cell signaling, metabolism, energy production, ion transport, reactive oxygen metabolism, drug resistance, and programmed cell death/apoptosis (Table 2). Of the 52 genes, 41 exhibited a progressive increase in expression levels along the transition from NPC to MGUS to MM, and 4 exhibited a progressive reduction in expression from NPC to MGUS to MM; 6 genes had higher and 1 gene had lower expression levels in MGUS compared with NPC and MM.
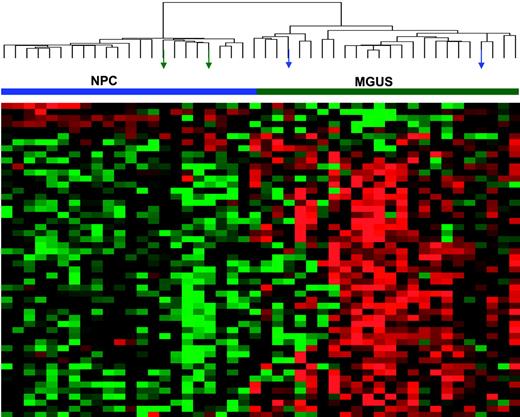
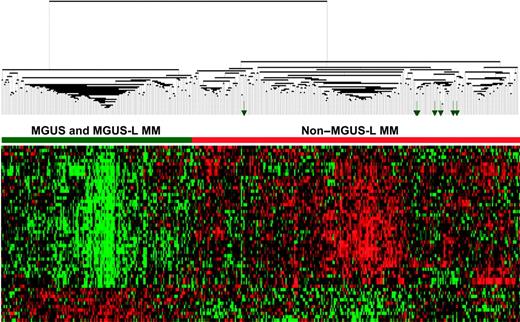
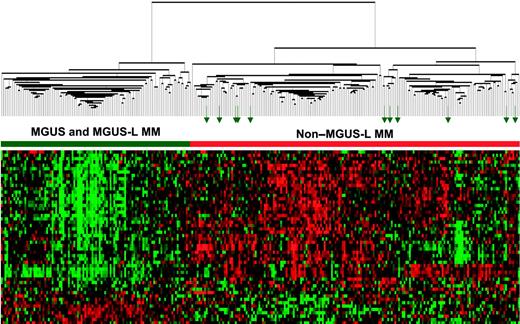
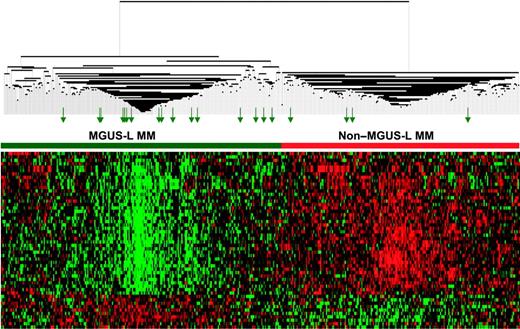
The differential expression of the 52 genes in the 22 NPC and 24 MGUS patients was visualized through unsupervised hierarchical clustering (Figure 1): 2 major branches were identified, one containing all but 2 of the MGUS patients and the other containing all but 2 of the NPC samples. When applied to the 56 patients with MGUS, 16 patients with MM from MGUS, and 351 patients with MM in the training group (Figure 2), the sample dendrogram produced 2 major branches, one containing 49 of the 56 (88%) MGUS patients (including 8 of the 12 SMM), 7 of the 16 (44%) MM from MGUS patients, and 99 of the 351 (28%) MM patients; the second branch consisted of 7 of the 56 (12%) MGUS patients (including 4 of the 12 with SMM), 9 of the 16 (56%) with MM from MGUS, and 252 of the 351 (72%) with MM. MM in the first branch was designated MGUS-like (MGUS-L MM), and that in the second branch was termed non–MGUS-like (non–MGUS-L MM); MGUS in the second branch was designated MM-like (MM-L). Three of the 24 (12%) MGUS/SMM in group A and 4 of the 32 (12%) MGUS/SMM in group B were classified as non–MGUS-L.
Expression patterns of 52 genes differentially expressed in PCs of healthy donors (NPC) and patients with MGUS. Two-dimensional unsupervised hierarchical cluster analysis of 52 genes (rows) in CD138-enriched plasma cells from 22 healthy donors and 24 MGUS patients (columns). Mean-centered gene expression is depicted by a normalized-signal pseudocolor scale, as described.21 Red and green indicate overexpressed and underexpressed genes, respectively. Sample dendrogram (top), reflecting relatedness among samples, consists of 2 major branches defined by overexpressed and underexpressed genes. The left branch consists of 22 NPC samples (horizontal blue bar) and 2 MGUS samples (green arrows), whereas the right branch contains all MGUS (horizontal green bar) and a subset of 2 NPC samples (blue arrows).
Expression patterns of 52 genes differentially expressed in PCs of healthy donors (NPC) and patients with MGUS. Two-dimensional unsupervised hierarchical cluster analysis of 52 genes (rows) in CD138-enriched plasma cells from 22 healthy donors and 24 MGUS patients (columns). Mean-centered gene expression is depicted by a normalized-signal pseudocolor scale, as described.21 Red and green indicate overexpressed and underexpressed genes, respectively. Sample dendrogram (top), reflecting relatedness among samples, consists of 2 major branches defined by overexpressed and underexpressed genes. The left branch consists of 22 NPC samples (horizontal blue bar) and 2 MGUS samples (green arrows), whereas the right branch contains all MGUS (horizontal green bar) and a subset of 2 NPC samples (blue arrows).
Expression patterns of 52 genes segregate MGUS and MGUS-L MM from non–MGUS-L MM. Two-dimensional unsupervised hierarchical cluster analysis of 52 MGUS genes (rows) in CD138-enriched plasma cells of patients with MGUS (n = 56), MM from MGUS (n = 16), and newly diagnosed MM (n = 351) (columns). The left branch consists of MGUS and MGUS-like MM samples (horizontal green bar), and the right branch contains the non–MGUS-L MM (horizontal red bar). Green arrows represent MGUS patients (MM-L MGUS).
Expression patterns of 52 genes segregate MGUS and MGUS-L MM from non–MGUS-L MM. Two-dimensional unsupervised hierarchical cluster analysis of 52 MGUS genes (rows) in CD138-enriched plasma cells of patients with MGUS (n = 56), MM from MGUS (n = 16), and newly diagnosed MM (n = 351) (columns). The left branch consists of MGUS and MGUS-like MM samples (horizontal green bar), and the right branch contains the non–MGUS-L MM (horizontal red bar). Green arrows represent MGUS patients (MM-L MGUS).
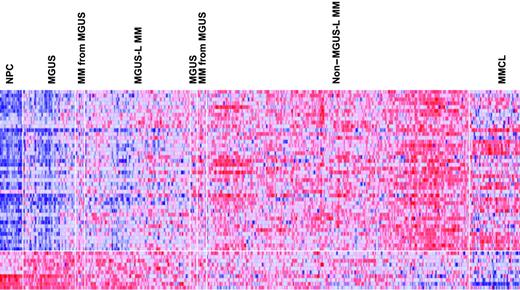
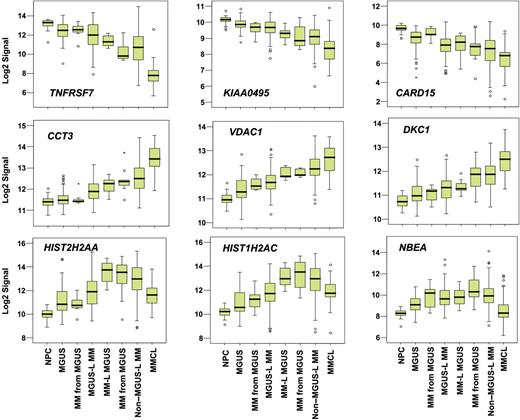
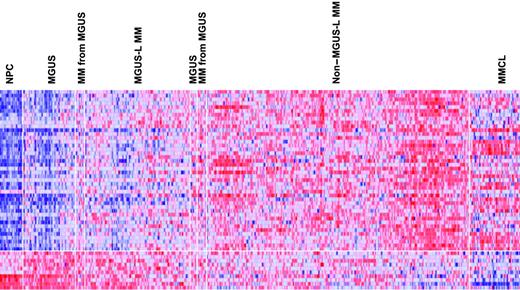
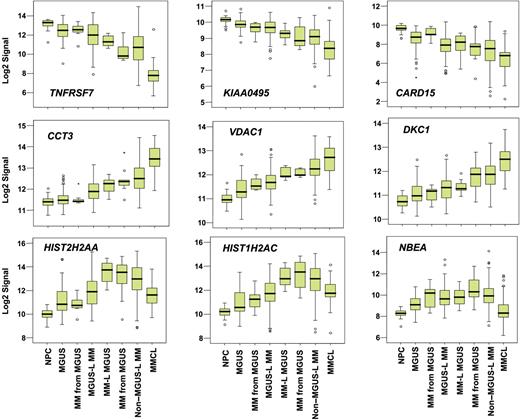
Supervised visualization of the expression of the 52 genes across the groups described, along with NPC and human myeloma cell lines (MMCL), is provided (Figure 3). NPC and MMCL represent the extremes of benign and malignant PCs, and their PC GEP signatures are consistent with this extreme divergence. Box plots of the expression of select genes are shown in Figure 4. TNFSF7/CD27, KIAA0495, and CARD15 genes were representative of those progressively down-regulated, whereas CCT3, VDAC1, and DKC1 genes were representative of those progressively up-regulated in the transition from NPC to MMCL. HIST1H2AC, HIST1H2AC, and NBEA were representative of genes showing an increase from NPC to the MGUS-L MM with a significant reduction in expression seen in the non–MGUS-L MM and especially in MMCL.
Expression levels of the 52 MGUS genes in PC of healthy donors and patients with MGUS and MM. A colorgram of the expression of the 52 genes in NPC (n = 22), MGUS, MM from MGUS (n = 72), and MM (n = 351) (based on their location in either of the 2 major branches of the dendrogram in Figure 2) and multiple myeloma cell lines (MMCLs) (n = 22). MGUS and MM from MGUS on the left side of the figure represent clusters in the MGUS-L MM branch of Figure 2, and those on the right side represent clusters in the non–MGUS-L MM branch. Genes are indicated along the vertical axis and samples on the horizontal axis. The normalized expression value for each gene is indicated by a color, with red representing high expression and blue representing low expression. Note that NPCs have a distinct pattern of overexpressed and underexpressed genes that progressively inverts with transition to MGUS, MGUS-L MM, non–MGUS-L MM, and finally to MMCL.
Expression levels of the 52 MGUS genes in PC of healthy donors and patients with MGUS and MM. A colorgram of the expression of the 52 genes in NPC (n = 22), MGUS, MM from MGUS (n = 72), and MM (n = 351) (based on their location in either of the 2 major branches of the dendrogram in Figure 2) and multiple myeloma cell lines (MMCLs) (n = 22). MGUS and MM from MGUS on the left side of the figure represent clusters in the MGUS-L MM branch of Figure 2, and those on the right side represent clusters in the non–MGUS-L MM branch. Genes are indicated along the vertical axis and samples on the horizontal axis. The normalized expression value for each gene is indicated by a color, with red representing high expression and blue representing low expression. Note that NPCs have a distinct pattern of overexpressed and underexpressed genes that progressively inverts with transition to MGUS, MGUS-L MM, non–MGUS-L MM, and finally to MMCL.
Box plots of expression profiles of genes exhibiting common patterns. Expression levels of select genes exhibiting progressive loss (top 3 panels), progressive increase (middle 3 panels), or increased followed by decreased expression (bottom 3 panels) across the sample groups, as ordered in Figure 2. Sample groups are plotted along the x-axis, and the natural log-transformed Affymetrix-derived signal is plotted on the y-axis. Top, bottom, and middle lines of each box correspond to the 75th percentile (top quartile), 25th percentile (bottom quartile), and 50th percentile (median), respectively. The whiskers extend from the 10th percentile (bottom decile) and top 90th percentile (top decile). Open circles denote outliers within each group. MGUS and MM from MGUS on the left side of the figure represent clusters in the MGUS-L MM branch of Figure 2, and those on the right side represent clusters in the non–MGUS-L MM branch.
Box plots of expression profiles of genes exhibiting common patterns. Expression levels of select genes exhibiting progressive loss (top 3 panels), progressive increase (middle 3 panels), or increased followed by decreased expression (bottom 3 panels) across the sample groups, as ordered in Figure 2. Sample groups are plotted along the x-axis, and the natural log-transformed Affymetrix-derived signal is plotted on the y-axis. Top, bottom, and middle lines of each box correspond to the 75th percentile (top quartile), 25th percentile (bottom quartile), and 50th percentile (median), respectively. The whiskers extend from the 10th percentile (bottom decile) and top 90th percentile (top decile). Open circles denote outliers within each group. MGUS and MM from MGUS on the left side of the figure represent clusters in the MGUS-L MM branch of Figure 2, and those on the right side represent clusters in the non–MGUS-L MM branch.
Relating MGUS-L and non–MGUS-L signatures to previously identified molecular classes of MM
We next determined whether there were differences in the distribution of molecular subgroups of MM in the MGUS-L MM and non–MGUS-L MM patients. Of the 351 patients with MM used in the current analysis, 95 had been excluded, because of a myeloid expression signature, from the molecular classification schema described previously,19 thus leaving 76 MGUS-L MM and 180 non–MGUS-L MM classified (Table 3). A PR signature was absent in all MGUS-L MM and present in 29 (16%) of the non–MGUS-L MM (P < .001). HY was less frequent in MGUS-L (5% vs 34%, P < .001); CD-1 and CD-2 groups were more common in MGUS-L than in non–MGUS-L MM (15% vs 6% [P = .038] for CD-1 and 47% vs 4% [P < .001] for CD-2).
MGUS-L signature is associated with favorable clinical characteristics and superior survival in spite of lower incidence of complete remission
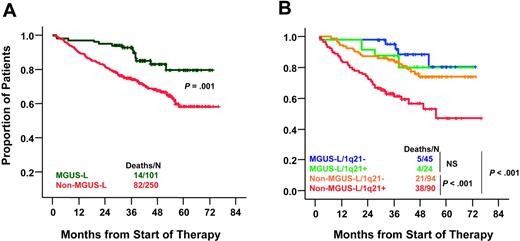
Compared with non–MGUS-L MM, MGUS-L MM was characterized by lower frequencies of elevated B2M (more than 3 mg/L) (33% vs 56%; P < .001), cytogenetic abnormalities (17% vs 42%; P < .001), high-risk molecular subgroups (PR, MS, MF) (22% vs 43%, P = .001), elevated lactate dehydrogenase (LDH) (more than upper limit of normal [ULN]) (12% vs 26%; P = .005), and bone marrow plasmacytosis (more than 30%) (56% vs 70%; P = .001) (Table 4). Despite a lower frequency of complete and near-complete remission in patients with MGUS-L MM (P = .006), these patients had better 5-year survival rates than those with non–MGUS-L MM (76% vs 59%; P = .009) (Figure 5A). Interphase FISH–defined gain/amplification of 1q21 (amp1q21) in MM tumor cells is associated with inferior survival.23 When examined in 253 of the 351 patients, amp1q21 was less frequent in patients with MGUS-L MM than in those with non–MGUS-L MM (35% vs 49%; P = .04). The negative prognostic impact of amp1q21 was seen only in the non–MGUS-L MM group, whose 5-year survival rates were 44% in the presence and 73% in the absence of amp1q21 (P = .001), similar to those of MGUS-L MM (Figure 5B). Chromosome 13 deletion, tested in 325 patients, was present with similar frequencies in MGUS-L and non–MGUS-L MM (52% vs 49%; P = .5) and was not linked to survival in either group (data not shown).
Superior overall survival in MGUS-L MM and non–MGUS-L MM lacking amp1q21. (A) Kaplan-Meier estimates of overall survival in MGUS-L MM and non–MGUS-L MM showed superior 5-year actuarial probabilities of event-free survival (64% vs 44%; P = .001) and overall survival (76% vs 59%; P = .009) in patients with MGUS signature. (B) Kaplan-Meier estimates of overall survival in MGUS-L and non–MGUS-L MM according to presence of amp1q21 by interphase FISH. Amp1q21 was not a significant adverse parameter in MGUS-L MM, but it identified a group at high risk among patients with non–MGUS-L MM.
Superior overall survival in MGUS-L MM and non–MGUS-L MM lacking amp1q21. (A) Kaplan-Meier estimates of overall survival in MGUS-L MM and non–MGUS-L MM showed superior 5-year actuarial probabilities of event-free survival (64% vs 44%; P = .001) and overall survival (76% vs 59%; P = .009) in patients with MGUS signature. (B) Kaplan-Meier estimates of overall survival in MGUS-L and non–MGUS-L MM according to presence of amp1q21 by interphase FISH. Amp1q21 was not a significant adverse parameter in MGUS-L MM, but it identified a group at high risk among patients with non–MGUS-L MM.
On multivariate analysis, the non–MGUS-L designation was an independent high-risk feature in addition to high-risk molecular subgroup designation, low albumin, high LDH, and presence of focal lesions on MRI examination (Table 5).
MGUS-L MM signature is linked to low-risk clinical and molecular characteristics in a separate test cohort of newly diagnosed MM
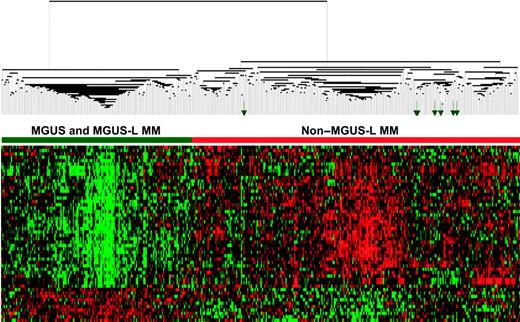
When unsupervised hierarchical clustering with the 52 genes was applied to profiles of PC from a separate cohort of 214 patients with newly diagnosed MM enrolled in TT3 and 56 MGUS and 16 MM-from-MGUS patients, 2 major branches in the sample dendrogram were noted in this test set: 45 of 56 (80%) MGUS and 5 of 16 (31%) of MM-from-MGUS patients clustered together with 55 (26%) of 214 MM patients (Figure 6). As with the 28% of MGUS-L MM patients in the training group, the MGUS-L MM group of the test set consisted of fewer patients with elevated B2M (42% vs 63%; P = .006), elevated LDH (7% vs 23%; P = .012), cytogenetic abnormalities (16% vs 36%; P = .006), or high-risk genetic subgroups (19% vs 41%; P = .018) (Table 6). None of the MGUS-L MM patients in the test set had a proliferation signature, few belonged to the MMSET group, and CCND1-1 and CCND1-2 designations predominated (Table 7).
MGUS-L signature is discernible in a test cohort of patients with newly diagnosed MM enrolled in TT3. As in Figure 2, a 2-dimensional unsupervised hierarchical cluster analysis of 52 genes (rows) in CD138-enriched plasma cells from MGUS (n = 56), MM from MGUS (n = 16), and newly diagnosed MM (n = 214). Green arrows represent MGUS clusters with so-called non–MGUS-L MM.
MGUS-L signature is discernible in a test cohort of patients with newly diagnosed MM enrolled in TT3. As in Figure 2, a 2-dimensional unsupervised hierarchical cluster analysis of 52 genes (rows) in CD138-enriched plasma cells from MGUS (n = 56), MM from MGUS (n = 16), and newly diagnosed MM (n = 214). Green arrows represent MGUS clusters with so-called non–MGUS-L MM.
Long-term survivors have an MGUS-L signature
Finally, we performed unsupervised hierarchical cluster analysis of CD138-selected PCs of 20 patients with MM surviving more than 10 years after the initiation of TT1,18 together with the 72 MGUS patients and the 351 patients with newly diagnosed MM in the training set (Figure 7). The sample dendrogram had 2 main branches, one containing all MGUS and MGUS-L MM and 15 of 20 (75%) of the long-term survivors (P < .001). Expression spikes for MAF and MAFB (with CCND2 overexpression), CCND1, and CCND3 were observed in the TT1 plasma cells (data not shown). The presence of spikes had no influence on whether the sample was defined as g MGUS-L or non–MGUS-L (data not shown).
MGUS-L signature is present in most PCs of patients still alive more than 10 years after TT1. As in Figure 2, a 2-dimensional unsupervised hierarchical cluster analysis of 52 genes (rows) in CD138-enriched plasma cells from patients with MGUS (n = 56), MM from MGUS (n = 16), and newly diagnosed MM (n = 351, training cohort) and from 20 long-term survivors (columns). Long-term survivor samples are indicated by green arrows.
MGUS-L signature is present in most PCs of patients still alive more than 10 years after TT1. As in Figure 2, a 2-dimensional unsupervised hierarchical cluster analysis of 52 genes (rows) in CD138-enriched plasma cells from patients with MGUS (n = 56), MM from MGUS (n = 16), and newly diagnosed MM (n = 351, training cohort) and from 20 long-term survivors (columns). Long-term survivor samples are indicated by green arrows.
Discussion
This is the first report on genomic differences recognized by global GEP in a comparative analysis between MM and its precursor conditions, MGUS and SMM. In an earlier report with a smaller number of patients and using a first-generation microarray, normal PCs could be distinguished from PCs of MM and MGUS combined, but PCs of MM and MGUS were indistinguishable.14-16 The similarity in the transcriptome between MGUS and MM was puzzling because MGUS usually remains clinically benign.1,2 By applying more sophisticated data mining approaches to a larger number of samples and a third-generation microarray with more than 54 000 gene features, we identified, in the current investigation, genes with roles in pathways related to cancer that were differentially expressed in PCs of healthy subjects, subjects with MGUS, and patients with MM.
Although MGUS progresses to MM at a low annual frequency of 1%, little is known about the proportion of patients whose MM has evolved from this precursor condition. With the use of unsupervised hierarchical clustering of the 52 genes differentially expressed in MGUS and MM, we identified and validated a subset of MGUS-L MM with favorable clinical features and longer survival; the lower complete response rate may be consistent with the reestablishment of an MGUS condition, assuming its PC to be highly resistant to cytotoxic therapies (similar to normal PCs present at the time of bone marrow aplasia after induction therapy for acute leukemia). These results are supported by the observation of an MGUS-L signature in most patients surviving more than 10 years after the initiation of total therapy 1.18 It is important to point out that only 5% of the TT1 long-term survivors were older than 65 years of age at diagnosis.
The difference in the distribution of molecular subgroups between the MGUS-L and non–MGUS-L MM tumors in the training (Table 4) and test (Table 7) sets is perplexing. Although some similarities hold, there was a particularly striking difference between the training and test sets for the HY group and somewhat less so for the MMSET group, perhaps because of the difference in the number of patients in the 2 trials or differences in the percentages of patients within the 7 subgroups enrolled in the 2 trials. Indeed, the test cohort had more HY patients than the training cohort.19 Larger numbers of patients may be required to resolve this question. One possibility is that it is related to the stage of disease when profiled. Perhaps MM with an MGUS-L signature may eventually acquire a non–MGUS-L signature over time. Once enough patients have been profiled and larger numbers within the 7 molecular classes with MGUS-L and non–MGUS-L designations are identified, Kaplan-Meier survival analyses can be performed to evaluate the interactions between the various classification schemas. Longitudinal studies on a case-by-case basis will reveal insight into the molecular changes accompanying progression in an individual patient.
In addition to identifying a low-risk MM entity with features of MGUS, clustering of MGUS patients with non–MGUS-L MM patients may relate to a subset of MGUS patients at high risk for conversion to MM. Subjects with MM-L MGUS may benefit from early therapeutic intervention in the absence of symptoms, whereas treatment may be held or deferred in patients with MGUS-L MM.
When examined in the context of a recently published molecular classification of MM,19 nearly 50% of MGUS-L MM patients were characterized as having CD-2–type disease as opposed to only 4% of patients with non–MGUS-L MM. In contrast, the other molecular class of t(11;14)(q13;q32)–positive disease, termed CD-1 (characterized by CCND1 or CCND3 spikes and lacking CD20 expression) was significantly underrepresented. As expected, the PR class was extremely rare in MGUS-L MM. The infrequent presence of high-risk PR and MS genetic subtypes in MGUS-L MM may explain the superior survival of such patients in comparison with those exhibiting non–MGUS-L MM. The possibility, however, of the eventual acquisition of a non–MGUS-L and PR signature with progression must be considered.19
Because of technical limitations, it is unclear whether the GEP differences among MGUS, MGUS-L MM, and non–MGUS-L MM are the result of a dilution effect caused by copurification of normal plasma cells or heterogeneity among clonally related tumor cells. Support for the latter possibility comes from the observation that TNFSF7/CD27, one of the genes in the current list of 52, is progressively down-regulated in the transition from NPC to MGUS to MM.28 With the use of flow cytometry, Moreau et al29 noted CD27 expression in PCs of all healthy donors, its absence in 36% of patients with MM at diagnosis and in 47% at relapse, and in 92% of human myeloma cell lines; survival was superior in CD27+ compared with CD27− MM. The agreement between the GEP data presented here and previously published protein expression studies supports our contention that the observed differences in PC among healthy donors, patients with MGUS, and patients with MM are specific to the disease process rather than a reflection of normal PC contamination.
We recently reported on a high-resolution map of recurrent, minimal common regions (MCRs) of gain/amplification and loss/deletion in newly diagnosed MM along with the genes residing in these MCRs whose expression was strongly correlated with changes in copy number.30 Of the genes identified in this study, the overexpression of CCT3 and HIST2H2AA, and the mapping to MCRs at 1q21-1q22, in MM relative to MGUS was observed. Consistent with this, we recently showed that FISH-defined amplification of 1q21 was absent in MGUS; its presence in some patients with SMM was associated with a higher risk for conversion to MM,23,31 and its presence in MM conferred short survival.23 Other genes mapping to MCRs of gain/amplification included SLC39A8 mapping to 4q22.3-4q24 and ASK/DBF4 mapping to 7q21.12. Genes mapping to MCRs of loss/deletion and exhibiting reduced expression in MM relative to MGUS included the caspase recruitment domain-containing protein 15 (CARD15) mapping at 16q11.2 and the fork-head box O1A (FOXO1A) transcription factor mapping near the peak of an MCR at 13q14.1. The identification of genes whose expression level is copy number sensitive in MM as differentially expressed in a comparison of MGUS with MM again suggests that differences are not likely to reflect the degree of contamination of normal plasma cells in the CD138-selected fractions, but rather the altered expression of this small subset of genes might be important in disease progression.
In conclusion, we used genomic profiling to identify a subset of genes whose expression patterns differentiated among PCs from healthy donors, patients with MGUS, and patients with MM. Patients with MGUS, exhibiting molecular features of MM and deemed at higher risk for conversion to overt MM, could be selected for secondary prevention trials. The prevalence of a MGUS-L signature in PCs of long-term survivors of TT1 raises the question whether these superior results could have been achieved with less aggressive treatment strategies. Investigation of the functional pathways of genes with differential expression levels in the various plasma cell dyscrasias may provide valuable insight into the enigmatic mechanisms of the multistep molecular pathogenesis of MM.
Authorship
Contribution: F.Z., B.B., and J.D.S. aided in conceptualization of the study and wrote the paper. J.D.S. supervised the work and analyzed the data. F.Z., Y.H., and D.R.W. performed microarray and data analyses. B.B., V.A., K.H., M.P.-R., G.T., F.v.R., M.Z., and M.D. provided clinical data.
Conflict-of-interest disclosure: The authors declare no competing financial interests.
Correspondence: John D. Shaughnessy, Donna D. and Donald M. Lambert Laboratory of Myeloma Genetics, Myeloma Institute for Research and Therapy, University of Arkansas for Medical Sciences, 4301 W. Markham Street, Little Rock, AR 72205.
The online version of this article contains a data supplement.
The publication costs of this article were defrayed in part by page charge payment. Therefore, and solely to indicate this fact, this article is hereby marked “advertisement” in accordance with 18 USC section 1734.
This work was supported by National Institutes of Health grants CA55819 (J.D.S., F.Z., G.T., and B.B.) and CA97513 (J.D.S.), the Fund to Cure Myeloma and Peninsula Community Foundation, and the Southwest Oncology Group.

