Abstract
The acquired activation of stem cell leukemia (SCL) during T lymphopoiesis is a common event in T-cell acute lymphoblastic leukemia (T-ALL). Here, we generated tamoxifen (TAM)–inducible transgenic mice (lck-ERT2-SCL) to study the consequences of acquired SCL activation during T-cell development. Aberrant activation of SCL in thymocytes resulted in the accumulation of immature CD4+CD8+ (double-positive, DP) cells by preventing normal surface expression of the T-cell receptor αβ (TCRαβ) complex. SCL-induced immature DP cells were further characterized by up-regulated NOTCH1 and generated noncycling polyclonal CD8+TCRβlow cells. The prevalence of these cells was SCL dependent because TAM withdrawal resulted in their disappearance. Furthermore, we observed that SCL activation led to a dramatic up-regulation of NOTCH1 target genes (Hes-1, Deltex1, and CD25) in thymocytes. Strikingly, NOTCH1 target gene up-regulation was already observed after short-term SCL induction, implying that enhanced NOTCH signaling is mediated by SCL and is not dependent on secondary genetic events. These data represent the basis for a novel pathway of SCL-induced leukemogenesis and provide a functional link between SCL and NOTCH1 during this process.
Introduction
The basic helix-loop-helix (bHLH) transcription factor stem cell leukemia (SCL, also known as tal1 or tcl-5) is aberrantly expressed in a high proportion of pediatric and adult cases of T-cell acute lymphoblastic leukemia (T-ALL).1,2 Normally, SCL is expressed in hematopoietic progenitor, erythroid and megakaryocytic cells, endothelium, and the central nervous system.3,4 Within the thymus, regular SCL expression is restricted to the most primitive cellular compartment neither expressing CD4 nor CD8, referred to as double-negative (DN) cells.5,6 During normal T-cell development, the in-frame rearrangement of the TCRβ chain drives the differentiation of DN cells into double-positive (DP, CD4+CD8+) cells via an intermediate CD8 immature single-positive (ISP) stage. This process, termed β-selection, is regulated by the pre-TCR, which comprises the CD3 complex in association with the rearranged TCRβ chain and the invariant pre-TCRα chain.7 Subsequently, the TCRα locus is recombined resulting in intermediate levels of the TCRαβ complex on the surface of DP cells. The majority of DP thymocytes die, either because they fail to express a TCR capable of interaction with self-peptide MHC complexes or because they bind too efficiently (“negative selection”). The appropriate, intermediate level of TCR signaling initiates effective maturation (“positive selection”)
Ectopic expression of SCL from the DN stage onward during T lymphopoiesis is thought to be one of the initiating events of T leukemogenesis. It was shown that the aberrant expression of SCL can be caused by chromosomal translocations and intrachromosomal deletions as well as by unknown mechanisms leading to the biallelic up-regulation of SCL.3,5 In developing T cells, SCL has been shown to operate predominantly as a transcriptional repressor by interfering with the normal activity of the bHLH transcription factors E2A and HEB.6,8,9 However, SCL has been shown to also act as a transcriptional activator in T cells,10 and a recent publication argued for a composite model with SCL acting as both an activator and repressor of transcription.11
The oncogenic potential of SCL was demonstrated in murine models.12-14 However, the development of leukemia was infrequent and required a long latency period in most models and was dependent on the collaboration with other oncogenes.12,14-17 The long latency period of SCL leukemia induction implies that additional genetic events are required. In fact, activating mutations within the NOTCH1 gene have recently been identified within human T-ALL samples expressing SCL18 and also within malignant T lymphoblasts arising in SCL transgenic mice.19,20
Important unanswered questions include the specific developmental stage at which acquired SCL activation perturbs T lymphopoiesis, and whether SCL affects NOTCH1 function during T-cell development. To address these, we established a conditional model of acquired SCL activation in developing thymocytes (lck-ERT2-SCL). Using this model, we identified DP and CD8 single-positive (SP) thymocytes with low TCRαβ surface expression as the cellular targets of aberrant SCL activation. Unexpectedly, we observed a precursor-product relationship between these SCL-induced DP and CD8 SP thymocytes. Furthermore, our study revealed that SCL induces an activation of the NOTCH1 pathway, thereby establishing a functional link between SCL and NOTCH1 during leukemogenesis.
Materials and methods
Generation of lck-ERT2-SCL transgenic mice
The cloning strategy used to generate the lck-ERT2-SCL construct is described in Document S1 (available on the Blood website; see the Supplemental Materials link at the top of the online article). The 7.3-kb lck-ERT2-SCL DNA fragment (Figure S1A) was excised by a SpeI digest from plasmid pERT2SCL and was used to inject fertilized FVB/N eggs (Ozgene, Bentley, WA, Australia). Transgenic animals were identified by Southern blot with a 1-kb murine SCL probe or alternatively by polymerase chain reaction (PCR) (5′-GGAAGTCCCAACTGACCCTA-3′ and 5′-ATTTTAGGGGCGCTTACCTG-3′, amplifying a 281-bp transgene-specific product).
The induction of the lck-ERT2-SCL transgene was achieved by intraperitoneal injections of TAM (1 mg in 100 μL corn oil; Sigma-Aldrich, St Louis, MO) as indicated in the figure legends or by TAM administration via the feed (“TAM-feed”; 1 g TAM/kg) as previously described.21
All experimental protocols were approved by the bioethics committee of the district of Düsseldorf, Germany and the Princess Margaret Hospital for Children in Perth, Australia.
Real-time RT-PCR and NOTCH1 sequence analysis
RNA was isolated from thymi and cell lines with the RNeasy kit (QIAGEN, Hilden, Germany). The RNA isolation procedure included an on-column digestion step of residual genomic DNA using DNase I. Reverse transcription (RT) was carried out using Advantage RT-for-PCR Kit (Clontech, Mountain View, CA) according to the manufacturer's instructions. Real-time polymerase chain reactions were performed with the ABI Prism 7900HT Sequence Detector (Applied Biosystems, Foster City, CA). Reactions were carried out in triplicates with target-specific assays listed in the Supplemental Methods. For quantification of each PCR result, we calculated the δCt value between the respective target gene and the housekeeping gene (GAPDH). The averaged δCt values from each individual mouse were used to perform the statistical analysis. Averaged δCt values of transgenic samples were subtracted from averaged δCt values of wild-type samples (δδCt). The 2−δδCt value (relative quantity) was expressed as fold change.
NOTCH1 heterodimerization (HD) and PEST domain sequence analysis was carried out with primers previously published by Lin and colleagues.19 The PCR-amplified fragments were gel purified, and the resulting sequences were compared with wild-type NOTCH1 (GenBank no. AB100603.1).
Flow cytometry and antibodies
All monoclonal antibody-fluorochrome conjugates were purchased from BD Pharmingen (San Jose, CA), except anti-CD25 (clone PC61.5; eBioscience, San Diego, CA; corresponding isotype control clone A110-1 [BD Pharmingen]). These included antibodies against CD4 (clone RM4-5), CD8 (53–6.7), CD24 (M1/69), TCRβ (H57–597; corresponding isotype control clone Ha4/8), CD44 (IM7, A95–1), Vβ2 (B20.6, R35–95), Vβ4 (KT4, A95.1), Vβ14 (14-2, R4-22), and NOTCH1 (mN1A, MOPC-31C). The staining of cells was performed as previously described.22 Data were acquired on a FACSCalibur or on a FACSCanto (Becton Dickinson, San Jose, CA), and analysis was performed with FlowJo software (Treestar, San Carlos, CA). Dead cells were excluded by forward and side scatter in addition to propidium iodide (PI) negativity when possible. For intracellular staining, cells were washed in 0.03% saponin as previously described23 or the BD Cytofix/Cytoperm kit was used (Becton Dickinson). Mitochondrial membrane potential was determined by incubating thymocytes with 1 μg JC-1 (Sigma-Aldrich)/mL for 15 minutes at 37°C. Apoptosis was assessed using FITC–annexin V (Becton Dickinson). For the analysis of thymocyte proliferation, mice received a single intraperitoneal injection of BrdU (1 mg per 6 g mouse weight), and BrdU-containing (1 mg/mL) drinking water was provided until organ harvest. Thymocytes were fixed and stained with APC-anti-BrdU (Becton Dickinson). NOTCH1 staining of primary TAM-SCL tumor cells was performed on thawed samples that were frozen in liquid nitrogen.
Fetal thymic organ culture
Fetal thymi were cultured on polycarbonate filters in 2 mL Iscove modified Eagle medium, 20% fetal calf serum, and 2 mM glutamine in 24-well plates. Thymocytes were harvested after 3 to 7 days in culture by gently squeezing lobes under a 1-mL syringe plunger in fluorescence-activated cell sorting (FACS) buffer, stained, and analyzed by FACS as mentioned under “Flow cytometry and antibodies.” Hydroxy-tamoxifen (OH-TAM, 100-400 nM; Sigma-Aldrich) was added to the media.
Statistics
All data are presented as means plus or minus SD. We performed all analyses (except where indicated) using 2-sample t tests with a 2-tailed significance set at the .05 level.
Results
Conditional SCL activation induces abnormal TCRβlow thymocytes
A conditional transgenic system was generated by fusing SCL to a mutated ligand-binding domain of the human estrogen receptor (ERT2).24 In preliminary experiments, we demonstrated T-cell–specific transgene expression, TAM-dependent nuclear translocation, and functionality of the ERT2-SCL fusion protein within thymocytes (Figure S1). Importantly, no immunophenotypic alterations of T-cell development were observed in lck-ERT2-SCL transgenic mice in the absence of TAM treatment (Figure S2). To confirm the known SCL-mediated alterations of gene expression in the lck-ERT2-SCL system, we analyzed the expression of RALDH2,10 pre-TCRα,9 RAG2,25 and Ephrin B1.11 As expected, we observed up-regulation of RALDH2 and Ephrin B1 and down-regulation of pre-TCRα and RAG2 in lck-ERT2-SCL transgenic compared with wild-type thymocytes (Table 1). Next, we confirmed that continuous oral TAM administration (“TAM-feed”) led to T-cell leukemia in lck-ERT2-SCL mice. TAM treatment for 5 to 17 months resulted in the development of T-ALL in lck-ERT2-SCL mice (in the first cohort of 23 lck-ERT2-SCL mice treated with TAM, 4 animals developed T-ALL, Table 2), while no T-cell malignancies were observed in untreated lck-ERT2-SCL (n = 14) nor in TAM-treated wild-type mice (n = 8) during the same observation period. The malignant nature of lck-ERT2-SCL T-ALLs was confirmed in secondary transplantation experiments (data not shown). We concluded that lck-ERT2-SCL transgenic animals provide a functional and conditional model of SCL-induced T leukemogenesis.
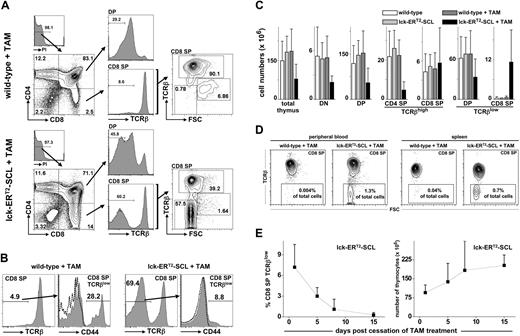
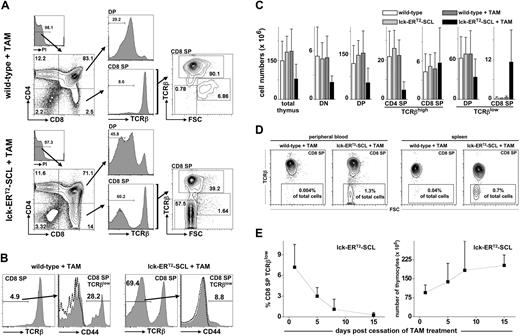
Subsequently, we studied the effect of acquired SCL activation on T-cell development using lck-ERT2-SCL transgenic mice. At 3 to 4 weeks of age, mice commenced consuming TAM feed, and their thymi were analyzed at different time points for the expression of CD4, CD8, and TCRβ. The most striking observation was the accumulation of CD8+TCRβlow cells (Figure 1A). These cells were at first interpreted to represent CD8 ISP cells. CD8 ISP thymocytes are intermediate transitional cells between DN and DP cells. Due to their highly proliferative nature CD8 ISP cells are large, lymphoblastic cells.26 However, CD8+TCRβlow cells of TAM-treated lck-ERT2-SCL mice (“TAM-SCL mice”) were not large (forward scatter high [FSChigh]) like wild-type ISP CD8 cells. Rather, these cells were as small (FSClow) as mature CD8+TCRβhigh T cells (Figure 1A). The abnormal nature of TAM-SCL CD8+TCRβlow cells was further underscored by the lower expression level of surface TCRβ compared with wild-type CD8 ISP cells. Importantly, an increased proportion of TCRβlow cells was also observed within DP thymocytes of TAM-SCL mice (Figure 1A). Analogous to CD8+TCRβlow cells, the proportion of small cells (FSClow) within DP TCRβlow was also increased (data not shown). A previous study had identified abnormal CD44-expressing CD8+TCRβlow cells in SCL and LMO1 double-transgenic mice.27 Therefore, we examined whether TAM-SCL CD8+TCRβlow cells also expressed CD44 (Figure 1B). In contrast to SCL and LMO1 double-transgenic mice, only a small proportion of TAM-SCL CD8+TCRβlow cells expressed relatively low amounts of CD44.
Conditional SCL activation induces the reversible accumulation of small CD8+TCRβlow thymocytes. (A) Thymic flow cytometric analysis of tamoxifen (TAM)–treated (fed for 3 weeks) lck-ERT2-SCL and littermate control mice. (B) Analysis of CD44 expression on CD8+TCRβlow cells. TAM feed for 6 weeks; wild-type, n = 4; lck-ERT2-SCL, n = 4; representative plots are shown; dashed lines represent corresponding isotype control staining. (C) Absolute cell numbers were calculated for total thymocytes and different subsets. Bars represent means plus or minus SD; wild-type no TAM, n = 10; lck-ERT2-SCL no TAM, n = 5; wild-type + TAM, n = 10; lck-ERT2-SCL + TAM, n = 13; TAM feed for 2-6 weeks. (D) CD8+TCRβlow cells were detected in peripheral blood and within spleens of TAM-treated lck-ERT2-SCL mice. Representative plots of at least 3 mice per group are shown; TAM feed for 3 to 4 weeks. The percentage of CD8+TCRβlow cells per total nucleated cells is displayed. (E) After the cessation of TAM treatment, thymic CD8+TCRβlow cells disappeared and thymic cellularity returned back to normal levels. A cohort of mice (n = 13) was injected with TAM (1 mg intraperitoneally daily) for 14 days. Flow cytometric analysis of the thymus was carried out on days 1, 5, 8, and 15 after cessation of TAM administration (at least n = 3 mice per time point). The proportion of CD8+TCRβlow cells per total nucleated thymocytes (left) and the total thymic cellularity (right) was calculated for each time point. Black squares represent mean (± SD). FSC indicates forward scatter; and PI, propidium iodide.
Conditional SCL activation induces the reversible accumulation of small CD8+TCRβlow thymocytes. (A) Thymic flow cytometric analysis of tamoxifen (TAM)–treated (fed for 3 weeks) lck-ERT2-SCL and littermate control mice. (B) Analysis of CD44 expression on CD8+TCRβlow cells. TAM feed for 6 weeks; wild-type, n = 4; lck-ERT2-SCL, n = 4; representative plots are shown; dashed lines represent corresponding isotype control staining. (C) Absolute cell numbers were calculated for total thymocytes and different subsets. Bars represent means plus or minus SD; wild-type no TAM, n = 10; lck-ERT2-SCL no TAM, n = 5; wild-type + TAM, n = 10; lck-ERT2-SCL + TAM, n = 13; TAM feed for 2-6 weeks. (D) CD8+TCRβlow cells were detected in peripheral blood and within spleens of TAM-treated lck-ERT2-SCL mice. Representative plots of at least 3 mice per group are shown; TAM feed for 3 to 4 weeks. The percentage of CD8+TCRβlow cells per total nucleated cells is displayed. (E) After the cessation of TAM treatment, thymic CD8+TCRβlow cells disappeared and thymic cellularity returned back to normal levels. A cohort of mice (n = 13) was injected with TAM (1 mg intraperitoneally daily) for 14 days. Flow cytometric analysis of the thymus was carried out on days 1, 5, 8, and 15 after cessation of TAM administration (at least n = 3 mice per time point). The proportion of CD8+TCRβlow cells per total nucleated thymocytes (left) and the total thymic cellularity (right) was calculated for each time point. Black squares represent mean (± SD). FSC indicates forward scatter; and PI, propidium iodide.
To further define the perturbation of thymopoiesis, we calculated absolute cell numbers of thymic subsets in TAM-SCL and control mice. In agreement with data generated with constitutive lck-SCL transgenics,8 we observed significant reductions in total (P < .05), DN (P < .001), and DP thymocytes (P < .001) of TAM-SCL mice (Figure 1C) compared with TAM-treated wild-type mice. Thus, conditional activation of SCL inhibited DN generation, which subsequently reduced DP numbers. Although DP numbers were dramatically reduced in TAM-SCL thymi, normal numbers of mature CD8+TCRβhigh were present while mature CD4+TCRβhigh cells were dramatically decreased (P < .001). In contrast to all other populations analyzed, adult TAM-SCL thymi produced enhanced numbers of CD8+TCRβlow cells (P < .005) compared with control mice (Figure 1C).
Normally, T-precursor cells remain within the thymus because they are dependent on extrinsic signals uniquely provided by the thymic microenvironment.28 Thus, we tested whether abnormal CD8+TCRβlow cells were capable of leaving the thymus. We were able to detect abnormal CD8+TCRβlow cells in peripheral blood and within spleens of TAM-SCL mice (Figure 1D). Hence, abnormal CD8+TCRβlow cells have the ability to leave the thymus and to survive independently of extrinsic signals inherent to the thymus.
Next, we exploited the conditional capacity of the lck-ERT2-SCL model to determine whether the existence of CD8+TCRβlow cells is dependent on sustained SCL activation. Different lck-ERT2-SCL and littermate control cohorts were treated with TAM for 14 days and their thymi were analyzed by flow cytometry 1, 5, 8, and 15 days after the cessation of TAM treatment. In addition, one lck-ERT2-SCL control cohort continuously received TAM for the whole experimental period (29 days). Indeed, we observed that the appearance of abnormal CD8+TCRβlow cells was reversed after the cessation of TAM. Already 5 days after the cessation of TAM treatment, the proportion of abnormal CD8+TCRβlow cells per total thymocytes decreased by more than 50%. Fifteen days after TAM cessation, CD8+TCRβlow cells had completely disappeared (Figure 1E). In contrast, we detected 12.9% (± 5.9%; mean ± SD) CD8+TCRβlow cells in lck-ERT2-SCL thymi when TAM treatment was continued (n = 3, TAM for 29 days, data not shown). Moreover, cessation of TAM treatment caused normalization of the lck-ERT2-SCL thymic cellularity (Figure 1E). These results demonstrated that sustained SCL activation was crucial for the maintenance of the abnormal CD8+TCRβlow cells within the thymus.
Conditional thymic SCL activation leads to the accumulation of intracellular TCRβ chains
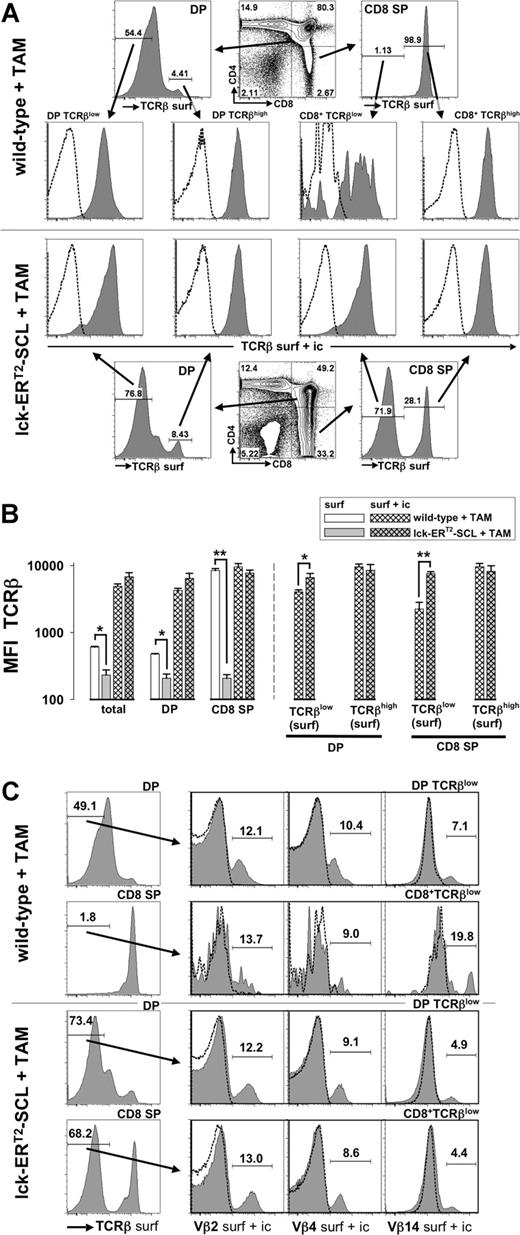
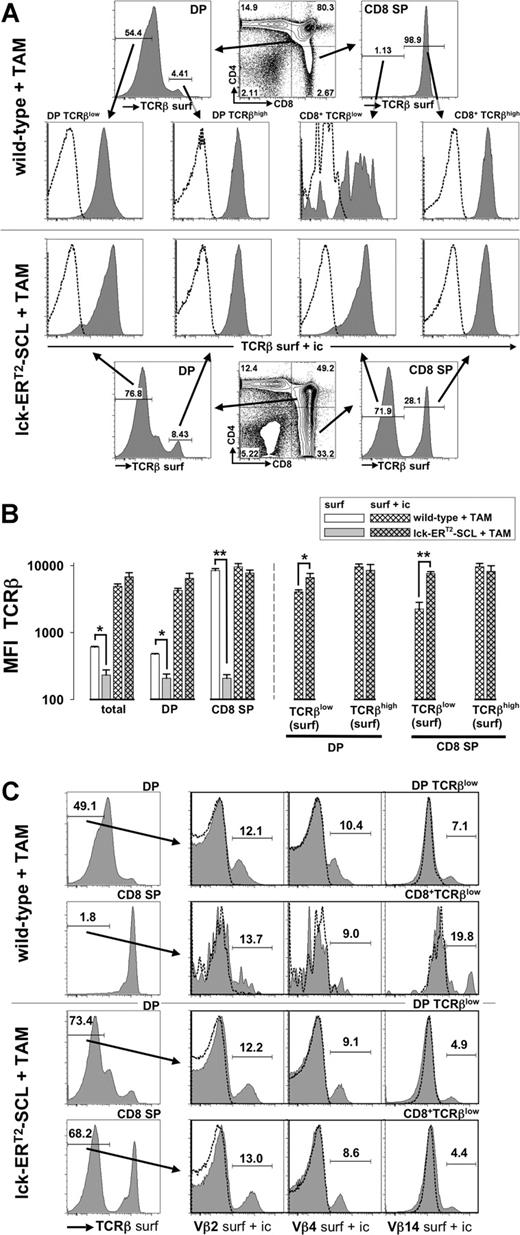
Previous work has demonstrated that aberrant SCL expression decreases the expression of RAG2 within developing thymocytes.8 Decreased RAG2 levels might lead to insufficient recombination at the TCRβ locus and might thus prevent TCRβ chain expression as a consequence of aberrant SCL activation. The TCRβ locus is recombined at the DN stage of thymopoiesis and the expression of the TCRβ chain is mainly restricted to the cytoplasm until the TCRα locus is recombined at the DP stage.29 Therefore, we carried out surface and intracellular TCRβ staining in parallel: intracellular TCRβ staining should reveal whether SCL completely prevents TCRβ chain expression. However, we were able to demonstrate that intracellular TCRβ chain expression was present in DP TCRβlow and CD8+TCRβlow cells of TAM-SCL mice (Figure 2A,B). Interestingly, we found that TAM-SCL DP TCRβlow and CD8+TCRβlow cells even expressed higher amounts of intracellular TCRβ chain than their wild-type control populations (Figure 2A,B). In contrast, intracellular TCRβ chain levels between mature populations (surface TCRβhigh) of TAM-SCL and TAM–wild-type mice did not differ significantly (Figure 2A,B). In conclusion, TAM-SCL CD8+TCRβlow cells expressed intracellular TCRβ chain levels that were more comparable with levels of DP thymocytes rather than wild-type CD8 ISP cells. Therefore, aberrant SCL activation did not inhibit TCRβ recombination in the majority of thymocytes. Accordingly, absent TCRβ surface expression must be due to an inability of TAM-SCL thymocytes to properly express an assembled TCRαβ complex on the cell surface.
Intracellular retention of the T-cell receptor β chain in CD4+CD8+ double-positive and CD8 single-positive thymocytes of tamoxifen-treated lck-ERT2-SCL transgenic mice. (A) After cell surface staining for CD4, CD8, and TCRβ (anti-TCRβ-FITC, TCRβ surf) thymocytes of tamoxifen (TAM)–treated (7 weeks) lck-ERT2-SCL (n = 3) and wild-type control littermates (n = 3) were permeabilized and subjected to a second staining with anti-TCRβ-PE (TCRβ surf + ic). Anti-TCRβ-PE staining (TCRβ surf + ic) of the permeabilized thymocytes predominantly reflects intracellular staining because surface TCRβ epitopes were already saturated with the TCRβ-FITC antibody (same clone as TCRβ-PE) during the surface staining procedure. Levels of intracellular TCRβ expression (TCRβ surf + ic) were determined within surface DP (double-positive; CD4+CD8+) TCRβlow, DP TCRβhigh, CD8+TCRβlow, and CD8+TCRβhigh populations. Representative plots are shown. Dashed lines represent corresponding isotype control data. (B) Quantification (median fluorescent intensity, MFI) of TCRβ surface (surf) and TCRβ intracellular (surf + ic) expression. Bars represent means plus or minus SD; *P < .05; **P < .001. (C) Surface DP TCRβhigh CD8+TCRβlow cells were analyzed for the presence of intracellular (surf + ic) variable β chains 2, 4, and 14 (Vβ2, Vβ4, and Vβ14). TAM-treated (13 weeks) lck-ERT2-SCL (n = 3) and wild-type control littermates (n = 4) were analyzed. Representative plots are shown.
Intracellular retention of the T-cell receptor β chain in CD4+CD8+ double-positive and CD8 single-positive thymocytes of tamoxifen-treated lck-ERT2-SCL transgenic mice. (A) After cell surface staining for CD4, CD8, and TCRβ (anti-TCRβ-FITC, TCRβ surf) thymocytes of tamoxifen (TAM)–treated (7 weeks) lck-ERT2-SCL (n = 3) and wild-type control littermates (n = 3) were permeabilized and subjected to a second staining with anti-TCRβ-PE (TCRβ surf + ic). Anti-TCRβ-PE staining (TCRβ surf + ic) of the permeabilized thymocytes predominantly reflects intracellular staining because surface TCRβ epitopes were already saturated with the TCRβ-FITC antibody (same clone as TCRβ-PE) during the surface staining procedure. Levels of intracellular TCRβ expression (TCRβ surf + ic) were determined within surface DP (double-positive; CD4+CD8+) TCRβlow, DP TCRβhigh, CD8+TCRβlow, and CD8+TCRβhigh populations. Representative plots are shown. Dashed lines represent corresponding isotype control data. (B) Quantification (median fluorescent intensity, MFI) of TCRβ surface (surf) and TCRβ intracellular (surf + ic) expression. Bars represent means plus or minus SD; *P < .05; **P < .001. (C) Surface DP TCRβhigh CD8+TCRβlow cells were analyzed for the presence of intracellular (surf + ic) variable β chains 2, 4, and 14 (Vβ2, Vβ4, and Vβ14). TAM-treated (13 weeks) lck-ERT2-SCL (n = 3) and wild-type control littermates (n = 4) were analyzed. Representative plots are shown.
Subsequently, we addressed by intracellular staining for different variable β (Vβ) chains whether TAM-SCL DP TCRβlow and CD8+TCRβlow cells represent monoclonal or polyclonal populations (Figure 2C). All Vβ chains analyzed (Vβ2, Vβ4, and Vβ14) were expressed in TAM-SCL DP TCRβlow and CD8+TCRβlow cells (Figure 2C) demonstrating that these populations were not monoclonal. Furthermore, the TAM-SCL CD8+TCRβlow Vβ2, 4, and 14 chain use was similar to wild-type use, further indicating that these cells were polyclonal rather than oligoclonal.
Abnormal CD8+TCRβlow cells are derived from CD4+CD8+ double-positive thymocytes
A number of reasons prompted us to hypothesize that atypical SCL-induced CD8+TCRβlow cells were derived from DP TCRβlow rather than DN or CD8 ISP thymocytes: First, in addition to the accumulation of CD8+TCRβlow thymocytes, we also observed an increased proportion of TCRβlow cells within DP cells. Second, in TAM-SCL thymi we detected the parallel existence of small and large CD8+TCRβlow cells (Figure 1A). This dichotomy was not due to transgene position effect variegation because it was also observed within other founder lines (data not shown). The small proportion of large CD8+TCRβlow cells might represent ISPs becoming DPs, while small CD8+TCRβlow cells might be abnormally derived from DPs. Third, the intracellular TCRβ chain levels of TAM-SCL CD8+TCRβlow cells were similar to intracellular TCRβ chain levels of DP thymocytes. In addition, we analyzed HSA (heat stable antigen, CD24) expression on SCL-induced CD8+TCRβlow thymocytes. Normally, HSA is progressively down-regulated during T-cell development. Remarkably, we found an intermediate HSA expression in the SCL-induced CD8+TCRβlow cells, which was overlapping with the HSA expression of DP TCRβlow cells. However, it was dramatically lower than the HSA expression of normal wild-type CD8 ISP (CD8+TCRβlow) cells (Figure S3).
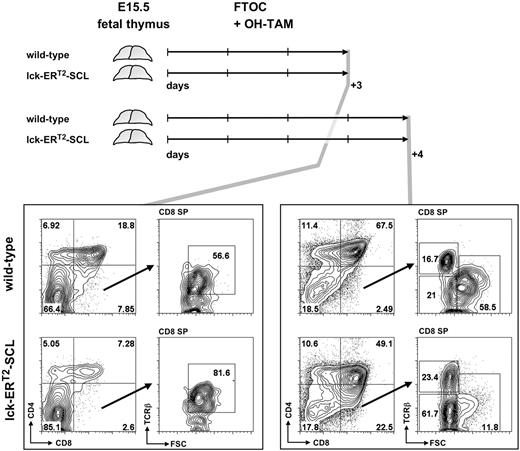
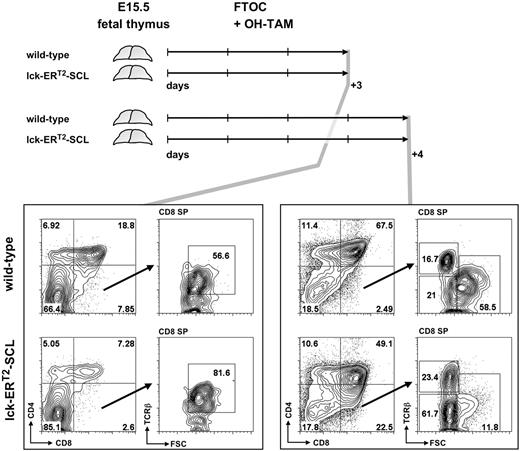
Therefore, we analyzed in vitro cultures of day 15.5 (E15.5) fetal lck-ERT2-SCL and littermate control thymi (cultured in the presence of OH-TAM) on consecutive days to determine whether small CD8+TCRβlow cells appear before or after the first detection of DP thymocytes in culture. If small CD8+TCRβlow cells develop before the first appearance of DP cells, this would imply these cells are either derived from DN thymocytes or are abnormal CD8 ISP cells. If they are detectable after the first appearance of DP thymocytes, this argues for DP thymocytes being the precursor of TAM-SCL CD8+TCRβlow cells. After 3 days of culture, E15.5 fetal lck-ERT2-SCL thymocytes had developed into DP thymocytes (Figure 3). In these OH-TAM–containing lck-ERT2-SCL cultures, large CD8+TCRβlow cells representing CD8 ISP cells were present, however small abnormal CD8+TCRβlow cells were not detectable. In contrast, 24 hours later abnormal CD8+TCRβlow cells were unequivocally identified in lck-ERT2-SCL cultures. In parallel, large CD8+TCRβlow cells representing the CD8 ISP population were evident in both lck-ERT2-SCL and wild-type cultures (Figure 3). Therefore, these data strongly suggest that small CD8+TCRβlow cells of TAM-SCL thymi were DP derived. Thus, we propose a model in which atypical CD8+TCRβlow cells result from abnormal differentiation of DP TCRβlow cells into CD8 SP cells due to the aberrant activation of SCL.
Fetal thymic organ culture revealed the derivation of small CD8+TCRβlow thymocytes from the double-positive CD4+CD8+ stage of T-cell development. Embryonic day–15.5 thymi of lck-ERT2-SCL and wild-type littermate control embryos were cultured for 3 and 4 days in the presence of 100 nM hydroxy-tamoxifen (OH-TAM). Representative plots of 3 independent experiments per group are shown. FTOC indicates fetal thymic organ culture; SP, single-positive; and FSC, forward scatter.
Fetal thymic organ culture revealed the derivation of small CD8+TCRβlow thymocytes from the double-positive CD4+CD8+ stage of T-cell development. Embryonic day–15.5 thymi of lck-ERT2-SCL and wild-type littermate control embryos were cultured for 3 and 4 days in the presence of 100 nM hydroxy-tamoxifen (OH-TAM). Representative plots of 3 independent experiments per group are shown. FTOC indicates fetal thymic organ culture; SP, single-positive; and FSC, forward scatter.
Aberrant SCL activation leads to enhanced survival and decreased proliferation of CD8+TCRβlow thymocytes
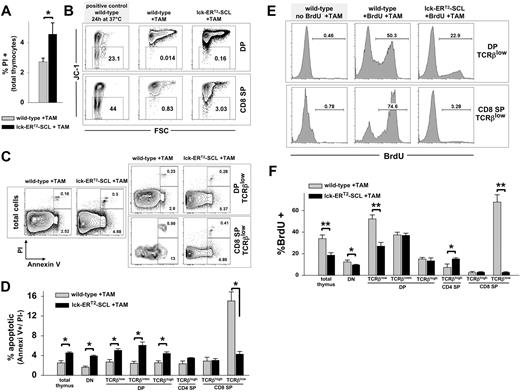
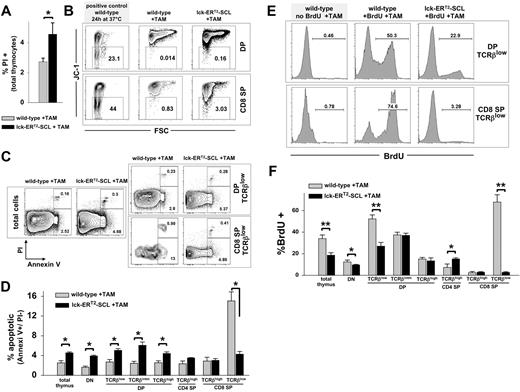
Data regarding apoptosis in constitutive lck-SCL transgenics are conflicting.12,25 For this reason, we carefully examined apoptosis in TAM-SCL thymi. First, we confirmed in preliminary experiments that TAM treatment did not alter survival of wild-type thymocytes (Figure S4). Next, we performed propidium iodide (PI) analysis of TAM-SCL thymi and TAM-treated wild-type control thymi, which revealed an increased thymic death rate conferred by the activation of SCL (Figure 4A). Subsequently, we investigated early apoptosis in TAM-SCL DP and CD8 SP subpopulations with the mitochondrial dye JC-1.30 JC-1 multimerizes in charged mitochondrial membranes and emits a red fluorescence. Early apoptosis is associated with loss of the mitochondrial membrane potential (Δψ) leading to decreased JC-1 red fluorescence. As a positive control for apoptosis, we used wild-type thymocytes, which were incubated in vitro at 37°C for 24 hours. We found that an increased percentage of TAM-SCL DP and SP thymocytes was characterized by a decreased Δψ, indicating these cells had initiated apoptosis (Figure 4B). To analyze apoptosis within DP TCRβlow and CD8+TCRβlow cells, we performed costaining with annexin V and PI (Figure 4C,D). In contrast to TAM-SCL DP TCRβlow cells that displayed increased apoptosis, we observed a decreased apoptotic rate within TAM-SCL CD8+TCRβlow cells (Figure 4C,D). This might explain why CD8+TCRβlow cells prevail in TAM-SCL thymi.
Conditional SCL activation results in decreased apoptosis and decreased cycling of CD8+TCRβlow thymocytes. (A) The proportion of dead thymocytes was examined by propidium iodide (PI) staining. Wild-type, n = 4; lck-ERT2-SCL, n = 4; TAM feed for 12 weeks. Error bars represent means plus or minus SD. (B) Early apoptosis was investigated by the loss of the mitochondrial membrane potential (Δψ), depicted by the loss of JC-1 red fluorescence. The proportion of JC-1–negative (early apoptotic) cells was established within forward and side scatter gated DP (CD4+CD8+, double-positive) and CD8 single-positive (SP) thymocytes. Wild-type, n = 3; lck-ERT2-SCL, n = 3; TAM feed for 11 weeks. (C) The proportion of apoptotic thymocytes (annexin V+/ PI−) was determined within forward and side scatter gated cells. Representative plots of indicated populations are shown. Wild-type, n = 3; lck-ERT2-SCL, n = 3; TAM feed for 7 weeks. (D) Quantification of annexin V/ PI flow cytometric analysis. Bar graphs represent the proportions (± SD) of apoptotic (annexin V+/ PI−) cells within thymic subsets. Error bars represent means plus or minus SD. (E) The proliferation of thymocytes was measured by in vivo BrdU incorporation. Mice (treated with TAM for 5 weeks) were exposed to BrdU for 36 hours before thymus harvest. Representative plots are shown. (F) Quantification of BrdU flow cytometric analysis. Wild-type, n = 4; lck-ERT2-SCL, n = 3; TAM feed for 5 weeks. Bars represent means plus or minus SD; *P < .05; **P < .001. SP indicates single-positive cells.
Conditional SCL activation results in decreased apoptosis and decreased cycling of CD8+TCRβlow thymocytes. (A) The proportion of dead thymocytes was examined by propidium iodide (PI) staining. Wild-type, n = 4; lck-ERT2-SCL, n = 4; TAM feed for 12 weeks. Error bars represent means plus or minus SD. (B) Early apoptosis was investigated by the loss of the mitochondrial membrane potential (Δψ), depicted by the loss of JC-1 red fluorescence. The proportion of JC-1–negative (early apoptotic) cells was established within forward and side scatter gated DP (CD4+CD8+, double-positive) and CD8 single-positive (SP) thymocytes. Wild-type, n = 3; lck-ERT2-SCL, n = 3; TAM feed for 11 weeks. (C) The proportion of apoptotic thymocytes (annexin V+/ PI−) was determined within forward and side scatter gated cells. Representative plots of indicated populations are shown. Wild-type, n = 3; lck-ERT2-SCL, n = 3; TAM feed for 7 weeks. (D) Quantification of annexin V/ PI flow cytometric analysis. Bar graphs represent the proportions (± SD) of apoptotic (annexin V+/ PI−) cells within thymic subsets. Error bars represent means plus or minus SD. (E) The proliferation of thymocytes was measured by in vivo BrdU incorporation. Mice (treated with TAM for 5 weeks) were exposed to BrdU for 36 hours before thymus harvest. Representative plots are shown. (F) Quantification of BrdU flow cytometric analysis. Wild-type, n = 4; lck-ERT2-SCL, n = 3; TAM feed for 5 weeks. Bars represent means plus or minus SD; *P < .05; **P < .001. SP indicates single-positive cells.
Next, we intended to examine whether the small size of TAM-SCL DP TCRβlow and CD8+TCRβlow cells reflected their low proliferative rate. Normal DP TCRβlow cells consist of a sizable proportion of large cycling cells.31 We studied proliferation using the thymidine analog BrdU. Others have shown that after a 24- to 48-hour BrdU exposure, approximately 50% of DP thymocytes had incorporated BrdU in vivo.32 Analogously, we sought to reach an approximately 50% BrdU incorporation rate by exposing TAM-SCL mice and control mice to BrdU for 36 hours. As expected, we found a dramatic decrease of cycling TCRβlow DP thymocytes within TAM-SCL mice. This decrease was restricted to TCRβlow DP thymocytes and was not evident in DP TCRβintm and DP TCRβhigh cells (Figure 4E,F). In concordance with their small size, TAM-SCL CD8+TCRβlow cells were almost not cycling at all. In the 36-hour BrdU exposure period, only 3% of the TAM-SCL CD8+TCRβlow cells entered the cell cycle. In contrast, around 70% of wild-type CD8+TCRβlow cells had proliferated in the 36-hour BrdU exposure period (Figure 4E,F). In conclusion, these data demonstrate that SCL increases apoptosis in all populations except CD8+TCRβlow cells and decreases proliferation of immature thymocytes.
Conditional SCL activation leads to increased NOTCH1 pathway activation in thymocytes
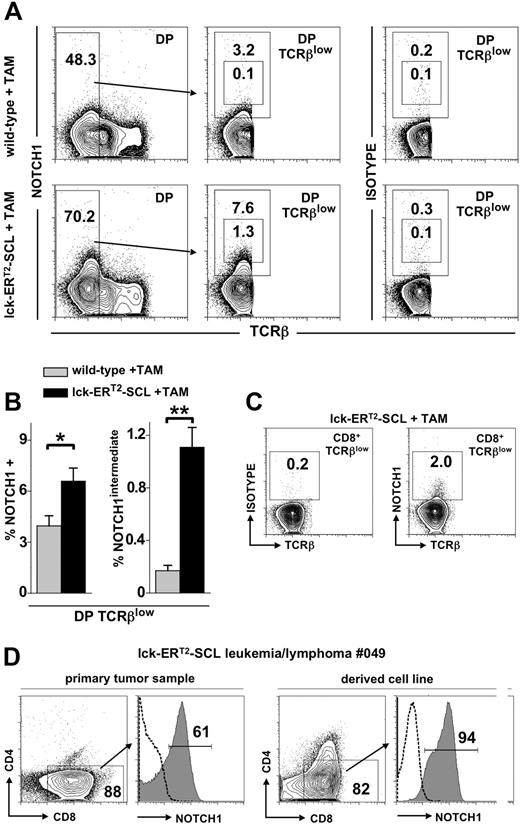
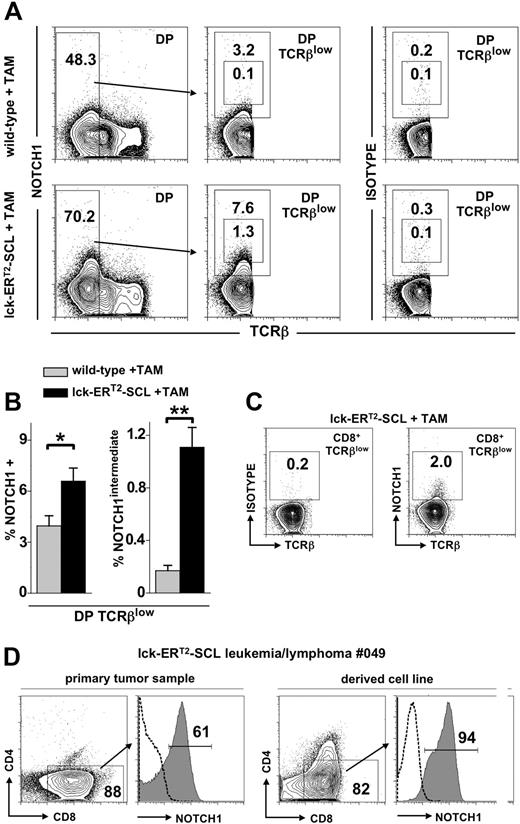
Recently, it was shown that a high proportion of SCL-associated human T-ALL lymphoblasts harbored activating NOTCH1 mutations.18 Furthermore, it was shown that more than 70% of leukemias arising in SCL transgenic mice also possessed NOTCH1 mutations.19,20 It remains unclear at which developmental stage of T-lymphopoiesis NOTCH1 mutations are acquired. We hypothesized that these mutations might be acquired and may function within the abnormal DP and CD8+TCRβlow populations of SCL-perturbed T-cell development described here. A requirement for NOTCH1 mutations to function within these populations would be that NOTCH1 is in fact expressed. Previous studies have demonstrated low level NOTCH1 in normal DP thymocytes.33,34 Therefore, we sought to determine whether TAM-SCL DP TCRβlow and CD8+TCRβlow thymocytes expressed NOTCH1 by flow cytom-etry. Unexpectedly, we found that NOTCH1 expression in wild-type as well as TAM-SCL DPs was restricted to the immature TCRβlow population (Figure 5A). Remarkably, we observed a significant increase of NOTCH1-expressing cells within TAM-SCL DP TCRβlow cells compared with wild-type (Figure 5A,B). Moreover, a population expressing intermediate levels of NOTCH1 (NOTCH1intermediate) was present in TAM-SCL DP TCRβlow cells, which was nearly absent in wild-type controls (Figure 5A,B). Next, we investigated whether abnormal CD8+TCRβlow cells expressed NOTCH1. Indeed, we were able to identify a small subpopulation of cells (1.7% ± 0.2% [mean ± SD], n = 4) expressing NOTCH1 (Figure 5C). Subsequently, we investigated whether NOTCH1 expression of TAM-SCL preleukemic DP TCRβlow cells mirrored NOTCH1 expression levels within TAM-SCL malignant T-cell lymphoblasts. This analysis was carried out with primary TAM-SCL T lymphoblasts and derived cell lines (Table 2). All primary samples and cell lines expressed high levels of NOTCH1 (Figure 5D; Table 2) similar to the NOTCH1intermediate subpopulation of TAM-SCL DP TCRβlow cells. In addition, we also found NOTCH1 mRNA to be overexpressed in cell lines compared with wild-type thymocytes (Table 2). Next, we investigated whether NOTCH1 up-regulation was associated with NOTCH1 mutations and sequenced NOTCH1 HD and PEST domains in the derived cell lines. Only 1 of 3 available cell lines displayed a NOTCH1 mutation (Table 2). Therefore, we concluded that NOTCH1 up-regulation is not necessarily linked to the presence of a NOTCH1 mutation.
Conditional SCL activation leads to increased NOTCH1 expression. (A) Flow cytometric analysis of CD4+CD8+ (double-positive, DP) TCRβlow thymocytes for the expression of NOTCH1 with an antibody (clone mN1A) specific for the intracellular domain of NOTCH1. In addition, analysis with the corresponding IgG1κ isotype control antibody is also shown (right). Mice received tamoxifen (TAM) feed for 6 weeks. (B) Quantification of NOTCH1 expression within DP TCRβlow cells of TAM-treated wild-type (n = 4) and lck-ERT2-SCL (n = 4) mice. The proportion of total NOTCH1- and NOTCH1intermediate-expressing cells was determined and quantified by the gating strategy shown in panel A. *P < .01; **P < .001. (C) Analysis of NOTCH1 expression within the abnormal CD8+TCRβlow population of TAM-treated lck-ERT2-SCL mice. (D) Flow cytometric analysis of a primary lck-ERT2-SCL tumor (after 11 months of TAM treatment) and the corresponding cell line. Cells were stained for CD4, CD8, and NOTCH1. Dashed lines represent isotype control staining. (A,C,D) Numbers on the plots represent precentages of cells.
Conditional SCL activation leads to increased NOTCH1 expression. (A) Flow cytometric analysis of CD4+CD8+ (double-positive, DP) TCRβlow thymocytes for the expression of NOTCH1 with an antibody (clone mN1A) specific for the intracellular domain of NOTCH1. In addition, analysis with the corresponding IgG1κ isotype control antibody is also shown (right). Mice received tamoxifen (TAM) feed for 6 weeks. (B) Quantification of NOTCH1 expression within DP TCRβlow cells of TAM-treated wild-type (n = 4) and lck-ERT2-SCL (n = 4) mice. The proportion of total NOTCH1- and NOTCH1intermediate-expressing cells was determined and quantified by the gating strategy shown in panel A. *P < .01; **P < .001. (C) Analysis of NOTCH1 expression within the abnormal CD8+TCRβlow population of TAM-treated lck-ERT2-SCL mice. (D) Flow cytometric analysis of a primary lck-ERT2-SCL tumor (after 11 months of TAM treatment) and the corresponding cell line. Cells were stained for CD4, CD8, and NOTCH1. Dashed lines represent isotype control staining. (A,C,D) Numbers on the plots represent precentages of cells.
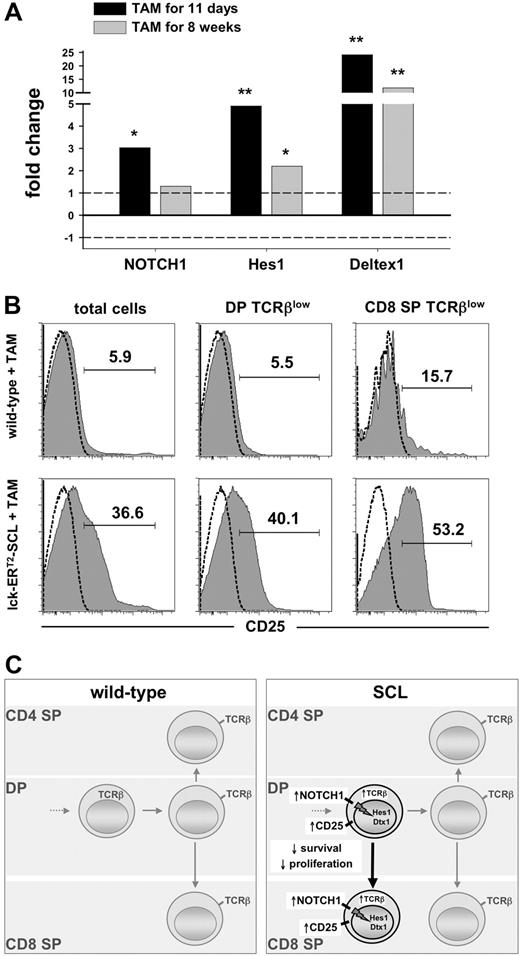
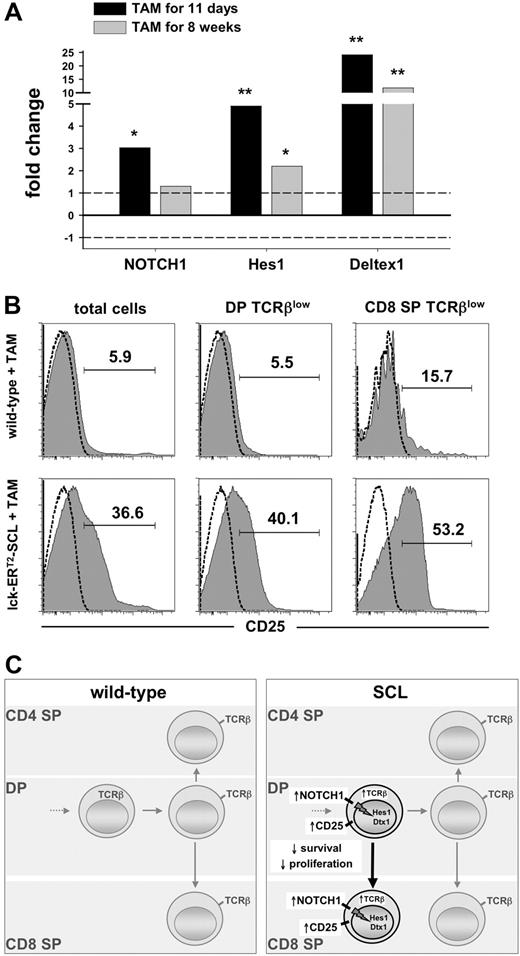
To explore whether the observed preleukemic up-regulation of NOTCH1 results in increased NOTCH1 pathway activation, we studied the expression of the NOTCH1 target genes Hes1 and Deltex1 in preleukemic TAM-SCL thymocytes compared with wild-type controls. We found significantly increased mRNA levels of NOTCH1 and its transcriptional targets Hes1 and Deltex1 in TAM-SCL thymocytes (Figure 6A). Remarkably, the up-regulation of these NOTCH1 targets was already observed after a short-term SCL activation period of 11 days (Figure 6A). Consistent with this, expression of CD25, also a known NOTCH1 target,35,36 was dramatically increased in TAM-SCL thymocytes (Figure 6B). In concordance with early Hes1 and Deltex1 activation, increased CD25 expression was already present 11 days after the initiation of SCL activation (data not shown). These data imply that aberrantly activated SCL can result in NOTCH pathway activation in arising T lymphoblasts irrespective of the presence of secondary genetic events.
Short-term SCL activation induces enhanced NOTCH1 pathway activation. (A) Quantitative real-time PCR analysis of NOTCH1, Hes1, and Deltex1 transcripts from lck-ERT2-SCL (n = 3) mice compared with wild-type control littermates (n = 4); TAM treatment as indicated. Levels of statistical significance (fold change; *P < .05 and **P < .001) are indicated. (B) Analysis of CD25 expression on total thymocytes, DP TCRβlow, and CD8+TCRβlow cells. Wild-type (n = 3) and lck-ERT2-SCL (n = 3) mice were TAM treated for 11 weeks. Representative plots for each group are shown. (C) Proposed model of the effects of conditional SCL activation on T-cell development.
Short-term SCL activation induces enhanced NOTCH1 pathway activation. (A) Quantitative real-time PCR analysis of NOTCH1, Hes1, and Deltex1 transcripts from lck-ERT2-SCL (n = 3) mice compared with wild-type control littermates (n = 4); TAM treatment as indicated. Levels of statistical significance (fold change; *P < .05 and **P < .001) are indicated. (B) Analysis of CD25 expression on total thymocytes, DP TCRβlow, and CD8+TCRβlow cells. Wild-type (n = 3) and lck-ERT2-SCL (n = 3) mice were TAM treated for 11 weeks. Representative plots for each group are shown. (C) Proposed model of the effects of conditional SCL activation on T-cell development.
Discussion
The exact mechanism by which deregulated SCL activation in the thymus causes the development of T-ALL remains unclear. In this study, we generated a conditional model of SCL-induced T leukemogenesis to carry out an analysis of T lymphopoiesis in the preleukemic phase. In particular, we were aiming to define possible abnormal cellular compartments induced by SCL, which potentially might be targets of secondary genetic hits required for the development of overt malignancy. The use of conditional transgenic models allows the analysis of the initiation, progression, and maintenance of malignant diseases.37 Herein, we developed a conditional transgenic model (lck-ERT2-SCL) by creating a fusion protein between SCL and the mutated ligand-binding domain of the human estrogen receptor (ERT2).
Using TAM-SCL transgenic mice, we discovered a previously unrecognized thymic cellular pathway that was initiated and sustained by SCL in the preleukemic phase. Nuclear presence of SCL resulted in the increased intracellular accumulation of the TCRβ chain in immature DP thymocytes reflecting the failure of normal TCRαβ complex expression on the cell surface. This failure might render TAM-SCL DPs unable to progress normally through the upcoming selection and lineage decision process and presumably resulted in the increased apoptosis of these cells. However, SCL instructed surviving cells to develop into abnormal noncycling CD8+TCRβlow cells. We speculate that enhanced NOTCH signaling mediated by SCL might be responsible for driving surviving immature DP cells toward the CD8 SP phenotype.36,38 SCL significantly increased the proportion of NOTCH1-expressing cells within immature DP thymocytes and further induced increased expression of NOTCH1 target genes. These data are indicative of increased NOTCH pathway activation mediated by SCL. In summary these data argue for a cellular pathway in which abnormal immature DP and CD8+TCRβlow cells with activated NOTCH signaling are constantly generated from DN precursors (Figure 6E).
The inability of adequate TCRαβ surface expression in TAM-SCL might be due to the suppression of normal TCRα chain generation by SCL. It has been shown that SCL in combination with LMO1 is capable of inhibiting TCRα rearrangement and expression.6,39 Moreover, it was demonstrated that SCL interferes with the normal function of the TCRα enhancer.40 Therefore, it is likely that the inability of SCL transgenic thymocytes to express an assembled surface TCRαβ complex was due to the lack of functional TCRα chain expression.
We used the sequential analysis of TAM-SCL FTOCs to reveal that DP thymocytes emerged before abnormal CD8+TCRβlow cells. If TAM-SCL CD8+TCRβlow cells represented perturbed CD8 ISP cells, they should have appeared before DP thymocytes in the FTOCs. Therefore, we conclude that abnormal TAM-SCL CD8+TCRβlow cells must be derived from DP thymocytes rather than CD8 ISP cells. Strikingly, this abnormal cellular pathway perfectly explains an observation made by Asnafi et al in human SCL-expressing T-ALL samples.41 This group found that the majority of SCL-associated T-ALL cases presented with a DP or CD8 SP phenotype. CD4 SP T-ALL cases were not observed at all. In agreement with our data, the conclusion by those investigators was that SCL induced T leukemogenesis by inhibiting DP to CD4 rather than inhibiting DN to DP transition. In contrast to most inbred mouse strains, human DN to DP transition progresses via a CD4 ISP rather than a CD8 ISP stage.42 Therefore, the fact that CD4 SP SCL-expressing T-ALLs were not observed argues against the notion that ISP thymocytes are the cellular target of SCL-mediated transformation. Our data show that SCL functions after a completed DN to DP transition and therefore after TCRαβ lineage commitment. Thus, our model also explains why SCL-associated T-ALLs are predominantly restricted to the αβ lineage.
Thymi of TAM-SCL mice commencing SCL activation at 3 weeks of age mirrored the thymic changes previously documented with transgenic mice that constitutively express SCL. There were decreased total cell numbers, decreased numbers of DP and CD4 SP cells and increased numbers of CD8+TCRβlow cells, previously interpreted as CD8 ISPs cells.8,43 Thus, the overt preleukemic phenotype of acquired SCL activation in TAM-SCL mice during established T-cell development was not different from the phenotype observed in transgenic mice that constitutively express SCL. However, the data regarding proliferative potential was not the same. In concordance with the observation that SCL induced decreased thymic cellularity and the emergence of small nonlymphoblastic thymocytes, we observed a decreased proliferative activity of total thymocytes. A similar decrease in proliferation was observed within the predominating DN population of preleukemic SCL/LMO1 double-transgenic thymi.6 In contrast, Shank-Calvo et al observed an 1.7-fold increase of cycling cells in constitutive SCL transgenic thymi.25 A potential explanation would be that the constitutive SCL transgenic thymocytes had already acquired proliferation-promoting genetic events at the time point of analysis. Interestingly, a proportion of TAM-SCL leukemias demonstrated a CD8+TCRβlow surface phenotype (Table 1), supporting the notion that preleukemic CD8+TCRβlow cells are a leukemic precursor population, and with the acquisition of additional mutations may give rise to a malignant clone.
It is known that NOTCH1 is expressed in normal DP thymocytes,33,34 however NOTCH1 expression analysis within DP subsets has so far not been performed. Here, we found that NOTCH1 expression within DPs is confined to the immature TCRβlow subset. We were able to detect that irregular SCL activation was associated with the up-regulation of NOTCH1 within DP TCRβlow thymocytes. This provides a potential link between SCL and NOTCH1 during T-cell leukemogenesis. It has been described that NOTCH1 gain-of-function during T-cell development promotes CD8 and inhibits CD4 SP development.36 Thus, enhanced NOTCH1 function within SCL-transgenic DP TCRβlow thymocytes might be responsible for the development of DPs into CD8 TCRβ cells. Our concept of an enhanced NOTCH1 signal within SCL transgenic DPs provided by the up-regulation of NOTCH1 expression is further supported by increased NOTCH1 target gene activation in TAM-SCL mice. Our observation that the transcriptional NOTCH targets were already up-regulated after a short-term activation period of SCL suggests that the activation of NOTCH signaling is a direct effect of SCL. Whether increased CD25 expression mediates increased IL-2 receptor signaling and might thus be responsible for preventing instant death of immature DP and CD8+TCRβlow cells in TAM-SCL mice remains to be determined. The effect of IL-2 receptor signaling on survival is known to be cellular-context dependent.44,45 Interestingly however, it has been shown that enhanced IL-2 receptor signaling induced by NOTCH3 in thymocytes is capable of inducing aberrant SCL expression itself.46 Therefore, NOTCH and SCL might act by mutual amplification during T-cell leukemogenesis.
The link between SCL and NOTCH1 in T leukemogenesis is further underscored by phenotypic similarities between retroviral NOTCH1 gain-of-function models and TAM-SCL mice. Retroviral NOTCH1 gain-of-function leads to a developmental block at the DP stage, which suggested that NOTCH must be down-regulated in DP thymocytes to allow developmental progression to CD4 and CD8 SP cells.22 Thus, SCL-triggered NOTCH1 up-regulation in DPs might also contribute to the partial developmental block observed at the immature DP stage in TAM-SCL mice. The preleukemic phase of retroviral NOTCH1 gain-of-function models is characterized by accumulating small, noncycling DP thymocytes47 similar to the noncycling DP cells we observed in TAM-SCL mice. Moreover, increased thymocyte apoptosis was observed within DP and CD8 SP subsets of a constitutive NOTCH1 gain-of-function model very similar to our observations in TAM-SCL mice.35
Finally, the lck-ERT2-SCL mouse model will provide a valuable tool to study SCL-associated T-cell leukemogenesis. This model will allow novel experimental approaches to address whether the requirement of SCL is confined to the initiation of T-ALL or whether SCL is also required for the maintenance of the malignant phenotype of T-ALL lymphoblasts.
The online version of this article contains a data supplement.
The publication costs of this article were defrayed in part by page charge payment. Therefore, and solely to indicate this fact, this article is hereby marked “advertisement” in accordance with 18 USC section 1734.
Acknowledgments
This work was supported by grants from the Deutsche Forschungsgemeinschaft (GO 953/1-1 and GO 953/3-1; J.R.G.), and the National Health and Medical Research Council, Australia (303140; D.J.I.).
We thank Kelly Taggart, Tammy Zaknich, Anja Führer, and Stefanie Weber for excellent technical assistance. We thank Ludger Klein-Hitpass for helping us with the real-time PCR analysis. We are grateful to Pierre Chambon and Roger Perlmutter for providing the plasmid pCreERT2 and p1017, respectively.
Authorship
Contribution: J.R.G, R.L.B., C.G.B., and D.J.I. designed research; J.R.G, R.L.B., M.S., and D.J.I. performed research; J.R.G., R.L.B., M.S., U.D., C.G.B., and D.J.I. analyzed and interpreted data; J.R.G. and D.J.I. drafted the paper.
Conflict-of-interest disclosure: R.L.B. and C.G.B. are currently employees and shareholders of Amgen. All other authors declare no competing financial interests.
Correspondence: Joachim R. Göthert, Department of Hematology, University Hospital of Essen, Hufelandstrasse 55, 45122 Essen, Germany; e-mail:joachim.goethert@uni-due.de.

