Abstract
Megakaryocytes and erythroid cells are thought to derive from a common progenitor during hematopoietic differentiation. Although a number of transcriptional regulators are important for this process, they do not explain the bipotential result. We now show by gain- and loss-of-function studies that erythroid Krüppel-like factor (EKLF), a transcription factor whose role in erythroid gene regulation is well established, plays an unexpected directive role in the megakaryocyte lineage. EKLF inhibits the formation of megakaryocytes while at the same time stimulating erythroid differentiation. Quantitative examination of expression during hematopoiesis shows that, unlike genes whose presence is required for establishment of both lineages, EKLF is uniquely down-regulated in megakaryocytes after formation of the megakaryocyte-erythroid progenitor. Expression profiling and molecular analyses support these observations and suggest that megakaryocytic inhibition is achieved, at least in part, by EKLF repression of Fli-1 message levels.
Introduction
Hematopoiesis is the process by which a self-renewing population of stem cells provide a continuous replenishment of differentiated blood cells by generating progeny with sequentially altered gene expression patterns.1-3 Identification of these cells has relied on selective enrichment by cell-surface markers combined with culture and in vivo cellular assays that enable detection of cells at specific stages of differentiation. Although stem cells are multipotent, individual steps of subsequent differentiative decisions are performed by a series of simpler, even bipotential, decisions whereby one cell type gives rise to 2 or 3 descendants of differing character.4 This has led to a commonly accepted pattern of parent and progeny relations,2 although variations of it have recently been suggested5 (but see Forsberg et al6 )
A large number of genetic, cellular, and gene expression studies point to the critical importance of cytokine pathways7 and expression patterns of transcription factors1,8-10 for establishing and maintaining steady state numbers of lymphoid, myeloid, and erythroid cells that, at the same time, can respond quickly to changes in the organismal environment and increase or decrease the cellularity of specific blood cell types.
The megakaryocyte and erythrocyte lineages are proposed to derive from a common precursor, the megakaryocyte-erythroid progenitor (MEP)4,11,12 (reviewed in Pang et al13 ). Strikingly, these 2 lineages share a number of commonalities with respect to transcription factors that are absolutely required (eg, GATA1,14,15 FOG1,16 SCL,17,18 Gfi-1b19 ). At the same time, the protein partners that form with these factors as differentiation proceeds can be significantly different between lineages.20 However, because these factors are all positively required for both lineages, we are still left with an incomplete picture of how these lineages are differentially established during hematopoiesis.13
Erythroid Krüppel-like factor (EKLF; KLF121 ) is a zinc finger transcription factor that plays a critical role in erythroid gene expression, with adult β-globin being a particularly well-studied target for activation.22,23 EKLF is highly restricted in its expression pattern to hematopoietic organs such as the yolk sac, fetal liver, adult bone marrow, and the red pulp of the spleen.21,24 Recent studies have expanded its activation target repertoire to protein-stabilizing, heme biosynthetic pathway, and red cell membrane proteins.25-27 However, along with other cellular28 and molecular studies,29,30 they also suggest that there are genes that are repressed by EKLF.
EKLF's role is absolutely critical for the erythroid lineage, as supported by gene ablation studies, of which the most obvious effect is a profound β-thalassemia that leads to lethality in murine embryos at the time of the switch to adult β-globin expression.31,32 Enigmatically, however, EKLF is also expressed in multipotential hematopoietic cell lines and in cultured primary hematopoietic cells.33,34 As a result, we sought to determine by both gain- and loss-of-function approaches whether EKLF might be playing a heretofore undiscovered role in hematopoietic lineage decisions. Most unexpectedly, we find that, unlike its cohorts within the erythroid lineage that are also required for megakaryocyte development, EKLF plays a negative role and points to its expression level playing a part in megakaryocyte lineage commitment while remaining critical for erythroid maturation.
Materials and methods
Embryonic stem-cell and embryoid body differentiation
Full-length Flag-tagged EKLF cDNA was inserted into a modified plox vector35 to generate ploxEKLF/IRES GFP. Ainv18 embryonic stem (ES) cells were targeted with ploxEKLF/IRES GFP by coelectroporation of ploxEKLF/IRES GFP and a Cre recombinase expression plasmid followed by selection in G418 to generate the inducible cell line, tetO-EKLF-GFP. Culture of tetO-EKLF-GFP after removal from feeder cells and embryoid body (EB) differentiation precisely followed established protocols.36
Megakaryocyte cultures
The tetO-EKLF-GFP ES cell line was differentiated to day 6 as EBs before disaggregation and plating on irradiated OP9 feeder cells as described.37 OP9 cultures also included 10 to 20 ng/mL thrombopoietin. Doxycycline (0.25-1 μg/mL) was added as required when indicated. Fresh media was added every 3 days for extended cultures (up to 17 days). Liquid cultures from E13.5 fetal livers from wild-type or EKLF-null mice was performed as described.38 Megakaryocyte colony assays used the Megacult system as described by the manufacturer (Stem Cell Technologies, Vancouver, BC). Colony formation was assessed after growth for 7 days followed by dehydration and fixation in acetone. The fixed slides were probed after rehydration as described in Li et al39 with 1B5 antibody to CD41/CD61 (GPIIbIIIa; kind gift of Barry Coller) that had been conjugated with Alexa488 as recommended by the manufacturer (Molecular Probes, Eugene, OR). Brightfield photographs were taken with a Zeiss Axioplan 2 (Carl Zeiss, Jena, Germany) fitted with 40×/0.75 or 100×/1.30 oil objectives and a Q-imaging MP3.3 camera with QED capture software. Fluorescent photographs were taken with a Nikon TS100 (Melville, NY) fitted with a 4×/0.13 objective and a Spot RT color camera with Spot 4.0.9 software (Diagnostic Instruments, Sterling Heights, MI). Images were assembled in Photoshop (CS) 8.0 (Adobe Systems, San Jose, CA). In addition, megakaryocyte colony assays used fetal liver cells enriched by lineage-depletion or CMP selection as described.40
FACS analysis, western blot, cytology, quantitative PCR, microarray, apoptosis, transactivation assay, and chromatin immunoprecipitation methods are described in Document S1, available on the Blood website via the Supplemental Materials link at the top of the online article.
Results
EKLF is normally down-regulated during megakaryocyte differentiation
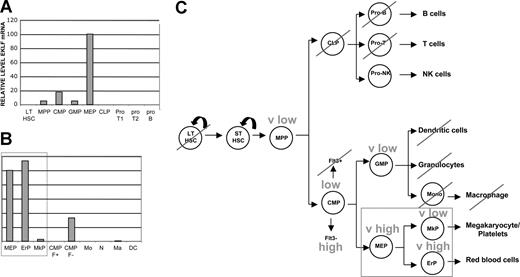
As hematopoietic EKLF expression had been previously monitored only in tissue culture33 and a limited population of primary34 cells, we wanted to obtain a more precise idea of EKLF expression patterns during hematopoiesis. We used well-established criteria for isolation of specific subpopulations of cells emanating from long-term hematopoietic stem cells (defined as the c-Kit+, Thy1.1lo, Lin−, Sca1+, Flt3− population41 ). Quantitative reverse transcription–polymerase chain reaction (RT-PCR) analysis performed on cell-surface marker–sorted samples (Table S1) shows that EKLF is expressed at barely detectable levels in hematopoietic stem cells and multipotent progenitors (Figure 1A). A clear difference in expression subsequently becomes established, with EKLF absent in common lymphoid progenitors and their B- and T-cell progeny, yet increased in the common myeloid progenitor (CMP). At this point there is another clear demarcation in expression within the CMP progeny, because EKLF levels become 5-fold higher in the megakaryocyte/erythroid progenitor (MEP) but decline further in the GMP. EKLF expression within the GMP does not develop any further, because neither monocytes, macrophage, nor dendritic cells express it (Figure 1B). EKLF expression is also much higher in the Flt3− than in the Flt3+ population. These data show that there is a gradual restriction in expression of EKLF as hematopoiesis proceeds, ending with high levels within the MEP population (Figure 1C).
EKLF expression during hematopoietic cell differentiation. Cell populations were sorted as detailed in Table S1 and monitored for EKLF expression by quantitative RT-PCR. Two experiments are shown (A,B) and the results summarized (C; pathway based on Weissman et al2 ). Each sample was monitored in triplicate; values were normalized in each experiment to the EKLF level in megakaryocyte/erythroid progenitors (MEPs) which was set to 100. LT-HSC indicates long-term hematopoietic stem cell; MPP, multipotent progenitor; CMP, common myeloid/erythroid progenitor; GMP, granulocyte/macrophage progenitor; MEP, megakaryocyte/erythroid progenitor; CLP, common lymphoid progenitor; ProT1 and ProT2, T-cell progenitor; proB, B-cell progenitor; EP, erythroid progenitor; MkP, megakaryocyte progenitor; CMP F+, myeloid and B-cell progenitor; CMP F−, myeloid/erythroid progenitor; Mo, monocytes; N, neutrophile granulocytes; Ma, bone marrow derived macrophages; DC, dendritic cells.
EKLF expression during hematopoietic cell differentiation. Cell populations were sorted as detailed in Table S1 and monitored for EKLF expression by quantitative RT-PCR. Two experiments are shown (A,B) and the results summarized (C; pathway based on Weissman et al2 ). Each sample was monitored in triplicate; values were normalized in each experiment to the EKLF level in megakaryocyte/erythroid progenitors (MEPs) which was set to 100. LT-HSC indicates long-term hematopoietic stem cell; MPP, multipotent progenitor; CMP, common myeloid/erythroid progenitor; GMP, granulocyte/macrophage progenitor; MEP, megakaryocyte/erythroid progenitor; CLP, common lymphoid progenitor; ProT1 and ProT2, T-cell progenitor; proB, B-cell progenitor; EP, erythroid progenitor; MkP, megakaryocyte progenitor; CMP F+, myeloid and B-cell progenitor; CMP F−, myeloid/erythroid progenitor; Mo, monocytes; N, neutrophile granulocytes; Ma, bone marrow derived macrophages; DC, dendritic cells.
Of particular interest, however, the bipotential differentiation of MEPs leads to a dramatic difference in EKLF expression, with erythroid progenitors exhibiting an 80-fold greater level of expression compared with megakaryocyte progenitors (Figure 1B). This demarcates EKLF as having significantly different properties from GATA1, FOG, Gfi1b, and SCL, transcription factors whose presence are required for both erythroid and megakaryocytic expansion and differentiation.14-19 These data show that EKLF is normally down-regulated as MEPs differentiate down the megakaryocytic lineage.
EKLF expression negatively affects the megakaryocyte lineage but stimulates erythroid differentiation
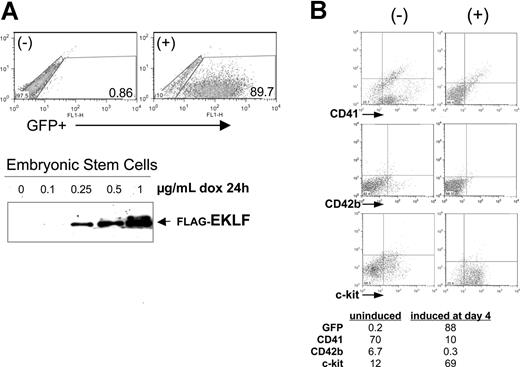
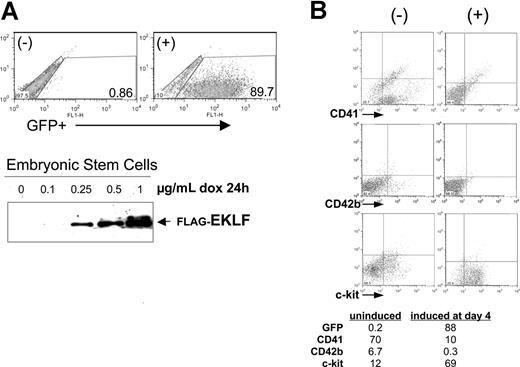
Given the expression pattern of EKLF in hematopoietic cells, we investigated the effects of its misregulation on the normal hematopoietic progression, beginning with gain-of-function studies. To do this we took advantage of the embryoid body (EB) differentiation system, in particular the doxycycline-inducible plasmids and embryonic stem cell lines we had previously used to induce chimeric proteins as desired during differentiation.35,42 For the present experiments, we cloned the complete EKLF cDNA downstream of the tetO promoter in the pLox-GFP plasmid. Cotransfection with a CRE plasmid into the Ainv ES cell line results in single-copy, unidirectional insertion of the plasmid into a single site after selection in neomycin. Treatment of this tetO-EKLF-GFP stable ES cell line with doxycycline results in dose-dependent expression of EKLF and GFP (Figure 2A)42 . A control cell line, containing tetO-GFP without EKLF, was established in the same way.
EKLF induction negatively affects megakaryocyte formation during embryoid body (EB) differentiation. (A) Doxycycline treatment of a stable embryonic stem (ES) cell line that contains single-copy, integrated tetO-EKLF-GFP results in robust expression of GFP and EKLF within 24 hours. GFP was monitored by FACS, EKLF was monitored by anti-FLAG Western blot analysis of extracts. Representative results are shown. (B) EKLF was induced in differentiating EBs by treatment with doxycycline at day 4 and harvested at day 8. Representative FACS analyses are shown for hematopoietic progenitor (c-Kit), progenitor/megakaryocyte (CD41), and megakaryocyte (CD42b) markers. All gates were drawn based on negative controls for each sample (not shown). The table (percentages) is a subset of a more extensive analysis summarized as Table S2.
EKLF induction negatively affects megakaryocyte formation during embryoid body (EB) differentiation. (A) Doxycycline treatment of a stable embryonic stem (ES) cell line that contains single-copy, integrated tetO-EKLF-GFP results in robust expression of GFP and EKLF within 24 hours. GFP was monitored by FACS, EKLF was monitored by anti-FLAG Western blot analysis of extracts. Representative results are shown. (B) EKLF was induced in differentiating EBs by treatment with doxycycline at day 4 and harvested at day 8. Representative FACS analyses are shown for hematopoietic progenitor (c-Kit), progenitor/megakaryocyte (CD41), and megakaryocyte (CD42b) markers. All gates were drawn based on negative controls for each sample (not shown). The table (percentages) is a subset of a more extensive analysis summarized as Table S2.
We used this system and induced EKLF in differentiating EBs at day 4, which is the normal onset of endogenous EKLF expression,43 and we harvested each of these treated cells at day 8. The data in Figure 2B show that, as with ES cells, the EBs also exhibit little leakiness, because GFP levels remain extremely low in the absence of induction. In addition, doxycycline treatment leads to robust induction of GFP-expressing cells in the differentiating EBs. We monitored the effects of EKLF induction on hematopoietic cell populations by fluorescence-activated cell sorting (FACS) analysis of selected cell-surface proteins. Of note is the decrease in CD41 (7-fold) after EKLF induction, which could arise from a specific effect on megakaryocytic cells or from a general negative effect on primitive and definitive precursor formation. The increase in c-Kit (6-fold) makes it less likely to be the latter, particularly because c-Kit and CD41 are coexpressed in primitive and definitive hematopoietic progenitors.44-46 However, the concomitant decrease in CD42b (20-fold), a marker exclusively expressed in megakaryocytes, is most consistent with an effect on megakaryopoiesis. An issue that might have been anticipated, given EKLF's antiproliferative properties,28 was that all hematopoietic markers would decrease on EKLF induction. However, the increase in c-Kit shows that EKLF induction does not generally down-regulate hematopoietic cell gene expression. This is further supported by additional experiments showing that Gr1 (a myeloid/granulocyte marker) is also increased and by the minimal changes seen in CD71 expression after EKLF induction (Table S2). Finally, the number of cells per EB and the level of apoptosis (not shown) are unaffected by doxycycline treatment. Similar results are obtained when the analysis is performed at day 9, or induction is performed at day 3 and analyzed at day 8 or 9 (Table S2). Doxycycline treatment of the control cell line does not have a significant effect on expression levels of these markers (Table S2).
To investigate the effect on megakaryopoiesis more precisely, we used a variation of the OP9 cell system that enables ES cells to differentiate toward specific lineages.37 After a preliminary EB formation step to increase hematopoietic progenitors (Deborah French and Gordon Keller, unpublished, April 2005),47 lineage generation is guided by the presence of selected cytokines after disaggregation of EBs and replating onto OP9 stromal cells, which are macrophage colony-stimulating factor (M-CSF) deficient and serve as feeder cells. In the present case, we used our tetO-EKLF-GFP stable ES cell line and differentiated them into EBs for 6 days before plating onto the OP9 cells in the presence of thrombopoietin (TPO) to direct the expansion of megakaryocytic cells.37 Typically, platelets are observed at day 10 after the start of ES cell differentiation, such that more than 70% of the cultured cells express megakaryocytic markers by day 12 (not shown). Doxycycline treatment (0.5 μg/mL) of OP9-growing cells showed that GFP+ cells were highly induced within 24 hours, remained high (90%) at 48 hours before a slight decrease by 4 days (50%).
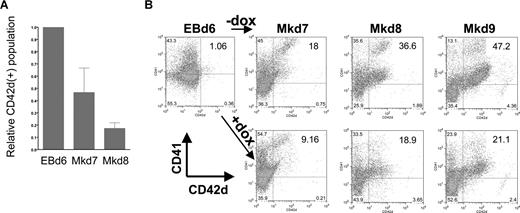
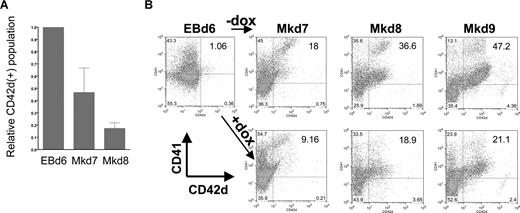
We used this system to investigate the specific effects of EKLF induction on different stages of megakaryocyte production. In all cases, EBs were formed for 6 days before plating on OP9 cells. However, we varied the time of addition of doxycycline: at day 4 during the early stages of EB formation, at day 6 when hematopoietic progenitors are enriched in the EB, or at day 8 or 12 after megakaryopoiesis had already begun. Cells were monitored every day after plating on OP9. Addition of doxycycline at day 4 or 8 has no effect on the shape or numbers of cells compared with the control (untreated) cell population (Figure S1). However, a dramatic effect of doxycycline addition at day 6 was clear from visual inspection of the cells, because the cells do not form colonies of large megakaryocytes but remained small, floating, and rounded (Figure S1). This is even more apparent by performing a kinetic analysis of megakaryocyte formation after day 6 by following double-positive CD41/CD42d cell-surface expression as indicative of mature megakaryocyte formation. Because CD41 is expressed not only in megakaryocytes but also in other hematopoietic progenitors, we additionally used CD42d expression as a megakaryocyte-specific marker and compared the percentage of positive cells between uninduced and induced cultures (Figure 3). In a typical assay, CD42d+ cells, present at a level of 1.5% at day 6, expand to 11% of the population 24 hours later at day 7 and to greater than 40% by day 9. However, in the doxycycline/EKLF-induced cultures, CD42d+ cells accumulate to 4% after 24 hours (equivalent to day 7) and only reach 15% by 72 hours (equivalent to day 9) of culture. Additional data indicate that the doxycycline treatment had no effect on cell viability at any time point (as measured by trypan blue exclusion) and that the total cell numbers are similar in all cultures (data not shown). Consistent with the morphologic observations, doxycycline treatment at day 8 has little or no effect on the levels of CD42d+ cells compared with controls when harvested 1, 2, or 3 days later (not shown). These data show that EKLF has a negative effect on megakaryopoiesis. But more precisely, the OP9 studies suggest that EKLF action can only occur within a limited time frame during this process, later than day 4 but earlier than day 8. This immediately suggests that EKLF action plays a role in early, rather than late, megakaryocytic differentiative decisions.
Megakaryocyte markers are inhibited during EB differentiation on OP9 cells after EKLF induction. (A) CD41 and CD42d expression was monitored by FACS in day 6 EBs or at 24 (Mkd7), 48 (Mkd8), or 72 hours (Mkd9) after placement on OP9 cells with thrombopoietin (TPO) with or without doxycycline. (B) All gates were drawn based on negative controls for each sample (not shown). Numbers within the FACS indicate the percentage of CD42d+ cells in each population. Data in panel A are presented as the ratio of induced to uninduced CD42d+ levels from 7 independent experiments after subtracting negative controls for each sample using the Overton cumulative histogram subtraction algorithm48 (thus the pretreated EBd6 ratio is one). Error bars are SD.
Megakaryocyte markers are inhibited during EB differentiation on OP9 cells after EKLF induction. (A) CD41 and CD42d expression was monitored by FACS in day 6 EBs or at 24 (Mkd7), 48 (Mkd8), or 72 hours (Mkd9) after placement on OP9 cells with thrombopoietin (TPO) with or without doxycycline. (B) All gates were drawn based on negative controls for each sample (not shown). Numbers within the FACS indicate the percentage of CD42d+ cells in each population. Data in panel A are presented as the ratio of induced to uninduced CD42d+ levels from 7 independent experiments after subtracting negative controls for each sample using the Overton cumulative histogram subtraction algorithm48 (thus the pretreated EBd6 ratio is one). Error bars are SD.
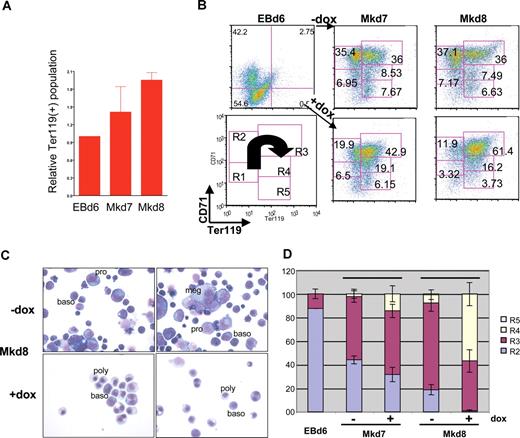
Additional FACS analyses also show that, under conditions in which doxycycline treatment leads to lower levels of CD42d, levels of Ter119 (as a marker of the most mature erythroid cells) are dramatically higher compared with the untreated samples (Figure 4A), causing a shift from the R2 into the more mature R3/R4 populations as judged by CD71 and Ter119 expression patterns (Figure 4B).49 The timing of EKLF induction remains important, because its erythroid effect is attenuated if treatment is performed on day 8, when EKLF induction has no effect on megakaryocyte cell levels (not shown). Morphologic assessment of these cultures verifies that megakaryocyte formation is inhibited and that erythroid differentiation patterns are altered, because doxycycline induction of EKLF leads to a precocious level of more differentiated erythroid cells that are already apparent after 24 hours (day 7 of culture) but most striking after 48 hours (day 8 of culture; Figure 4C). The uninduced erythroid population contains mostly proerythroblasts and basophilic erythroblasts (88%); conversely, the induced cultures contain high levels of basophilic and polychromatophilic erythroblasts (84%) and exhibit shifts in the R2-R4 patterns (Figure 4D). These data show that EKLF plays a negative role in megakaryopoiesis yet promotes terminal erythroid differentiation.
EKLF induction affects erythroid differentiation. FACS (A,B) and morphologic (C,D) assessment of cells derived from day 6 EBs or at 24 (Mkd7) or 48 (Mkd8) hours after placement on OP9 cells with thrombopoietin (TPO) with or without doxycycline. Data in panel A ares presented as the ratio of induced to uninduced Ter119+ levels from 4 independent experiments after subtracting negative controls for each sample using the Overton cumulative histogram subtraction algorithm48 (thus the pretreated EBd6 ratio is one). Representative FACS data of CD71 and Ter119 in panel B are boxed according to R1-R5 categories of progressive erythroid maturation as described in Zhang et al49 and schematized in the lower left panel, with the arrow showing the FACS pattern for differentiation as it proceeds from least to most mature. Numbers in each box indicate the percentage of cells within each category. Proerythroblasts (pro), basophilic erythroblasts (baso), polychromatophilic erythroblasts (poly), and megakaryocytes (meg) are indicated in panel C (May-Grunwald/giemsa stain). The frequency of megakaryocytic cells in the Mkd8 samples (C,D) was 29% (± 6%) in the absence of induction compared with 7% (± 1%) in the induced sample based on counts from 2 fields of 100 cells each from 2 independent experiments. Morphologic criteria for R2-R5 (D) were as described.50 Error bars in panels A and D are SD.
EKLF induction affects erythroid differentiation. FACS (A,B) and morphologic (C,D) assessment of cells derived from day 6 EBs or at 24 (Mkd7) or 48 (Mkd8) hours after placement on OP9 cells with thrombopoietin (TPO) with or without doxycycline. Data in panel A ares presented as the ratio of induced to uninduced Ter119+ levels from 4 independent experiments after subtracting negative controls for each sample using the Overton cumulative histogram subtraction algorithm48 (thus the pretreated EBd6 ratio is one). Representative FACS data of CD71 and Ter119 in panel B are boxed according to R1-R5 categories of progressive erythroid maturation as described in Zhang et al49 and schematized in the lower left panel, with the arrow showing the FACS pattern for differentiation as it proceeds from least to most mature. Numbers in each box indicate the percentage of cells within each category. Proerythroblasts (pro), basophilic erythroblasts (baso), polychromatophilic erythroblasts (poly), and megakaryocytes (meg) are indicated in panel C (May-Grunwald/giemsa stain). The frequency of megakaryocytic cells in the Mkd8 samples (C,D) was 29% (± 6%) in the absence of induction compared with 7% (± 1%) in the induced sample based on counts from 2 fields of 100 cells each from 2 independent experiments. Morphologic criteria for R2-R5 (D) were as described.50 Error bars in panels A and D are SD.
Loss of EKLF leads to expansion of megakaryocytes
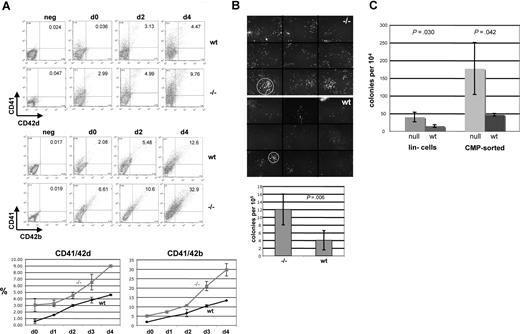
One prediction from the in vivo expression pattern and the gain-of-function studies is that the converse will occur; that is, loss of EKLF expression will lead to an increase in megakaryocyte expansion. We tested this idea by culturing E13.5 fetal liver cells from wild-type and EKLF-null embryos in the presence of TPO and monitored levels of megakaryocyte expression. Morphologic examination (not shown) shows that day 4 cultures derived from the EKLF-null fetal livers contain a greater number of megakaryocytes (17%) than those derived from wild-type cells (6%). We defined this more precisely by monitoring CD41, CD42d, and CD42b expression by FACS analysis (Figure 5A). Even before incubation, CD41/42b and CD41/42d double-positive cells are greater in the EKLF-null cells; this becomes significantly more evident after liquid incubation, when the CD41/42b population is more than 2-fold higher in the day 4 cultures from the EKLF-null cells than from the wild-type cells. In addition, the EKLF-null cells appear to be expanding more rapidly than the wild-type cells after day 2.
EKLF-null fetal liver cells yield a greater expansion of megakaryocytes. (A) E13.5 fetal liver cells from wild-type (wt) or EKLF-null (−/−) embryos were monitored for levels of CD41, CD42b, and CD42d as indicated before (d0) or after (d1-4) incubation in TPO. A representative FACS is shown (top) along with a graph of 3 additional experiments. Values are shown for double-positive cells. All gates were drawn based on negative controls for each sample (not shown). Fetal liver cell numbers are within 10% between wild-type and null embryos. Numbers on plots are numbers of cells in that rectangle. (B) E13.5 fetal liver cells were monitored for megakaryocyte colony formation in MegaCult slides. Colony formation was visualized by Alexa 288–labeled 1B5 antibody. Typical colonies are shown on top, which is a composite of 9 different areas (separated by horizontal and vertical lines) that covers approximately 56% of the slide; circles demarcate the typical difference in wild-type (wt) versus EKLF-null (−/−) colony size. Below is a graph of data from 5 experiments. (C) E13.5 fetal liver cells from wild-type (wt) or EKLF-null (null) were lineage-depleted (lin−) or CMP-sorted and monitored for megakaryocyte colony formation. The graph is an average of 3 experiments. Error bars represent SD. P-values are from t-tests.
EKLF-null fetal liver cells yield a greater expansion of megakaryocytes. (A) E13.5 fetal liver cells from wild-type (wt) or EKLF-null (−/−) embryos were monitored for levels of CD41, CD42b, and CD42d as indicated before (d0) or after (d1-4) incubation in TPO. A representative FACS is shown (top) along with a graph of 3 additional experiments. Values are shown for double-positive cells. All gates were drawn based on negative controls for each sample (not shown). Fetal liver cell numbers are within 10% between wild-type and null embryos. Numbers on plots are numbers of cells in that rectangle. (B) E13.5 fetal liver cells were monitored for megakaryocyte colony formation in MegaCult slides. Colony formation was visualized by Alexa 288–labeled 1B5 antibody. Typical colonies are shown on top, which is a composite of 9 different areas (separated by horizontal and vertical lines) that covers approximately 56% of the slide; circles demarcate the typical difference in wild-type (wt) versus EKLF-null (−/−) colony size. Below is a graph of data from 5 experiments. (C) E13.5 fetal liver cells from wild-type (wt) or EKLF-null (null) were lineage-depleted (lin−) or CMP-sorted and monitored for megakaryocyte colony formation. The graph is an average of 3 experiments. Error bars represent SD. P-values are from t-tests.
To understand whether the greater numbers of megakaryocytes in the EKLF-null cultures have resulted (at least in part) from an increased presence of megakaryocyte precursors in the fetal liver, we assayed megakaryocyte colony formation in Megacult collagen cultures. Although such colonies are relatively dispersed, this assay enables a more accurate means than methylcellulose to determine their presence. We used the 1B5 monoclonal antibody (directed against megakaryocyte CD41/CD61 complex [GPIIbIIIa]51 ) to stain these colonies and to provide an unambiguous determination of their presence. Two things are readily apparent from these studies (Figure 5B). First, a 3-fold greater number of colonies result from the EKLF-null cultures relative to wild-type cells; second, the colonies from the null cells are more expanded in size and number of cells compared with the relatively compact colonies derived from the wild-type cells. These larger proliferating colonies are similar to that seen in Megacult cultures derived from GATA1s variant-expressing fetal liver cells.39
Fetal liver cellularity was carefully monitored and was within 10%, comparing E13.5 wild-type with EKLF-null fetal livers, making it unlikely that the increase in megakaryocyte cell numbers is an indirect result from (for example) loss of erythroid cells in the total population. However, to further clarify this point, we compared megakaryocyte colony formation in sorted populations. As seen by others,4,40 we did not obtain efficient megakaryocyte colony formation from E13.5 fetal liver MEPs even though formation of other myeloid colonies was fine; however, because the CMP population gave robust numbers of megakaryocyte colonies, we used these as our source of enriched progenitor cells for comparison. We find that the frequency of megakaryocyte colony formation is up to 4-fold greater within enriched lin-depleted or CMP-sorted hematopoietic progenitor subpopulations when isolated from EKLF-null fetal liver cells compared with wild-type cells (Figure 5C). In total, the studies in Figure 5 show that, in contrast to its overexpression, EKLF loss-of-function leads to a dramatic expansion of megakaryocyte colonies and cells in either unsorted and sorted E13.5 fetal liver populations. Differentiated Ter119+ cells (R3-R549 ) do not accumulate in the absence of EKLF (Andre Pilon, P.G.G., and David Bodine, manuscript in preparation), concurring with the notion that EKLF is required for full erythroid maturation. Together with the gain-of-function studies, these results suggest that EKLF levels play a role in 2 lineages during hematopoiesis, with its presence stimulating erythroid terminal differentiation while inhibiting megakaryocyte expansion.
EKLF negatively regulates Fli1 expression
To gain a molecular understanding of how EKLF might be causing a repressive effect on megakaryopoiesis, we comparatively analyzed expression arrays between EKLF wild-type and EKLF-null fetal liver cells, particularly focusing on genes that may be important for megakaryocyte differentiation. Inspection of the data immediately showed a number of genes fitting this criterion that are up-regulated at least 2-fold in the absence of EKLF (Table 1). This was not due to a general effect, because not all megakaryocyte genes are affected (eg, c-mpl, PBP, RANTES, and ENA78). However, of particular interest for the present studies is Fli1, an ETS-related transcription factor that is critical for megakaryocyte differentiation,52-54 and EKLF-Fli1 interactions have been noted.55 As a result, its down-regulation in the presence of EKLF could provide a molecular framework for the cellular effects that we have observed.
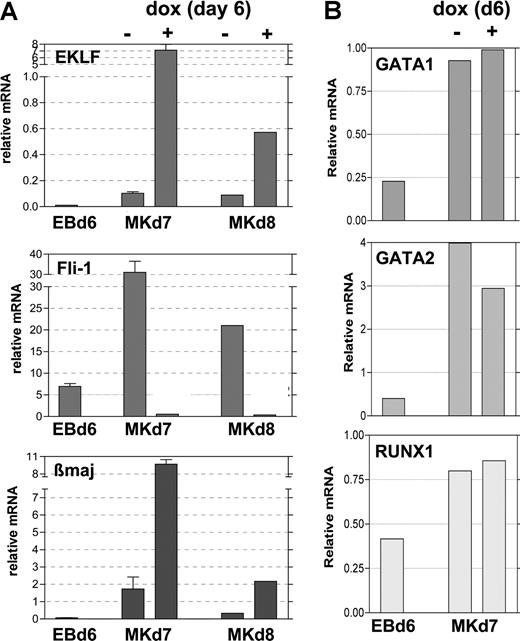
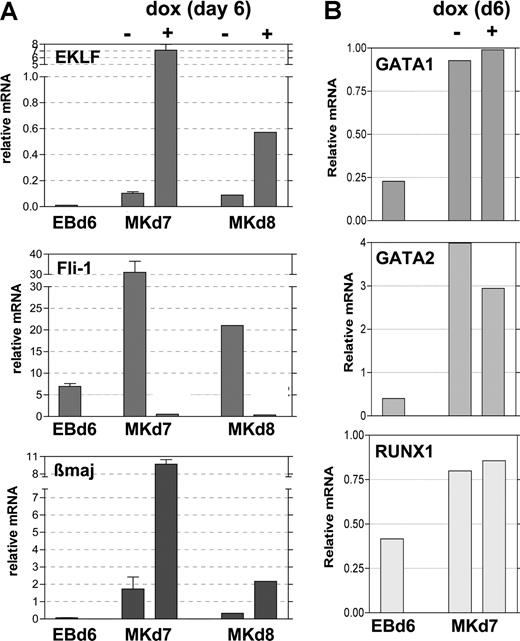
To better determine the timing of Fli1 repression after EKLF induction, we returned to our doxycycline-induced EB/OP9 cell system and performed quantitative analysis of RNA expressed under various conditions. The addition of 0.5 μg/mL doxycycline at day 6 stimulates EKLF expression within 24 hours (by day 7) to substantially higher levels than that seen in the absence of inducer and, although attenuated, remains so at day 8 (Figure 6A). Concomitant with this, at day 7 the Fli1 mRNA levels are dramatically lower in the EKLF-induced samples than in the uninduced samples and remain lower at day 8. As expected from the known ability of EKLF to stimulate β-globin expression, β maj mRNA levels are significantly increased when EKLF is induced in these samples. The same results are observed when 1 μg/mL doxycycline is used to induce EKLF (not shown). Other hematopoietic genes such as Runx1, GATA1, and GATA2 are unaffected by EKLF induction (Figure 6B). These data show that EKLF expression levels are critical for differentiative decisions, because EKLF causes divergent effects on specific target gene expression. The cellular and molecular data strongly suggest that EKLF expression leads to inhibition of megakaryocyte differentiation (by repressing Fli1) and expansion of erythroid differentiation (as monitored by increased β maj expression).
Expression of selected genes after EKLF induction during EB differentiation. Day 6 EBs (EBd6) were untreated (−) or treated (+) with doxycycline for 24 (Mkd7) or 48 (Mkd8) hours during growth on OP9 cells in TPO as in Figure 3. Total RNA was isolated from each, and the same sample was monitored for expression of EKLF, Fli-1, and β maj (A) or GATA1, GATA2, and RUNX1 (B). Expression normalized to levels of GAPDH is graphed; all analyses were performed in triplicate, and panel A was from 2 independent experiments. Error bars represent SD.
Expression of selected genes after EKLF induction during EB differentiation. Day 6 EBs (EBd6) were untreated (−) or treated (+) with doxycycline for 24 (Mkd7) or 48 (Mkd8) hours during growth on OP9 cells in TPO as in Figure 3. Total RNA was isolated from each, and the same sample was monitored for expression of EKLF, Fli-1, and β maj (A) or GATA1, GATA2, and RUNX1 (B). Expression normalized to levels of GAPDH is graphed; all analyses were performed in triplicate, and panel A was from 2 independent experiments. Error bars represent SD.
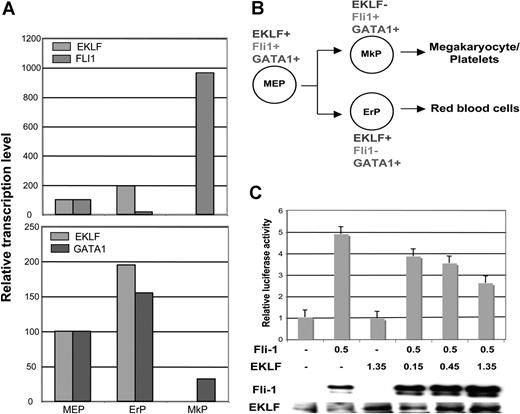
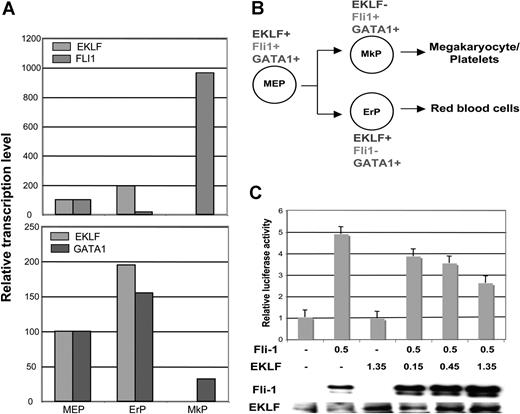
These results compelled us to revisit our sorted cell populations (from Figure 1). We find that, although commonly expressed with EKLF in the MEP, the subsequent normal expression pattern of Fli1 is opposite to that of EKLF; that is, the bipotential differentiation of MEPs leads to an almost 60-fold greater level of expression in megakaryocyte progenitors compared with erythroid (Figure 7A,B). Interestingly, GATA1 levels vary less than 3-fold in all populations.
EKLF, Fli1, and GATA1 expression during MEP differentiation and repression of Fli1 by EKLF. Cell populations were sorted as detailed in Table S1 and monitored for EKLF, Fli1, and GATA1 expression by quantitative RT-PCR. Each sample was monitored in triplicate; values were normalized to the expression level in MEPs which was set to 100. (A) Relative levels are directly compared between EKLF and Fli1 (top) or EKLF and GATA1 (bottom). (B) Summary of the common and divergent expression patterns during bipotential differentiation from the MEP. Abbreviations are as in Table S1. (C) K562 cells were cotransfected with the pFli1 + i-Luc reporter plasmid and the indicated amounts (in μg) of Fli1 and EKLF expression plasmids. The graph displays the effects of increasing quantities of transfected EKLF plasmid on the reporter luciferase activity after normalization for transfection efficiency. Levels are expressed relative to that seen with reporter alone (given a value of 1). In the panel below, nuclear cell extracts from the transfected cells were tested for the presence of Fli1 or EKLF protein by Western blotting. Error bars represent SD.
EKLF, Fli1, and GATA1 expression during MEP differentiation and repression of Fli1 by EKLF. Cell populations were sorted as detailed in Table S1 and monitored for EKLF, Fli1, and GATA1 expression by quantitative RT-PCR. Each sample was monitored in triplicate; values were normalized to the expression level in MEPs which was set to 100. (A) Relative levels are directly compared between EKLF and Fli1 (top) or EKLF and GATA1 (bottom). (B) Summary of the common and divergent expression patterns during bipotential differentiation from the MEP. Abbreviations are as in Table S1. (C) K562 cells were cotransfected with the pFli1 + i-Luc reporter plasmid and the indicated amounts (in μg) of Fli1 and EKLF expression plasmids. The graph displays the effects of increasing quantities of transfected EKLF plasmid on the reporter luciferase activity after normalization for transfection efficiency. Levels are expressed relative to that seen with reporter alone (given a value of 1). In the panel below, nuclear cell extracts from the transfected cells were tested for the presence of Fli1 or EKLF protein by Western blotting. Error bars represent SD.
To garner evidence that EKLF might play a direct role in Fli1 expression, we performed transient cotransfection assays with a Fli1 promoter construct linked to a luciferase promoter in the erythro-megakaryoblastic leukemia K562 cell line.56 Activity of this construct in the absence of a phorbol ester inducer depends on exogenous Fli1. We find there is a dose-dependent repression of the activated promoter by EKLF (Figure 7C). Although this does not distinguish direct (EKLF binding to the promoter as a repressor) or indirect (EKLF protein interacting with Fli1 and preventing its activity) modes of regulation, it is consistent with the idea that EKLF can negatively alter Fli1 promoter activity.
Discussion
Our studies suggest that EKLF plays 2 roles in hematopoiesis by repressing the onset of megakaryopoiesis and promoting gene expression in the erythroid lineage. This unexpected property distinguishes it from other commonly expressed transcription factors that play critical positive roles for both the megakaryocyte and erythroid lineages and is directly relevant to issues of bipotential mechanisms of differentiation. Knowledge of EKLF molecular mechanisms of action raises intriguing models of how EKLF may be affecting these consequences.
Hematopoietic bipotential lineage decision mechanisms share common features with those made during early stages of development. Select transcription factors can effectively tip the balance in these decisions. In hematopoiesis, the myeloid/megakaryocyte-erythroid pathway exemplifies one well-studied paradigm whose outcome relies on the cross-antagonism between PU.1 and GATA1, an idea originally suggested by gain-of-function studies (reviewed in Graf8 and Laiosa et al57 ). The molecular mechanism relies on the ability of each protein to decrease each other's activity by protein-protein interactions that result in down-regulation of their normal activation targets. Positive autoregulation then reinforces the initial outcome. Theoretical modeling suggests that, in addition to cross-inhibition of the opposing factor's activity and autoregulation, repression of the opposing factor's message levels solidifies the resultant differentiation program within the progeny of the original bipotent cell.58 In the present case, the first step suggesting that such a mechanism is in place is that EKLF expression has a significant repressive effect on endogenous Fli1 expression, a critical megakaryocytic activator. Second, transient assays have shown that Fli1 can inhibit EKLF-dependent transcription of the β-globin gene in cotransfected mouse erythroleukemic (MEL) cells, and EKLF can inhibit Fli1-dependent transcription of the megakaryocyte GPIX gene in cotransfected COS cells55 and of the Fli1 promoter (present data). Third, these proteins can physically interact in vitro55 and thus may negatively affect each other's transcriptional activity. Together, these observations raise the intriguing possibility that the cross-antagonistic paradigm observed in other cases8-10,57 may also be operant here, although the individual players and subsequent consequences are different. Consistent with the biology, Fli1 interactions with GATA1 yield a dramatically different effect, because they synergistically activate megakaryocytic genes.55,59
These models directly imply that expression levels of the regulators must be properly down- or up-regulated to correctly orchestrate such decisions.60 Indeed, in the present case it is the mis-expression of EKLF that suggests a role for it in the MEP, a postulate supported by the opposite effects seen after EKLF ablation. Consistent with the molecular antagonism model, EKLF misexpression represses Fli1 message levels, and its removal leads to an increase of Fli1 message. A study designed to monitor the effects of EKLF overexpression on β-globin in transgenic mice found, as a side effect, that circulating platelet levels were negatively affected.61 The complementary prediction is that Fli1 levels should similarly affect EKLF expression. Although EKLF levels were not directly assessed, analysis of cultured erythroid cells from Fli1-disrupted mice contained primarily polychromatophilic and orthochromatophilic cells and lower numbers of proerythroblasts and basophilic cells,52,54 similar to the effect seen after EKLF overexpression in the present studies. Conversely, Fli1 overexpression inhibits erythroid differentiation.62,63 As a result, an antagonistic genetic regulatory network between EKLF and Fli1 within the MEP can be postulated.64
The present studies not only show that EKLF plays a negative role in megakaryopoiesis but also a positive role in promoting erythroid differentiation as judged by morphologic changes and cell-surface protein (Ter119) and target gene (β maj) expression patterns. Because these are relatively late events in the erythroid differentiation program, it is difficult to tell whether EKLF also plays a directive role in earlier events that establish the lineage. However, EKLF must be playing a role early in megakaryopoietic decisions, given the critical window of its effect and its modulation of a crucial early megakaryocyte gene target. Consistent with this is the increase in megakaryocyte colony formation observed in its absence.
One recent study provides evidence that c-myb may also be playing a similar role to EKLF in MEP lineage decisions. A fortuitous genetic disruption of an upstream enhancer by transgene insertion resulted in a hypomorphic level of c-myb expression that led to an increase in megakaryocytes and a decrease in erythroid cells,65 a result foreshadowed by an earlier knockdown study.66
Known molecular properties of EKLF suggest at least 2 ways in which it could affect these bipotential decisions as an activator or as a repressor. One is by changes in EKLF protein partners. EKLF has been primarily characterized as a transcriptional activator, particularly at the adult β-globin locus and in the erythroid cell environment, where EKLF interacts with coactivators such as P300/CBP.67 However, EKLF also exhibits transcriptional repression properties in vivo. It achieves this by interaction with corepressors such as Sin3a and HDAC129 and possibly others (Miroslawa Siatecka and J.J.B., manuscript submitted; April 2007), suggesting one molecular means by which EKLF can repress megakaryocytic promoters such as Fli1 and others that appeared in the microarray analysis. The results of anti-EKLF chromatin immunoprecipitation using total cells from EBs differentiated at day 6 as source material (selected based on our present characterization and on their minimal manipulation) suggest that EKLF may be bound to the Fli1 promoter (Figure S2). A phylogenetic comparison points to a small number of conserved potential EKLF DNA binding elements within the tested regions that may be playing a role (P.F. and J.J.B., unpublished observations; July 2006). However, it is difficult to ascertain the relevance of CACCC elements to repression, because their functional basis arose from studies directed at EKLF transactivation,22,23 and in any case not all putative elements are used in vivo.68 However, a more fundamental and complex problem is that repression by EKLF occurs in the absence of DNA binding.30 At this point our evidence does not yet favor a direct (DNA) or indirect (protein) model for EKLF repression of Fli1.
The second way for EKLF activity to be altered follows from its post-translational modifications. Phosphorylation of T41 and acetylation of K288 are required for optimal transactivation activity.69,70 Acetylation of K288 in particular leads to increased association of EKLF with chromatin remodeling complexes in vitro,70 which lead to open chromatin and transcription of the adult β-globin promoter in vitro71 and in vivo.72 However, EKLF acetylation may also play a role in its repressive properties, because K302, which is the other EKLF acetylation site,70 is critical for EKLF interaction with Sin3a.30 In other concurrent studies we have recently discovered that EKLF is sumoylated at a single lysine, thus adding to the possible post-translational modifications that may be involved in its regulation (Miroslawa Siatecka and J.J.B., manuscript submitted; April 2007). Of particular interest, we find that the sumoylation state of EKLF has an effect on megakaryopoiesis; that is, mutated EKLF that is sumo-deficient is less inhibitory toward megakaryocyte development than is wild-type EKLF. EKLF modification status and the identity of its protein partners are thus linked and may be directly relevant to any directive EKLF role in bipotential decisions from the MEP. This can be the result of subtle changes in the cellular environment; for example, EKLF protein partners and its repression versus activation function in an erythroid cell can be altered within 48 hours by simply changing the cytokine mix that leads to primitive or definitive erythropoiesis.30
An Inside Blood analysis of this article appears at the front of this issue.
The online version of this article contains a data supplement.
The publication costs of this article were defrayed in part by page charge payment. Therefore, and solely to indicate this fact, this article is hereby marked “advertisement” in accordance with 18 USC section 1734.
Acknowledgments
We thank Hans Snoeck, Debbie French, Gordon Keller, Miriam Merad, and Saghi Ghaffari for advice on various aspects of the project and Michael Kyba, Beau Mitchell, Barry Coller, and Fabrice Soncin for reagents. We thank Paresh Vyas, Catherine Porcher, Mira Kassouf, Yan-Ping Guo, and Ann Atzberger for their guidance on sorting and colony assays. We thank Dave Bodine and Andre Pilon for supplying EKLF-null fetal liver cells. We thank members of the Bieker laboratory for ongoing support and discussion, particularly Mirka Siatecka for detailed comments on the manuscript, and Xue Li for help with mice and cell sorting.
These studies were supported by grants from the Public Health Service PHS grant K08 DK02871 (D.M.), grants R01 DK46865 and DK48721 (J.J.B.), and grant R01 HL65448 (P.G.G.). The Flow Cytometry Shared Research Facility is supported by Mount Sinai School of Medicine.
Authorship
Contribution: P.F., D.M., and J.J.B. were actively involved in the conceptual design and direction of the experiments as the project unfolded; D.M. and M.G. constructed the clone and established the inducible EKLF ES cell line; P.F. performed the experiments in Figures 2A, 3, 4A,B, 6, 7C, and Figure S1; D.M. performed the experiments in Figures 2A,B, 4C,D, 5C and in Table S2; M.G. performed the experiments in Figures 2A,B and Figures 5A,B, and in Table S2; H.K. performed the experiments in Figures 1 and 7A,B and in Table S1; F.L. in performed the experiment in Figure S2; P.G.G. performed the experiment in Table 1; J.J.B. established the collaborations with H.K. and P.G.G., and wrote the paper with input from P.F. and D.M. This project was initiated based on observations made by D.M.
P.F. and D.M. contributed equally to this study.
Conflict-of-interest disclosure: The authors declare no competing financial interests.
Correspondence: James J. Bieker, Mount Sinai School of Medicine, Brookdale Department of Molecular, Cell and Developmental Biology, Box 1020, One Gustave L Levy Pl, New York, NY 10029; e-mail: james.bieker@mssm.edu.

