Abstract
Dendritic cells (DCs) process and present bacterial and endogenous lipid antigens in complex with CD1 molecules to T cells and invariant natural killer T (NKT) cells. However, different types of DCs, such as blood myeloid DCs and skin Langerhans cells, exhibit distinct patterns of CD1a, CD1b, CD1c, and CD1d expression. The regulation of such differences is incompletely understood. Here, we initially observed that monocyte-derived DCs cultured in an immunoglobulin-rich milieu expressed CD1d but not CD1a, CD1b, and CD1c, whereas DCs cultured in the presence of low levels of immunoglobulins had an opposite CD1 profile. Based on this, we tested the possibility that immunoglobulins play a central role in determining these differences. IgG depletion and intravenous immunoglobulin (IVIg) add-in experiments strongly supported a role for IgG in directing the CD1 expression profile. Blocking experiments indicated that this effect was mediated by FcγRIIa (CD32a), and quantitative polymerase chain reaction data demonstrated that regulation of the CD1 profile occurred at the gene expression level. Finally, the ability of DCs to activate CD1-restricted NKT cells and T cells was determined by this regulatory effect of IgG. Our data demonstrate an important role for FcγRIIa in regulating the CD1 antigen presentation machinery of human DCs.
Introduction
The presentation of protein and lipid antigens to T cells requires specialized antigen-presenting molecules. Lipid and glycolipid antigens are presented in the context of CD1 molecules, a conserved protein family that is distantly related to MHC class I molecules and requires β2-microglobulin for cell surface expression and recognition by T cells and natural killer T (NKT) cells.1,2 CD1 proteins are divided into 3 groups: group I contains CD1a, CD1b, and CD1c; group II, CD1d; and group III, CD1e.3 Groups I and II CD1 isoforms present exogenous and endogenous lipids to CD1-restricted T cells, whereas CD1e is exclusively found intracellularly and plays a role in processing and transfer of lipids to other CD1 proteins.4,5 Expression of group I CD1 proteins is confined mainly to professional antigen-presenting cells such as dendritic cells (DCs) and B cells, whereas CD1d is also present on monocytes, macrophages, and certain nonhematopoietic cells.6 B cells and nonhematopoietic cells appear to have a constitutive expression of CD1 molecules,7-9 whereas the CD1 expression on myeloid cells is regulated in a more complex manner.10-12
T cells that recognize lipid and glycolipid antigens can be broadly divided into 2 groups: T cells with diverse T-cell receptors (TCRs) recognizing structurally diverse self- and foreign antigens presented by group I CD1 molecules and T cells restricted to CD1d-presented antigens. The main population of CD1d-restricted cells is the NKT cells, which express an invariant and conserved αβ T-cell receptor and the NK cell marker CD161, and can rapidly produce large quantities of immunoregulatory cytokines such as interleukin-4 (IL-4) and interferon-γ.13,14
DCs reside in peripheral sites such as skin, mucosa, and blood, where they capture antigen that they process and present in complex with MHC or CD1 molecules to T cells.15 Most DC subsets appear to display a similar distribution and regulation of MHC molecules. CD1 molecules, however, are not equally distributed on all subsets of human DCs. While CD1a has been used as a unique marker for Langerhans cells (LCs) in the skin,16 myeloid DCs in blood are often isolated based on their CD1c expression.17 This suggests that expression of CD1 molecules on DCs may be regulated by signals in the microenvironment.
Immunoglobulins have been proposed to influence DC differentiation and function. Studies on patients with common variable immunodeficiency (CVID), a heterogeneous disorder associated with low serum immunoglobulin concentrations,18 suggest that their DCs are defective and that this, at least in part, is due to the low levels of serum antibodies.19-21 Treatment with intravenous immunoglobulin (IVIg) to increase immunoglobulin levels has been beneficial in preventing infections in CVID patients, although the exact mechanism of IVIg treatment is not completely understood.22 It has recently been suggested that the clinical effect of IVIg treatment in autoimmune disease involves the interaction of IVIg with activating Fcγ receptors on DCs.23 Fc receptors bind immunoglobulins, and Fc receptor signaling is known to affect DC maturation.24
Here, we studied the expression and regulation of CD1 molecules in human DCs and in particular the potential influence by immunoglobulins. We found that IgG acts via the activating Fcγ receptor FcγRIIa (CD32a) to regulate the CD1 expression profile in DCs, and thus which lipid antigens the DCs are able to present. We speculate that this mechanism is involved in determining which CD1 antigen presentation pathways are activated locally within tissues to activate antimicrobial T-cell responses or immunoregulatory NKT cell responses in the local microenvironment.
Methods
Media, cytokines, sera, and supplements
RPMI 1640 was supplemented with 1% HEPES, 2 mM l-glutamine, 1% streptomycin and penicillin (Invitrogen, Carlsbad, CA) and referred to as medium. The medium was further supplemented with IL-4 (6.5 ng/mL; R&D Systems, Minneapolis, MN) and granulocyte-macrophage colony-stimulating factor (GM-CSF, 250 ng/mL; Peprotech, Rocky Hill, NJ) for differentiation of monocyte-derived DCs, as well as either 10% fetal calf serum (FCS; Invitrogen) or 5% human adult serum (AS; Cambrex, East Rutherford, NJ). For isolation and culture of LCs, the medium was supplemented with 10% FCS, 1% fungizone, and GM-CSF (2 ng/mL). In some experiments, human intravenous immunoglobulins (IVIgs, Gamimune; Bayer, Tarrytown, NY), human IgG (Chemicon, Temecula, CA), human IgG Fc fragments (Chemicon), or γ-globulin free bovine serum albumin (BSA; Sigma-Aldrich, St Louis, MO) was added to the cultures.
Samples
This study was performed on heparinized blood samples from healthy blood donors. Skin samples were obtained from surgical breast reductions. The protocols were approved by the local ethics committee at Karolinska Institutet and informed consent was obtained from all study subjects in accordance with the Declaration of Helsinki.
Primary dendritic cells
LCs were isolated from skin tissue as previously described,25 with some modifications. Fresh skin samples were cut into pieces and incubated in Dispase (2.4 U/mL; Invitrogen) for 1.5 hours at 37°C. The epidermis was separated from the dermis, washed, and incubated at 37°C for 2 to 3 days to allow LCs to migrate out. Cell supernatants were collected and filtered through a 100-μm cell strainer, and LCs were identified as large cells with high expression of HLA-DR using flow cytometry. Myeloid dendritic cells (MDCs) in blood were analyzed in peripheral blood mononuclear cells (PBMCs) by flow cytometry and identified based on their size, lack of lineage markers (CD3, CD8, CD14, CD16, CD19, and CD56), and coexpression of CD11c and HLA-DR.
In vitro differentiation and culture of dendritic cells
CD14+ monocytes were enriched from PBMCs using RosetteSep human monocyte enrichment (StemCell Technologies, Vancouver, BC), as described earlier.26 To obtain immature DCs, monocytes were cultured for 6 days in medium with IL-4 and GM-CSF and either 10% FCS or 5% AS. Media were replenished at day 3. In some experiments, FCS-based cultures were further supplemented with IVIg, human IgG, human IgG Fc fragments, or γ-globulin free BSA. Since the IVIg was dissolved in glycine, a control was added were monocytes were cultured in 0.2 M glycine (Sigma-Aldrich). To mimic the effect of complexed IgG, human IgG was immobilized on plastic plates. For that, IgG was added to 24-well plates at different concentrations and incubated overnight in the cold. Before adding monocytes, the wells were washed 4 times with PBS. To determine the ability of DCs to respond to TLR stimulation, immature DCs (106 cells/mL) were stimulated with 100 ng/mL LPS (Sigma-Aldrich) for 16 hours. Maturation of the DCs was assessed by up-regulation of CD83 surface expression. To determine the T-cell stimulatory capacity of DCs cultured in AS or FCS, a mixed lymphocyte assay was performed.
IgG depletion in human adult serum
AS was diluted 10 times in RPMI and passed over a protein G-Sepharose column (Amersham Biosciences, Arlington Heights, IL) twice to allow binding of IgG to the column. The reduction of IgG was verified by dot blot analysis using alkaline phosphatase (AP)–conjugated anti–human IgG antibody and AP substrate (Sigma-Aldrich).
Blocking of Fcγ receptors
To block FcγRs, monocytes were preincubated for 2 hours at 37°C with anti–human CD16 (clone 3G8; BioLegend, San Diego, CA), anti–human CD32a (clone IV.3; StemCell Technologies), anti–human CD32b (clone ch2B6N279Q; MacroGenics, Rockville, MD), or anti–human CD64 (clone 10.1; eBioscience, San Diego, CA) blocking antibodies. Control cells were preincubated with IgG1 and IgG2b isotype controls (clones MOPC-21 and MPC-11; BioLegend) or left untreated. After preincubation, monocytes were cultured in the presence of 2 μg/mL blocking antibody in culture medium containing IL-4, GM-CSF, and 10% FCS or 10% FCS and 0.5 mg/mL IVIg. Culture medium was replenished at day 3; cells were phenotyped by flow cytometry after 6 days of culture.
Flow cytometry
Expression of surface markers was assessed by 4-color flow cytometry using the following antibodies: CD1a (HI149), CD1b (M-T101), CD1d (CD1d42), CD3 (SK7), CD4 (SK3), CD8 (SK1), CD14 (MΦP9), CD16 (3G8), CD19 (SJ25C1), CD56 (B159), CD83 (HB15e), HLA-A2 (BB7.2), HLA-DR (L243), and IFNγ (25723.11) from BD Biosciences (San Jose, CA); CD1a (NA1/34) and CD14 (TüK4) from DAKO (Glostrup, Denmark); CD1c (AD5-8E7; Miltenyi Biotec, Auburn, CA); CD32a (IV.3) from StemCell Technologies; Vα24 (C15) and Vβ11 (C21) from Immunotech (Miami, FL); and DC-SIGN (eB-h209; eBioscience). Human-mouse chimeric anti–human FcγRIIb antibody (ch2B6N297Q) was a kind gift of MacroGenics (Rockville, MD). Flow cytometry data were acquired on a FACSCalibur (Becton Dickinson, Lincoln Park, NJ) instrument, and data analyzed using FlowJo software (TreeStar, Ashland, OR).
Real-time PCR analysis
Total RNA from DCs cultured in the presence of 10% FCS, 5% AS, or 10% FCS supplemented with 0.5 mg/mL IVIg was isolated using the RNeasy Mini Kit (Qiagen, Valencia, CA), and subjected to reverse transcription (QuantiTect Reverse Transcription Kit; Qiagen). The relative CD1 mRNA expression was analyzed by real-time polymerase chain reaction (PCR) using a SYBR Green/ROX qPCR Master Mix Kit (SuperArray) in the 7500 Real Time PCR System (Applied Biosystems, Foster City, CA). The sequences of CD1 primer pairs were described before,27 and PCR conditions were 40 cycles of 95°C denaturation and 60°C annealing and extension. CD1 mRNA levels were determined by the comparative Ct method relative to the housekeeping gene GAPDH.
NKT cell lines
CD1d-restricted NKT cell lines were generated by expanding Vα24+ NKT cells from PBMCs by culture in media supplemented with 5% AS, 10 ng/mL human rIL-2 (Peprotech), and 100 ng/mL α-galactosylceramide (αGalCer). After 10 to 14 days, Vα24+ cells were positively selected using a biotinylated mouse anti–human Vα24 antibody (Immunotech), followed by streptavidin magnetic-activated cell sorting (MACS) beads (Miltenyi Biotec), and applied onto MACS columns. Isolated cells were stimulated with irradiated monocytes pulsed with α-GalCer in the presence of IL-2. Cells were restimulated every second week, and purity of Vα24+ NKT cells was analyzed by surface staining with Vα24 and Vβ11 antibodies and flow cytometry.
Activation of CD1-restricted T cells
Activation of T-cell lines LDN5 and CD8–1 restricted to CD1b and CD1c, respectively, and the CD1a-restricted T-cell receptor transfectant CD8-2 was measured by IL-2 release using the HT-2 bioassay as described.28 Briefly, 5 × 10⁴ T cells were incubated in 96-well plates with antigen and 5 × 10⁴ irradiated (50 Gy) DCs generated in the presence of either 10% FCS or 5% AS in triplicates. After 24 hours, coculture supernatants were transferred to 104 IL-2–dependent HT-2 cells, which were further cultured for 24 hours before adding 1 μCi (0.037 MBq) [3H] thymidine for an additional 6 to 24 hours of culture, followed by harvesting and counting β emissions. To assay the ability of DCs to activate CD1d-restricted NKT cells, 105 immature DCs, generated in either 10% FCS or 5% AS, were cultured in 96-well plates and preincubated with αGalCer for 2 hours at 37°C before adding 105 NKT cells. After 6 hours of coculture in the presence of brefeldin A (1 μL/mL, GolgiPlug; BD Biosciences), activation of NKT cells was measured by intracellular staining for IFNγ and analyzed by flow cytometry.29
Statistical analysis
Statistical significance was assessed by paired t test or signed rank test with Graph Pad Prism software (San Diego, CA), and was considered significant at P less than .05.
Results
Monocyte-derived dendritic cells cultured in different sera express distinct CD1 profiles
Despite their common feature as professional antigen-presenting cells, DCs are heterogeneous and display distinct phenotypes in different anatomic locations. One example is their expression of the lipid antigen-presenting CD1 molecules. We found that MDCs circulating in blood expressed CD1c and CD1d but no or very low levels of CD1a and CD1b (Figure 1A and data not shown). In contrast, LCs in the epidermis expressed CD1a, low levels of CD1c, but no CD1b (Figure 1A and data not shown). A majority of the skin donors analyzed displayed no CD1d expression in their epidermal LCs (Figure 1A).
The CD1 profile of monocyte-derived dendritic cells is influenced by the type of serum they are cultured in. The expression of CD1a and CD1d was determined on blood myeloid DCs (MDCs) and Langerhans cells (LCs) in the epidermis of skin. MDCs were identified in PBMCs by gating on size, followed by a gate on cells negative for lineage markers (CD3, CD8, CD14, CD16, CD19, and CD56). CD11c+ HLA-DR+ MDCs were subsequently identified among the lineage-negative cells, and the CD1a and CD1d profile of MDCs was displayed. To assess the CD1 profile of LCs, cells were allowed to migrate out from epidermis sheets of skin biopsies for 2 to 3 days. The cells were subsequently analyzed by flow cytometry, and LCs were identified by size and high expression of HLA-DR and their expression of CD1a and CD1d was determined. The histograms show 1 representative donor of 10 for MDCs (black) and 1 of 4 for LCs (dotted) (A). The expression of CD1 molecules was determined on monocyte-derived DCs cultured in human adult serum (AS) or fetal calf serum (FCS) and IL-4 and GM-CSF for 6 days to allow differentiation of DCs from monocytes. The mean fluorescence intensity (MFI) of CD1a, CD1b, CD1c, and CD1d on DCs cultured in AS ( ) or FCS (
 ) from 18 donors was measured (B). Average CD1 expression is depicted by a line in the graphs. The statistical difference between the CD1 expression on DCs grown in AS and FCS was determined by paired t test. DCs cultured in AS and FCS obtained a similar overall phenotype with respect to expression of MHC class II (HLA-DR), MHC class I (HLA-A2), and DC-SIGN, as well as their lack of CD14 expression as determined by flow cytometry (C). The numbers on the plots are the percentages of dendritic cells that fall within each rectangle. The graphs show data from 1 representative donor of 6. Immature DCs grown in either AS or FCS were irradiated (30 Gy) and cocultured with allogeneic CD3+ T cells at a ratio 1:10 for 2, 4, and 6 days, and T-cell proliferation was determined by incorporation of 3H-thymidine (1 μCi [0.037 MBq]/well for 6 hours) and presented as counts per minute (cpm) (D). The graph shows the average proliferation plus or minus standard deviation of triplicates from 1 of 2 donors. To assess the ability of the DCs to mature, both DCs cultured in AS and FCS were exposed to 100 ng/mL LPS for 16 hours and the expression of CD83 was determined by flow cytometry (E). Histograms show unstained DCs (filled), unstimulated DCs (dashed), and LPS-stimulated DCs (solid) on DCs grown in either AS or FCS. One representative experiment of 6 is shown.
The CD1 profile of monocyte-derived dendritic cells is influenced by the type of serum they are cultured in. The expression of CD1a and CD1d was determined on blood myeloid DCs (MDCs) and Langerhans cells (LCs) in the epidermis of skin. MDCs were identified in PBMCs by gating on size, followed by a gate on cells negative for lineage markers (CD3, CD8, CD14, CD16, CD19, and CD56). CD11c+ HLA-DR+ MDCs were subsequently identified among the lineage-negative cells, and the CD1a and CD1d profile of MDCs was displayed. To assess the CD1 profile of LCs, cells were allowed to migrate out from epidermis sheets of skin biopsies for 2 to 3 days. The cells were subsequently analyzed by flow cytometry, and LCs were identified by size and high expression of HLA-DR and their expression of CD1a and CD1d was determined. The histograms show 1 representative donor of 10 for MDCs (black) and 1 of 4 for LCs (dotted) (A). The expression of CD1 molecules was determined on monocyte-derived DCs cultured in human adult serum (AS) or fetal calf serum (FCS) and IL-4 and GM-CSF for 6 days to allow differentiation of DCs from monocytes. The mean fluorescence intensity (MFI) of CD1a, CD1b, CD1c, and CD1d on DCs cultured in AS ( ) or FCS (
 ) from 18 donors was measured (B). Average CD1 expression is depicted by a line in the graphs. The statistical difference between the CD1 expression on DCs grown in AS and FCS was determined by paired t test. DCs cultured in AS and FCS obtained a similar overall phenotype with respect to expression of MHC class II (HLA-DR), MHC class I (HLA-A2), and DC-SIGN, as well as their lack of CD14 expression as determined by flow cytometry (C). The numbers on the plots are the percentages of dendritic cells that fall within each rectangle. The graphs show data from 1 representative donor of 6. Immature DCs grown in either AS or FCS were irradiated (30 Gy) and cocultured with allogeneic CD3+ T cells at a ratio 1:10 for 2, 4, and 6 days, and T-cell proliferation was determined by incorporation of 3H-thymidine (1 μCi [0.037 MBq]/well for 6 hours) and presented as counts per minute (cpm) (D). The graph shows the average proliferation plus or minus standard deviation of triplicates from 1 of 2 donors. To assess the ability of the DCs to mature, both DCs cultured in AS and FCS were exposed to 100 ng/mL LPS for 16 hours and the expression of CD83 was determined by flow cytometry (E). Histograms show unstained DCs (filled), unstimulated DCs (dashed), and LPS-stimulated DCs (solid) on DCs grown in either AS or FCS. One representative experiment of 6 is shown.
We hypothesized that the differences in CD1 expression on LCs in skin and MDCs in blood might be controlled by factors in the local microenvironment. One difference between these anatomic sites is that DCs in blood are exposed to abundant immunoglobulins, whereas DCs in skin are exposed to substantially lower concentrations under nonpathological conditions. To test this hypothesis, we turned to in vitro systems to study in detail how serum components may regulate CD1 expression. Prior studies show that monocyte-derived DCs express different CD1 molecules depending on what type and concentration of serum supplements they are cultured in.30-32 Monocytes were cultured in IL-4 and GM-CSF for 6 days to obtain immature DCs. DCs grown in the presence of FCS (a serum that is naturally low in total immunoglobulin) expressed high levels of CD1a, CD1b, and CD1c but no or low levels of CD1d, while DCs cultured in human adult serum (AS, rich in immunoglobulins) displayed the opposite phenotype; CD1d+, CD1a−, CD1b−, and CD1c− (P < .001; Figure 1B). Furthermore, the surface expression of CD1 molecules was not significantly altered even in response to LPS-induced DC maturation (data not shown) in agreement with a prior study.33 It thus seems that serum with high immunoglobulin content provides a dominant-negative signal that prevents group I CD1 expression, even in the presence of high-dose recombinant GM-CSF, which is a potent CD1-inducing cytokine.11,12
Despite the differences in CD1 expression, DCs cultured in FCS or AS both lacked CD14 after 6 days of culture, whereas they expressed MHC class I and II, as well as the C-type lectin DC-SIGN to similar extents (Figure 1C). In addition, DCs cultured either in FCS or AS had a similar capacity to induce T-cell proliferation in allogeneic T cells (Figure 1D), and both responded to LPS stimulation by up-regulation of the costimulatory molecule CD83 (Figure 1E). FCS is naturally low but not completely devoid of immunoglobulins. Control experiments using FCS with a defined ultra-low IgG content displayed DCs with an identical phenotype as DCs generated in the presence of regular FCS with respect to CD1 molecules, MHC class I and II, as well as DC-SIGN (data not shown). Taken together, monocyte-derived DCs cultured in FCS or AS recapitulate key aspects of the CD1 phenotype seen in vivo and represent a suitable in vitro model system to study the regulation of CD1 expression.
The CD1 profile of monocyte-derived dendritic cells can be altered by the addition of immunoglobulins
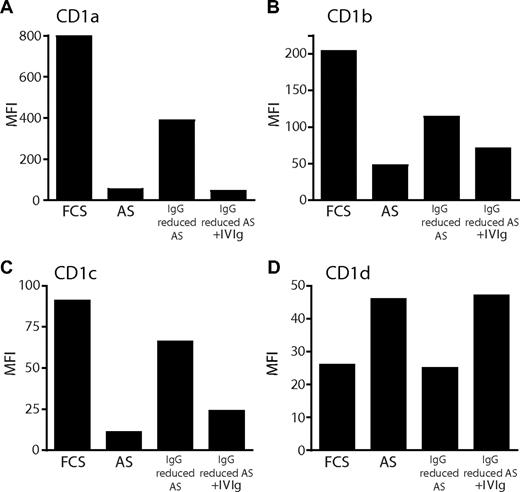
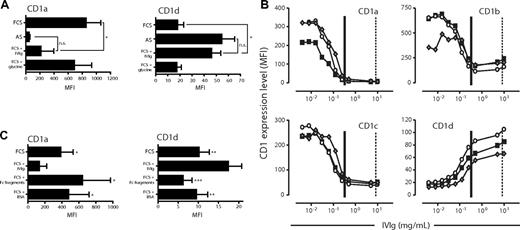
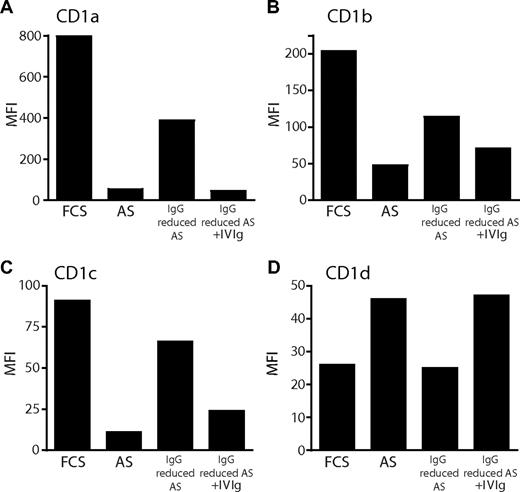
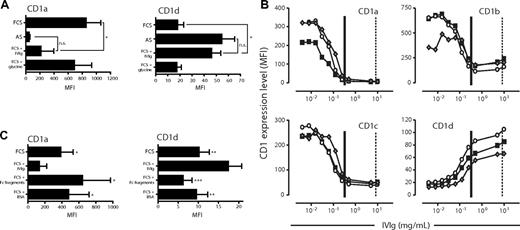
To address whether the differences in CD1 expression observed between DCs cultured in FCS or AS could be accounted for by differences in immunoglobulin levels, we carried out 2 experimental approaches. First, we generated DCs in AS, where IgG levels had been reduced by protein G column filtration. We found that the expression of CD1a, CD1b, and CD1c increased on DCs cultured in AS with reduced IgG content, compared with DCs grown in complete AS. Furthermore, adding back Ig reversed the effect (Figure 2A-C). In contrast, the expression of CD1d responded to the same manipulations in a manner opposite to group I CD1 proteins, as it was reduced on DCs grown in IgG-reduced AS and restored with the addition of Ig (Figure 2D). Protein G column filtration of AS did not, however, result in the complete depletion of IgG (data not shown). Therefore, in a second approach, we studied the CD1a and CD1d expression of immature DCs generated in FCS with the addition of a defined, high dose of IVIg. The IVIg preparation is composed mainly of monomeric IgG (only trace amounts of IgA and IgM) but also contains complexed IgG.34 We found that DCs cultured with the addition of a high dose of IVIg (20 mg/mL) displayed a significantly lower level of CD1a and a significantly increased expression of CD1d compared with donor-matched DCs grown in FCS alone (P < .05; Figure 3A). Moreover, DCs cultured in FCS with the addition of IVIg no longer displayed a significantly different expression level of CD1a and CD1d compared with DCs cultured in AS (Figure 3A), clearly demonstrating the potent effect of IgG on the CD1 profile of DCs. The expression of the CD1 molecules was not significantly affected by the IVIg glycine vehicle (Figure 3A and data not shown). To study this in more detail, we cultured monocytes in cytokines and FCS with increasing doses of IVIg and subsequently determined the level of CD1 expression on the DCs. The normal range of IgG in serum of healthy individuals is 6 to 15 mg/mL. The AS used in this study contained 11.3 mg IgG/mL, and the final concentration of AS-derived IgG in the cultures where we observed increased expression of CD1d and lack of group I CD1 expression was 0.65 mg/mL. Therefore, we added 0.004 to 10 mg/mL IVIg to the monocytes cultured in FCS and cytokines to cover both the experimental and physiological range of human serum IgG concentrations. Increasing doses of IVIg resulted in DCs that displayed reduced expression of CD1a, CD1b, and CD1c in a dose-dependent manner (Figure 3B). In addition, the addition of IVIg to FCS resulted in an increase in CD1d expression to levels comparable with those found in DCs grown in AS (Figure 3B). We monitored the maturation status of the DCs and could not observe any induction of maturation as a consequence of exposing the DCs to immunoglobulins (data not shown).
Reduction of IgG levels in human adult serum results in increased expression of CD1a, CD1b, and CD1c, and decreased expression of CD1d on dendritic cells. The expression of CD1 molecules was determined on monocyte-derived DCs after 6 days of culture in IL-4 and GM-CSF and FCS, AS, or AS with reduced IgG content. To reduce the levels of IgG in AS, the serum was diluted 10 times in RPMI and passed through a protein G column twice to allow binding of IgG. As a control, immunoglobulins were added back to the AS after protein G binding. After 6 days of culture, the cell surface expression of CD1a (A), CD1b (B), CD1c (C), and CD1d (D) on DCs was determined by flow cytometry. The graphs show the MFI of CD1 expression from 1 representative donor of 4.
Reduction of IgG levels in human adult serum results in increased expression of CD1a, CD1b, and CD1c, and decreased expression of CD1d on dendritic cells. The expression of CD1 molecules was determined on monocyte-derived DCs after 6 days of culture in IL-4 and GM-CSF and FCS, AS, or AS with reduced IgG content. To reduce the levels of IgG in AS, the serum was diluted 10 times in RPMI and passed through a protein G column twice to allow binding of IgG. As a control, immunoglobulins were added back to the AS after protein G binding. After 6 days of culture, the cell surface expression of CD1a (A), CD1b (B), CD1c (C), and CD1d (D) on DCs was determined by flow cytometry. The graphs show the MFI of CD1 expression from 1 representative donor of 4.
Addition of immunoglobulins to FCS-based cultures results in a similar CD1 profile of dendritic cells as observed after culture in adult serum. The expression of CD1a and CD1d was analyzed on DCs after 6 days of culture in IL-4 and GM-CSF and AS, FCS, or FCS with a high dose of IVIg (20 mg/mL). The IVIg was dissolved in 0.2 M glycine, which was included as control. The graphs show the average MFI of CD1a and CD1d cell surface expression (± standard deviation) from 6 individual donors (A). The expression of CD1 molecules on DCs cultured for 6 days in the presence of IL-4, GM-CSF, and FCS with increasing doses of IVIg (0.004 to 10 mg/mL IVIg) was measured by flow cytometry (B). Three representative donors of 6 are plotted as individual lines (■, ○, and ◆). As references, vertical lines depict the average levels of IgG added to the AS DC cultures (∣) and found in serum of healthy individuals (¦). Furthermore, the effect of adding Fc fragments instead of intact immunoglobulins, or equimolar amounts of bovine serum albumin (BSA) instead of IVIg, to the FCS cultures was assessed by determining the expression levels of CD1a and CD1d on DCs after 6 days of culture. The graphs show the average MFI of CD1a and CD1d cell surface expression (± standard deviation) from 4 individual donors (C). Statistical differences were assessed by paired t test and considered significant when *P < .05; **P < .01 and ***P < .001.
Addition of immunoglobulins to FCS-based cultures results in a similar CD1 profile of dendritic cells as observed after culture in adult serum. The expression of CD1a and CD1d was analyzed on DCs after 6 days of culture in IL-4 and GM-CSF and AS, FCS, or FCS with a high dose of IVIg (20 mg/mL). The IVIg was dissolved in 0.2 M glycine, which was included as control. The graphs show the average MFI of CD1a and CD1d cell surface expression (± standard deviation) from 6 individual donors (A). The expression of CD1 molecules on DCs cultured for 6 days in the presence of IL-4, GM-CSF, and FCS with increasing doses of IVIg (0.004 to 10 mg/mL IVIg) was measured by flow cytometry (B). Three representative donors of 6 are plotted as individual lines (■, ○, and ◆). As references, vertical lines depict the average levels of IgG added to the AS DC cultures (∣) and found in serum of healthy individuals (¦). Furthermore, the effect of adding Fc fragments instead of intact immunoglobulins, or equimolar amounts of bovine serum albumin (BSA) instead of IVIg, to the FCS cultures was assessed by determining the expression levels of CD1a and CD1d on DCs after 6 days of culture. The graphs show the average MFI of CD1a and CD1d cell surface expression (± standard deviation) from 4 individual donors (C). Statistical differences were assessed by paired t test and considered significant when *P < .05; **P < .01 and ***P < .001.
Low concentrations of immobilized IgG alter the CD1 profile of dendritic cells
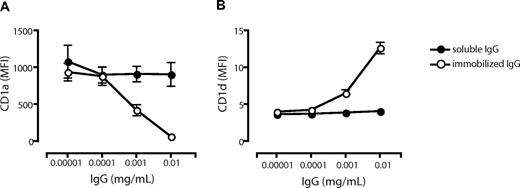
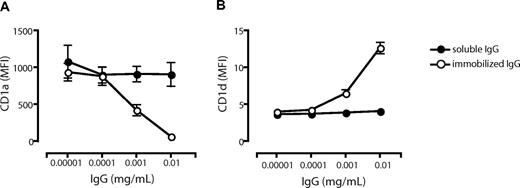
To investigate whether the observed effects by IVIg on CD1 expression could be mediated by FcR engagement by the Ig Fc part alone, we cultured cells in the presence of FCS and Fc fragments and analyzed the CD1 profile of the DCs. We found that Fc fragments had no significant effect on the CD1 expression compared with DCs cultured in FCS alone (Figure 3C). Furthermore, we used IgG-free albumin (BSA) to verify that the differences in CD1 expression were not a consequence of a large protein load in general (Figure 3C). The lack of effect on the CD1 expression profile in DCs by Fc fragments (Figure 3C) pointed to the possibility that complexed IgG in human serum and the IVIg preparation mediated the observed effect on CD1 expression in DCs. To address this, we studied the effect of immobilized IgG (to mimic immune complexes) on the CD1 expression on DCs. Monocytes were cultured in 0.00001 to 0.01 mg/mL soluble or immobilized IgG in FCS and cytokines for 6 days, and the expression level of CD1a (Figure 4A) and CD1d (Figure 4B) was determined. The levels of CD1a and CD1d were not affected by soluble IgG in this dose range. However, the CD1a expression decreased with increasing concentrations of immobilized IgG (Figure 4A), and CD1d expression increased with higher doses of immobilized IgG (Figure 4B). These data indicate that it indeed requires complexed IgG, rather than soluble IgG, to modulate the CD1 expression of DCs.
Low concentrations of immobilized but not soluble IgG alter the CD1 profile of dendritic cells. The surface expression of CD1a (A) and CD1d (B) on DCs cultured for 6 days in the presence of IL-4, GM-CSF, and FCS with low doses of immobilized IgG (○) or soluble IgG (•) was measured by flow cytometry. The graphs show the average MFI of CD1a and CD1d cell surface expression (± standard error of the mean) from 9 (immobilized IgG) or 2 (soluble IgG) individual donors.
Low concentrations of immobilized but not soluble IgG alter the CD1 profile of dendritic cells. The surface expression of CD1a (A) and CD1d (B) on DCs cultured for 6 days in the presence of IL-4, GM-CSF, and FCS with low doses of immobilized IgG (○) or soluble IgG (•) was measured by flow cytometry. The graphs show the average MFI of CD1a and CD1d cell surface expression (± standard error of the mean) from 9 (immobilized IgG) or 2 (soluble IgG) individual donors.
The relative CD1 gene expression corresponds to the CD1 protein expression pattern of dendritic cells cultured in the absence or presence of immunoglobulins
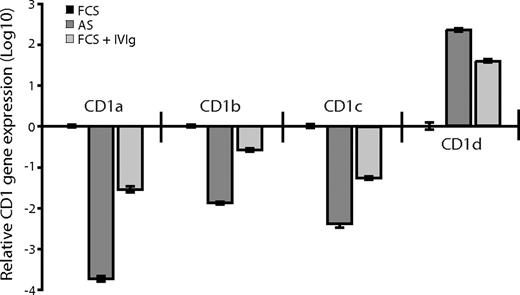
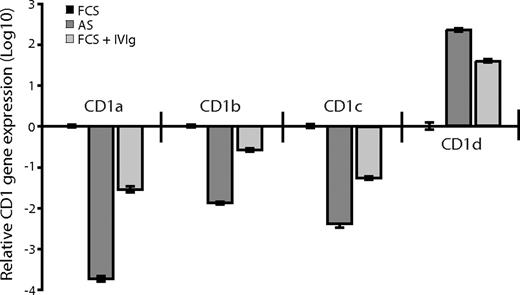
We next investigated whether there was a correlation between CD1 protein expression and the levels of CD1 mRNA in DCs grown in FCS, AS, or FCS supplemented with 0.5 mg/mL IVIg. Total mRNA from DCs was transcribed into cDNA, and the CD1 genes and GAPDH were amplified with gene-specific primers using real-time PCR. We found that the relative gene expression of CD1a, CD1b, and CD1c was lower in the DCs cultured in adult serum or FCS supplemented with IVIg compared with DCs cultured in FCS alone (Figure 5). Furthermore, DCs cultured in the presence of antibodies (adult serum or IVIg) expressed higher levels of CD1d than DCs cultured in FCS (Figure 5). Thus, the gene expression profile of the CD1 molecules corresponded to the protein expression pattern observed in DCs cultured in the absence or presence of IVIg, indicating that the CD1 expression in DCs is regulated on a transcriptional level. Taken together, these data show that IgG regulates the expression of CD1 molecules over the physiological range of IgG concentration found in humans. The natural ligands for immunoglobulins on DCs are Fc receptors expressed on the cells, so we next investigated their influence on CD1 expression.
The relative CD1 gene expression corresponds to the CD1 protein expression pattern of dendritic cells cultured in the absence or presence of immunoglobulins. The CD1 gene expression was analyzed in DCs after 6 days of culture in IL-4 and GM-CSF and AS, FCS, or FCS supplemented with 0.5 mg/mL IVIg in a 2-step-process. First, total mRNA was transcribed into cDNA using random hexamers and pT-primers. Second, the CD1 genes and GAPDH (as endogenous control) were amplified with gene-specific primers using a real-time PCR kit based on SYBRgreen technology. The real-time data were analyzed using the comparative Ct method and the data presented as fold-change in gene expression. The graph shows relative CD1 gene expression (± standard deviation) of DCs cultured in FCS (■), AS ( ), or FCS with IVIg (
 ) from 1 representative experiment of 2. The real-time PCR was done in triplicates and a no-template control was included.
The relative CD1 gene expression corresponds to the CD1 protein expression pattern of dendritic cells cultured in the absence or presence of immunoglobulins. The CD1 gene expression was analyzed in DCs after 6 days of culture in IL-4 and GM-CSF and AS, FCS, or FCS supplemented with 0.5 mg/mL IVIg in a 2-step-process. First, total mRNA was transcribed into cDNA using random hexamers and pT-primers. Second, the CD1 genes and GAPDH (as endogenous control) were amplified with gene-specific primers using a real-time PCR kit based on SYBRgreen technology. The real-time data were analyzed using the comparative Ct method and the data presented as fold-change in gene expression. The graph shows relative CD1 gene expression (± standard deviation) of DCs cultured in FCS (■), AS ( ), or FCS with IVIg (
 ) from 1 representative experiment of 2. The real-time PCR was done in triplicates and a no-template control was included.
Blocking of the activating Fcγ receptor CD32a abrogates the IVIg-mediated effects on CD1 expression in dendritic cells
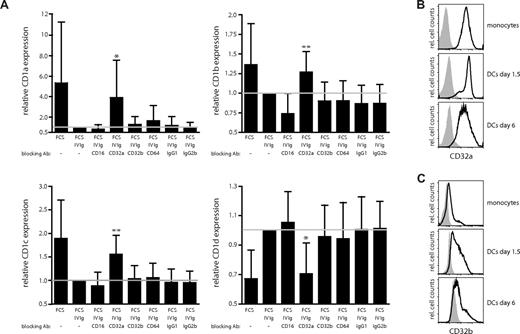
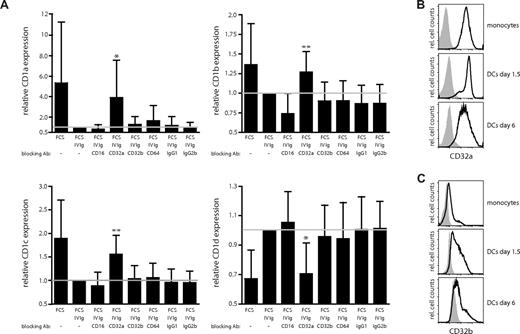
Recent data indicate that the function and maturation of DCs can be influenced by signaling via the activating (CD32a) and inhibitory (CD32b) isoforms of FcγRII.24 We therefore investigated whether the observed effects of IgG on the CD1 expression profile of DCs were dependent on the Fcγ receptors CD32a (FcγRIIa) and CD32b (FcγRIIb). In prior studies, monoclonal antibodies with isoform specificity have been described to specifically bind to and block either CD32a or CD32b.24,35 To block the Fcγ receptors, monocytes were first preincubated with antibodies for 2 hours and subsequently cultured in IL-4, GM-CSF, and FCS supplemented with 0.5 mg/mL IVIg plus blocking antibodies. The cultures were supplemented with fresh IVIg and blocking antibodies at day 3. After 6 days of culture, the expression of CD1 molecules on the DCs was determined by flow cytometry. For comparison and control, cells were either left untreated or cultured in the presence of antibodies blocking CD16 (FcγRIII) or CD64 (FcγRI), or isotype controls. We found that the presence of blocking CD32a antibody in the cultures almost completely abrogated the effect of IVIg on the CD1 expression profile of DCs. Expression of CD1a (P = .016), CD1b (P = .004), and CD1c (P = .005) significantly increased, and the expression of CD1d significantly decreased, when CD32a was blocked (P = .011; Figure 6A). Importantly, blocking of either CD32b or the control antibodies did not have a significant effect on the expression levels of the CD1 molecules on DCs (Figure 6A). Thus, signaling through CD32a is a critical factor for the establishment of the CD1 phenotype of DCs. Finally, we wanted to confirm the expression of FcγRII on CD14+ monocytes and on DCs. In agreement with previous observations,35 we found that monocytes expressed high levels of CD32a (Figure 6B) and only low levels of CD32b (Figure 6C). After culture in IL-4 and GM-CSF, the expression of CD32a decreased slightly on the DCs (Figure 6B), while the expression of CD32b increased (Figure 6C). Of note, the expression of the FcγRII on monocyte-derived DCs was not significantly influenced by the type of serum the cells were cultured in (data not shown). Furthermore, addition of the blocking FcγR antibodies in the absence of IVIg did not influence the level of CD1 expression on DCs (Figure S1, available on the Blood website; see the Supplemental Materials link at the top of the online article). Taken together, our data indicate that the interplay of immunoglobulins with Fc receptors is a significant factor affecting the CD1 profile of DCs. Importantly, CD32a is abundantly expressed on MDCs in blood and LCs in skin in vivo (data not shown and Boruchov et al35 ). Hence, FcγRIIa engagement and signaling may be important regulators for the CD1 expression in DCs both in vitro and in vivo.
Blocking of the activating Fcγ receptor CD32a abrogates the IVIg-mediated regulation of CD1 expression on dendritic cells. The effect of blocking the Fcγ receptors CD16, CD32a, CD32b, and CD64 using 2 μg/mL of each antibody (in the presence of 0.5 mg/mL IVIg) on CD1 expression on DCs was determined. The graphs show the relative MFI expression of CD1a, CD1b, CD1c, and CD1d cell surface expression (± standard deviation) from 9 individual donors after 6 days of culture (A). The reference line indicates the relative CD1 expression on DCs cultured in FCS and IVIg. The statistical difference between the CD1 expression on DCs grown in FCS and IVIg and DCs cultured in FCS, IVIg, and blocking FcγR antibodies was determined by paired t test or signed rank test if normality test failed. The surface expression of the activating Fcγ receptor CD32a (B) and the inhibitory Fcγ receptor CD32b (C) on CD14+ monocytes and on DCs cultured in IL-4, GM-CSF, and FCS for the indicated times was determined by flow cytometry. The histograms show the CD32 expression in black and the isotype control in gray. Statistical differences were considered significant when P < .05; *P < .05 and **P < .01.
Blocking of the activating Fcγ receptor CD32a abrogates the IVIg-mediated regulation of CD1 expression on dendritic cells. The effect of blocking the Fcγ receptors CD16, CD32a, CD32b, and CD64 using 2 μg/mL of each antibody (in the presence of 0.5 mg/mL IVIg) on CD1 expression on DCs was determined. The graphs show the relative MFI expression of CD1a, CD1b, CD1c, and CD1d cell surface expression (± standard deviation) from 9 individual donors after 6 days of culture (A). The reference line indicates the relative CD1 expression on DCs cultured in FCS and IVIg. The statistical difference between the CD1 expression on DCs grown in FCS and IVIg and DCs cultured in FCS, IVIg, and blocking FcγR antibodies was determined by paired t test or signed rank test if normality test failed. The surface expression of the activating Fcγ receptor CD32a (B) and the inhibitory Fcγ receptor CD32b (C) on CD14+ monocytes and on DCs cultured in IL-4, GM-CSF, and FCS for the indicated times was determined by flow cytometry. The histograms show the CD32 expression in black and the isotype control in gray. Statistical differences were considered significant when P < .05; *P < .05 and **P < .01.
The CD1 profile of dendritic cells determines their ability to stimulate CD1-restricted T cells
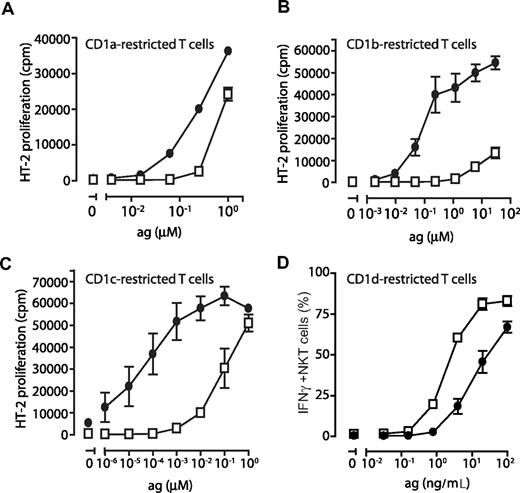
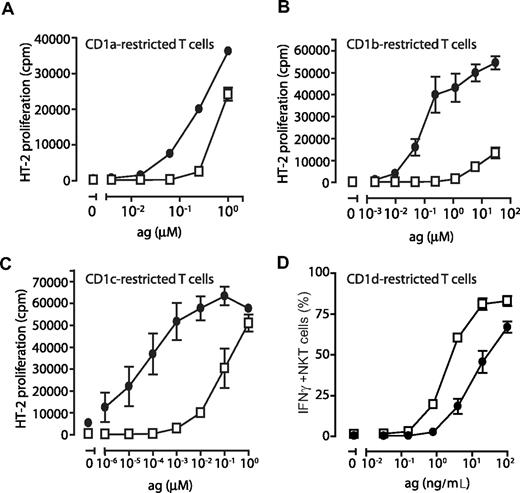
To verify that the CD1 molecules detected on DCs cultured in FCS and AS were functional antigen-presenting molecules, immature DCs were pulsed with increasing concentrations of lipid antigens known to be presented by CD1a (dideoxymycobactin, DDM), CD1b (C80 glucose monomycolate, GMM), CD1c (mannosyl-β-1-phosphomycoketide, MPM), as well as CD1d (α-galactosylceramide, αGalCer). T cells restricted by CD1a (J.RT-3/CD8-2), CD1b (LDN5), and CD1c (CD8-1) were cocultured with the antigen-pulsed DCs and assessed for CD1 and lipid antigen-induced IL-2 production. We consistently found that DCs grown in FCS presented group I CD1-restricted antigens more efficiently than DCs grown in AS, reflecting the low or absent expression of CD1a, CD1b, and CD1c on these DCs (Figure 7A-C). DCs grown in FCS were a 1000-fold more efficient at presenting CD1b- and CD1c-restricted antigen compared with DCs generated in AS (Figure 7B,C). The difference observed for CD1a was less pronounced but the FCS grown DCs were consistently 10 times more efficient at presenting CD1a-restricted DDM than DCs grown in AS (Figure 7A). To measure the ability of DCs to present antigen on CD1d, we pulsed DCs with αGalCer and cocultured them with Vα24+ NKT cells. We found that the percentage of IFNγ-producing NKT cells was up to 7-fold higher after coculture with DCs grown in AS compared with DCs cultured in FCS (Figure 7D).
The ability of dendritic cells to stimulate CD1-restricted T cells is determined by their CD1 expression profile. To determine the ability of DCs to present CD1-restricted antigens to T cells, human monocytes were cultured in IL-4, GM-CSF, and FCS (•) or AS (□) for 6 days and plated in 96-well plates and pulsed with decreasing concentrations of antigen presented by CD1a (dideoxymycobactin), CD1b (glucose monomycolate), CD1c (mannosyl-b-1-phosphomycoketide), or CD1d (α-galactosylceramide). CD1-restricted T cells were then added at a 1:1 ratio to T-cell lines J.RT-3/CD8–2 (CD1a), LDN5 (CD1b), CD8–1 (CD1c), or sorted NKT cells (CD1d). Activation of CD1a-, CD1b-, and CD1c-restricted T cells was determined by their production of IL-2 using the HT-2 cells bioassay (A-C). Activation of CD1d-restricted NKT cells was measured after 6 hours of coculture by determining the frequency of IFNγ-producing cells by intracellular cytokine staining and flow cytometry (D). The graphs A-C show the average IL-2 release (± standard deviation) of triplicates in 1 representative donor of 3. The average frequency of IFNγ+ NKT cells (± standard deviation) in 2 individual donors (1 representative experiment of 2; 4 donors tested in total) is presented (D).
The ability of dendritic cells to stimulate CD1-restricted T cells is determined by their CD1 expression profile. To determine the ability of DCs to present CD1-restricted antigens to T cells, human monocytes were cultured in IL-4, GM-CSF, and FCS (•) or AS (□) for 6 days and plated in 96-well plates and pulsed with decreasing concentrations of antigen presented by CD1a (dideoxymycobactin), CD1b (glucose monomycolate), CD1c (mannosyl-b-1-phosphomycoketide), or CD1d (α-galactosylceramide). CD1-restricted T cells were then added at a 1:1 ratio to T-cell lines J.RT-3/CD8–2 (CD1a), LDN5 (CD1b), CD8–1 (CD1c), or sorted NKT cells (CD1d). Activation of CD1a-, CD1b-, and CD1c-restricted T cells was determined by their production of IL-2 using the HT-2 cells bioassay (A-C). Activation of CD1d-restricted NKT cells was measured after 6 hours of coculture by determining the frequency of IFNγ-producing cells by intracellular cytokine staining and flow cytometry (D). The graphs A-C show the average IL-2 release (± standard deviation) of triplicates in 1 representative donor of 3. The average frequency of IFNγ+ NKT cells (± standard deviation) in 2 individual donors (1 representative experiment of 2; 4 donors tested in total) is presented (D).
Taken together, these data show that the different CD1 profiles of DCs after culture in either FCS or AS also translate into a functional difference in their ability to present CD1-restricted antigens to CD1-restricted T cells and thus to induce T-cell activation. Whereas DCs grown in the presence of low immunoglobulin levels seem to preferentially present antigens to group I CD1-restricted T cells known to play an important role in antimicrobial responses, DCs cultured in the presence of abundant amounts of immunoglobulins seem to be superior in activating the regulatory CD1d-restricted NKT cells.
Discussion
DCs are professional antigen-presenting cells endowed with superior capacity to present both MHC-restricted and CD1-restricted antigens. Unlike MHC molecules, however, the 4 surface-expressed CD1 molecules are not homogenously expressed in all subtypes of DCs such as peripheral blood DCs and skin LCs, suggesting that DCs may adapt their CD1 antigen presentation machinery according to signals in the microenvironment. Here, we demonstrate a role for IgG in regulating the expression of CD1 molecules in human DCs. Initially, 2 observations provided circumstantial evidence pointing toward a role of immunoglobulins in regulating CD1 expression in these cells. First, the difference in CD1 expression profile between peripheral blood DCs and skin LCs coincides with their location in an environment rich and low in immunoglobulins, respectively. Second, DCs derived from monocytes in vitro displayed a distinct group I CD1+ phenotype when cultured in medium supplemented with fetal serum with very low immunoglobulin content, whereas DCs generated in parallel cultures supplemented with adult serum with high immunoglobulin content were homogenously CD1d+, but negative for the group I molecules. With further experiments using DCs grown in protein G column–filtered serum to reduce the immunoglobulin content, as well as DCs cultured in IVIg supplemented serum, we were able to demonstrate that IgG in fact played a strong role in regulating the CD1 expression profile in monocyte-derived DCs. Experiments in which mAbs were used to block various Fc receptors strongly indicated that the effect of IgG was mediated by FcγRIIa. Furthermore, the regulatory effect of IgG occurred at the transcriptional level.
Immunoglobulin Fc receptors are important for the function of various innate and adaptive cell types and mechanisms.36 They bind the Fc portion of immunoglobulins and signal through cross-linking upon specific immunoglobulin binding of antigen and formation of immune complexes. FcγRII exists as one activating form, FcγRIIa, and one inhibitory form, FcγRIIb, and the balance of signals mediated via these receptors influences the function of B cells as well as DCs.36 In a report by Dhodapkar et al, FcγRII signals were shown to modify the ability of DCs to mature and respond to stimuli.24 We now observe that DCs adapt to the presence or absence of IgG in the environment during differentiation from monocytes by regulating the expression of group I and group II CD1 molecules, and thereby the ability to present antigens to, and activate, various CD1-restricted T cells. This effect depends on the activating FcγRIIa and seems, as expected, to require cross-linking since soluble monomeric IgG is effective only after immobilization on a plastic surface.
Many factors in the microenvironment influence differentiation and maturation of DCs, as well as their ability to present various forms of antigens to T cells. Recent findings point to an important role for the lipid-activated transcription factor peroxisome proliferator-activated receptor γ (PPARγ) in regulating expression of various immune receptors in DCs including HLA-DR, CD80, and CD1a.37,38 Moreover, PPARγ can indirectly influence CD1d expression via regulation of retinoid metabolism and signaling,39 and influence the differentiation of CD1a+ and CD1a− DCs.40 PPARγ is therefore one of several links between lipid metabolism and the CD1 antigen presentation pathways in DCs, and this is probably important for the ability of these cells to adapt to the environment. This link between lipid metabolism and CD1 antigen presentation may also play a role in pathogenic processes such as atherosclerosis where NKT cells and other CD1-restricted T cells are probably involved.41 Our results indicate that IgG acting via the activating FcγRIIa strongly influences the CD1 profile of developing DCs. IgG likely needs to be complexed with endogenous or exogenous antigens, or trapped in anti-idiotypic complexes to have this effect. It is thus clear that signals through FcγRIIa and PPARγ are 2 pathways regulating CD1 expression and subsequently CD1-mediated antigen presentation.
Studies with agonists of PPARγ, microbial TLR agonists, and immunoglobulins illustrate a balance of stimulatory and inhibitory signals that controls the expression of CD1 on cells in the blood and tissues. Importantly, in each of these 3 systems, a single stimulus provides opposite effects on group I and group II CD1 protein expression providing evidence for separate functions of group I and II CD1 proteins in immune responses. Monocytes and DCs circulating in blood in the presence of high concentrations of immunoglobulins constitutively express CD1d and are good at activating CD1d-restricted NKT cells. The constitutive expression of CD1d is consistent with the proposed innate functions of NKT cells, which act early in the immune response to carry out strong regulatory effects on effector cells of the innate and adaptive immune systems. Extensive data from both animal models and human studies show that NKT cell activation can have a broad range of effects, including NK cell activation in the setting of viral infections and tumor immunity, and regulating the Th1-Th2 balance with clear effects on autoimmunity. On the other hand, T cells responding to group I CD1 proteins express diverse TCRs with specificity for a variety of self- and foreign lipid antigens and fit the innate model less well. Thus, IgG-mediated inhibition of group I CD1 expression may set the stage for acquisition of group I CD1 function at a later stage of immune response, after migration into tissues.
The in vitro data presented here imply that IVIg treatment may affect the balance between CD1d-restricted antigen presentation and NKT cell responses, and T-cell responses restricted by the group I CD1 molecules. IVIg has multiple effects on the immune system and is used for the treatment of autoimmune and systemic inflammatory diseases, as well as immunotherapy of CVID patients.42 Furthermore, in a murine model of atherosclerosis, infusion of IVIg into ApoE-deficient mice has been reported to decrease atherosclerosis.43,44 These observations point to a complex relationship between lipid metabolism, antigen presentation by CD1 molecules, T cells, and DCs, and IVIg treatment that will affect pathogenic processes at multiple levels.
In summary, we have found that the level of exposure to IgG regulates the CD1 expression profile during DC differentiation, and that this is mediated by FcγRIIa. Furthermore, this in turn determines whether the DCs will be biased toward activation of CD1d-restricted regulatory NKT cells or T cells specific for lipid antigens presented by CD1a, CD1b, and CD1c. These findings significantly improve our knowledge of CD1-mediated antigen presentation in DCs, and are important for our understanding of diseases associated with immunoglobulin deficiencies and their treatment with IVIg.
The online version of this article contains a data supplement.
The publication costs of this article were defrayed in part by page charge payment. Therefore, and solely to indicate this fact, this article is hereby marked “advertisement” in accordance with 18 USC section 1734.
Acknowledgments
The authors thank Kirin Brewery Company, Yokohama, Japan, for the gift of the αGalCer, and MacroGenics for the gift of the 2B6 monoclonal antibody. We also thank Cornelia Gujer and Emily Poignant for technical assistance with LCs.
This work was supported by grants from the Swedish International Development Agency, the Swedish Foundation for Strategic Research, the National Institutes of Health (NIH AI52731), the Swedish Research Council, and Karolinska Institutet. A.S-S. and M.M. are fellows of the Swedish Research Council. D.B.M. is supported by the Cancer Research Institute, the Pew Foundation Scholars in the biomedical Sciences, and the NIH (R01 AI049313 and AR 048632).
National Institutes of Health
Authorship
Contribution: A.S.-S. and M.M. designed research, performed experiments, analyzed data, and cowrote the paper; T.-Y.C. and K.L. performed experiments and analyzed data; A.-C.N. provided unique patient specimens; L.P. provided important specimens; D.B.M. and A.-L.S. designed research; J.K.S. designed research, analyzed data, and cowrote the paper.
Conflict-of-interest disclosure: The authors declare no competing financial interests.
Correspondence: Anna Smed-Sörensen, Genentech, 1 DNA Way, South San Francisco, CA 94080; e-mail: smedsorensen.anna@gene.com; Johan K. Sandberg, CIM, Department of Medicine, F59, Karolinska Institutet, Karolinska University Hospital Huddinge, 14186 Stockholm, Sweden; e-mail: johan.sandberg@ki.se.
References
Author notes
*A.S.-S. and M.M. contributed equally to this study.

![Figure 1. The CD1 profile of monocyte-derived dendritic cells is influenced by the type of serum they are cultured in. The expression of CD1a and CD1d was determined on blood myeloid DCs (MDCs) and Langerhans cells (LCs) in the epidermis of skin. MDCs were identified in PBMCs by gating on size, followed by a gate on cells negative for lineage markers (CD3, CD8, CD14, CD16, CD19, and CD56). CD11c+ HLA-DR+ MDCs were subsequently identified among the lineage-negative cells, and the CD1a and CD1d profile of MDCs was displayed. To assess the CD1 profile of LCs, cells were allowed to migrate out from epidermis sheets of skin biopsies for 2 to 3 days. The cells were subsequently analyzed by flow cytometry, and LCs were identified by size and high expression of HLA-DR and their expression of CD1a and CD1d was determined. The histograms show 1 representative donor of 10 for MDCs (black) and 1 of 4 for LCs (dotted) (A). The expression of CD1 molecules was determined on monocyte-derived DCs cultured in human adult serum (AS) or fetal calf serum (FCS) and IL-4 and GM-CSF for 6 days to allow differentiation of DCs from monocytes. The mean fluorescence intensity (MFI) of CD1a, CD1b, CD1c, and CD1d on DCs cultured in AS () or FCS () from 18 donors was measured (B). Average CD1 expression is depicted by a line in the graphs. The statistical difference between the CD1 expression on DCs grown in AS and FCS was determined by paired t test. DCs cultured in AS and FCS obtained a similar overall phenotype with respect to expression of MHC class II (HLA-DR), MHC class I (HLA-A2), and DC-SIGN, as well as their lack of CD14 expression as determined by flow cytometry (C). The numbers on the plots are the percentages of dendritic cells that fall within each rectangle. The graphs show data from 1 representative donor of 6. Immature DCs grown in either AS or FCS were irradiated (30 Gy) and cocultured with allogeneic CD3+ T cells at a ratio 1:10 for 2, 4, and 6 days, and T-cell proliferation was determined by incorporation of 3H-thymidine (1 μCi [0.037 MBq]/well for 6 hours) and presented as counts per minute (cpm) (D). The graph shows the average proliferation plus or minus standard deviation of triplicates from 1 of 2 donors. To assess the ability of the DCs to mature, both DCs cultured in AS and FCS were exposed to 100 ng/mL LPS for 16 hours and the expression of CD83 was determined by flow cytometry (E). Histograms show unstained DCs (filled), unstimulated DCs (dashed), and LPS-stimulated DCs (solid) on DCs grown in either AS or FCS. One representative experiment of 6 is shown.](https://ash.silverchair-cdn.com/ash/content_public/journal/blood/111/10/10.1182_blood-2007-07-099549/6/m_zh80100819640001.jpeg?Expires=1769096484&Signature=EmdjuE2jQh050Ona5dAlSYef5zhMs00WLzJrSGzIoXsmSA~K--U~82v43YxkYT49yTnMlQLVwYgFHVMANUqOg8018bVe~YaeyLdnHeo8jS1hrrodA0JN6oqRgAxqW0F0zIk72NTuNrqiH9Dq4k-Pt3XnfLRKyv~5A-cAcKAy2Vaen8UbHOhjL6uSCuCz~cb4c7TPLrLOpqlETUVE80-wZ061xPEgCmBEMpTDP7RBamTnUwzpg4FDP1IEmHO~G-k3YmfxxllXYB4lUZIF89Uex4ZKZvwleV8J0t0Z8r73SMiS6oneLKBVHoforIs9NWZ6Py2A6uGiFpBtaTMAC91Huw__&Key-Pair-Id=APKAIE5G5CRDK6RD3PGA)

![Figure 1. The CD1 profile of monocyte-derived dendritic cells is influenced by the type of serum they are cultured in. The expression of CD1a and CD1d was determined on blood myeloid DCs (MDCs) and Langerhans cells (LCs) in the epidermis of skin. MDCs were identified in PBMCs by gating on size, followed by a gate on cells negative for lineage markers (CD3, CD8, CD14, CD16, CD19, and CD56). CD11c+ HLA-DR+ MDCs were subsequently identified among the lineage-negative cells, and the CD1a and CD1d profile of MDCs was displayed. To assess the CD1 profile of LCs, cells were allowed to migrate out from epidermis sheets of skin biopsies for 2 to 3 days. The cells were subsequently analyzed by flow cytometry, and LCs were identified by size and high expression of HLA-DR and their expression of CD1a and CD1d was determined. The histograms show 1 representative donor of 10 for MDCs (black) and 1 of 4 for LCs (dotted) (A). The expression of CD1 molecules was determined on monocyte-derived DCs cultured in human adult serum (AS) or fetal calf serum (FCS) and IL-4 and GM-CSF for 6 days to allow differentiation of DCs from monocytes. The mean fluorescence intensity (MFI) of CD1a, CD1b, CD1c, and CD1d on DCs cultured in AS () or FCS () from 18 donors was measured (B). Average CD1 expression is depicted by a line in the graphs. The statistical difference between the CD1 expression on DCs grown in AS and FCS was determined by paired t test. DCs cultured in AS and FCS obtained a similar overall phenotype with respect to expression of MHC class II (HLA-DR), MHC class I (HLA-A2), and DC-SIGN, as well as their lack of CD14 expression as determined by flow cytometry (C). The numbers on the plots are the percentages of dendritic cells that fall within each rectangle. The graphs show data from 1 representative donor of 6. Immature DCs grown in either AS or FCS were irradiated (30 Gy) and cocultured with allogeneic CD3+ T cells at a ratio 1:10 for 2, 4, and 6 days, and T-cell proliferation was determined by incorporation of 3H-thymidine (1 μCi [0.037 MBq]/well for 6 hours) and presented as counts per minute (cpm) (D). The graph shows the average proliferation plus or minus standard deviation of triplicates from 1 of 2 donors. To assess the ability of the DCs to mature, both DCs cultured in AS and FCS were exposed to 100 ng/mL LPS for 16 hours and the expression of CD83 was determined by flow cytometry (E). Histograms show unstained DCs (filled), unstimulated DCs (dashed), and LPS-stimulated DCs (solid) on DCs grown in either AS or FCS. One representative experiment of 6 is shown.](https://ash.silverchair-cdn.com/ash/content_public/journal/blood/111/10/10.1182_blood-2007-07-099549/6/m_zh80100819640001.jpeg?Expires=1769130399&Signature=moVBW1phPs9~S~D34puP9k5RV8Fl8zx1mbVBiHGobxiKUhVDihVyaNhjWtN9TzZPUZwE5ay3vjmvlaMlfHx~mBBrkMEXdN6U47PQ6rJJUTdkd-ptxtnFTaF9ODLj25XBDdiKR67F4YnGWsrFltXUKWn1etSpL20klg6aQUFGYyFV0SlSZZ9qh8ykyeF8o0pZwgblv8lnGnkJ~Gx6cRf-x4dl8rrWea5t5yLRvLopR1QCn5WjkBTOqzceaw~HYJSsy-7G3Pr9PLHTUsJFkczZjynW88xVhKiLQha1YE7zQ1J42nDtEsouUto2GlXjMk-mRmUT~i2D09krj9uHykKl~Q__&Key-Pair-Id=APKAIE5G5CRDK6RD3PGA)
 ) or FCS (
 ) from 18 donors was measured (B). Average CD1 expression is depicted by a line in the graphs. The statistical difference between the CD1 expression on DCs grown in AS and FCS was determined by paired t test. DCs cultured in AS and FCS obtained a similar overall phenotype with respect to expression of MHC class II (HLA-DR), MHC class I (HLA-A2), and DC-SIGN, as well as their lack of CD14 expression as determined by flow cytometry (C). The numbers on the plots are the percentages of dendritic cells that fall within each rectangle. The graphs show data from 1 representative donor of 6. Immature DCs grown in either AS or FCS were irradiated (30 Gy) and cocultured with allogeneic CD3+ T cells at a ratio 1:10 for 2, 4, and 6 days, and T-cell proliferation was determined by incorporation of 3H-thymidine (1 μCi [0.037 MBq]/well for 6 hours) and presented as counts per minute (cpm) (D). The graph shows the average proliferation plus or minus standard deviation of triplicates from 1 of 2 donors. To assess the ability of the DCs to mature, both DCs cultured in AS and FCS were exposed to 100 ng/mL LPS for 16 hours and the expression of CD83 was determined by flow cytometry (E). Histograms show unstained DCs (filled), unstimulated DCs (dashed), and LPS-stimulated DCs (solid) on DCs grown in either AS or FCS. One representative experiment of 6 is shown.
 ), or FCS with IVIg (
 ) from 1 representative experiment of 2. The real-time PCR was done in triplicates and a no-template control was included.