Abstract
Primary systemic amyloidosis (AL) is a rare monoclonal plasma cell (PC) disorder characterized by the deposition of misfolded immunoglobulin (Ig) light chains (LC) in vital organs throughout the body. To our knowledge, no cell lines have ever been established from AL patients. Here we describe the establishment of the ALMC-1 and ALMC-2 cell lines from an AL patient. Both cell lines exhibit a PC phenotype and display cytokine-dependent growth. Using a comprehensive genetic approach, we established the genetic relationship between the cell lines and the primary patient cells, and we were also able to identify new genetic changes accompanying tumor progression that may explain the natural history of this patient's disease. Importantly, we demonstrate that free lambda LC secreted by both cell lines contained a beta structure and formed amyloid fibrils. Despite absolute Ig LC variable gene sequence identity, the proteins show differences in amyloid formation kinetics that are abolished by the presence of Na2SO4. The formation of amyloid fibrils from these naturally secreting human LC cell lines is unprecedented. Moreover, these cell lines will provide an invaluable tool to better understand AL, from the combined perspectives of amyloidogenic protein structure and amyloid formation, genetics, and cell biology.
Introduction
Primary systemic amyloidosis (AL) is a rare monoclonal plasma cell (PC) disorder characterized by the systemic deposition of misfolded immunoglobulin (Ig) light chain (LC) products as insoluble fibrils in vital tissues and/or organs. AL is the most common cause of amyloidosis in the Western world, and 1275 to 3200 new cases of AL are diagnosed annually in the United States.1 This disease is secondary to a constellation of PC diseases, including monoclonal gammopathy of undetermined significance (MGUS), multiple myeloma (MM), and occasionally IgM producing disorders, such as Waldenstrom macroglobulinemia. In most monoclonal gammopathy patients, little to no free LC proteins are secreted by the clonal PCs, whereas in a few others, the physiochemical characteristics of the Ig LC or its N-terminal fragment led to its deposition as amyloid together with other components.
Interestingly, the development of AL is not strictly correlated with either the burden of monoclonal PCs or the abundance of the LC proteins produced but appears to be dictated by germ line Ig κ or λLC variable (V) region gene usage and acquired somatic mutations. For example, λLCs are 2 to 3 times more likely to be amyloidogenic than κLCs, and the specific genes IGLV3-1 (3r) and IGLV6-57 (6a) are involved in 40% of all AL patients.2 Amyloid fibrils are also distinguishable by other unique structural features, including (1) red/green birefringence appearance after Congo-Red staining when viewed under polarized light, (2) super secondary structure consisting of cross beta sheet structure, and (3) nonbranching fibrils of indefinite length with a diameter of 8 to 12 nm using electron microscopy.3,4 Other factors, such as serum amyloid P-component, heparan sulfate proteoglycans, and Apo-E, are found to be codeposited with AL (reviewed by Stevens and Kisilevsky5 ), suggesting their possible role in mediating or facilitating the formation of amyloid. Whether or not there is a role for the amyloido-genic LC secreting PC beyond simple production of the LC remains unknown.
The circulating free LC leading to amyloidosis is typically produced by a small monoclonal PC population; however, 10% to 15% of patients with symptomatic MM have coexisting AL6 and AL is far less frequently observed in MM patients exhibiting high proliferative clonal disease. Because of these factors, it has been exceedingly challenging to study this disease, and the field lacks feasible model systems. Although there have been studies on the biologic and molecular characteristics of amyloidogenic LCs,7-15 these studies are challenged by the limited availability of human amyloidogenic LCs.
In this report, we describe the establishment and genetic characterization of 2 novel sister cell lines, ALMC-1 and ALMC-2. Both cell lines were established from the same patient who was initially diagnosed with AL and then relapsed with symptomatic MM. To our knowledge, this is the first description and extensive characterization of a cell line from a patient diagnosed with AL, and will potentially provide a unique tool to study amyloid formation as well as the biology of PCs secreting amyloidogenic LC.
Methods
Case report and establishment of cell lines
This study was performed with the approval of the Mayo Foundation Institutional Review Board, and informed consent was obtained in accordance with the Declaration of Helsinki. The ALMC-1 cell line was established from the initial diagnostic bone marrow (BM) aspirate of a 50-year-old female patient referred to Mayo Clinic because of cardiac symptoms and suspicion of amyloid. The BM aspirate consisted of 27% IgG λ PCs with a PC labeling index of 1.9%. Serum protein electrophoresis revealed a 15-g/L IgGλ plus free λLC monoclonal protein. Serum-free LC studies showed a free λLC of 0.183 g/L and κ of 1.5 mg/L. Echocardiogram showed concentric hypertrophy consistent with an infiltrative cardiomyopathy, with an intraventricular septal thickness of 14 mm. Serum troponin T was elevated at 0.06 μg/L, with a brain natriuretic peptide of 115 pg/mL and an NT–pro-brain natriuretic peptide of 726 pg/mL. Electrocardiogram demonstrated low anterior forces, with a pseudoinfarct pattern in the anterior precordial leads. There was no evidence of either bone lesions or anemia; however, amyloid was present in periosteal vessel walls and in the fat aspirate, and the patient was diagnosed with AL with cardiac involvement. She was started on oral dexamethasone and received a peripheral blood stem cell transplant (PBSCT) approximately 2 months later but relapsed within 100 days with symptomatic myeloma. At relapse, the patient's BM aspirate consisted of 70% IgGλ expressing PCs and a PC labeling index of 20%. The second cell line, ALMC-2, was established from this aspirate.
BM mononuclear cells were purified by density gradient centrifugation and PCs enriched to more than 95% purity by magnetic cell separation using StemCell CD138 beads and a Robosep Cell Separator (StemCell Technologies, Vancouver, BC). Cells were cultured in Iscove modified Dulbecco medium GlutaMAX (Invitrogen, Carlsbad, CA), supplemented with 50 U/mL penicillin G, 10 μg/mL gentamicin, 50 μg/mL streptomycin (Invitrogen), 10% heat-inactivated fetal calf serum (Atlanta Biologicals, Norcross, GA), 1 ng/mL interleukin-6 (IL-6; kindly provided by Novartis, Basel, Switzerland), and 10 ng/mL insulin-like growth factor-I (IGF-I; Sigma-Aldrich, St Louis, MO).
RNA isolation, cDNA synthesis, and sequence analysis of IGHV and IGLV genes
Total RNA was isolated using the Trizol reagent (Invitrogen), converted to cDNA, and IGHV usage and mutational status determined by sequence analysis as previously described.16 For IGLV sequence analysis, we used 5′ primers designed to hybridize to Vλ1/2, Vλ3, Vλ4, Vλ5/6, and Vλ7/8 families in combination with a single 3′ degenerate primer that can hybridize to all 6 IGLC genes (5′-CTATGAACATTCYGYAGGGGC). The initial reverse-transcribed polymerase chain reaction (RT-PCR) only yielded product when the Vλ 5/6 primer (5′-ATGGCCTGGACTCCWCTHCTYCTC) was used. For sequence analysis, product was generated using a IGVL6-57-specific leader sequence primer (5′-ATGGCCTGGGCTCCACTACTTCTCACCCTC). Resulting sequences were aligned with germ line sequences in the IMGT/V-Quest reference database.17
Morphologic studies
Cell morphology was analyzed with cytospin preparations of the cells on glass slides made using a Thermo Shandon cytospin 2 and stained by standard Wright-Giemsa (Fisher Scientific, Pittsburgh, PA) before viewing by light microscopy (Olympic Provus AX70; Olympus, Center Valley, PA). Images were taken using an Olympus DP71 microscope digital camera equipped with Olympus DP Manager Software.
Immunophenotypic analysis
Cells were incubated with primary monoclonal antibodies for 30 minutes at 4°C, washed in cold buffer (Dulbecco phosphate-buffered saline supplemented with 2% fetal calf serum, 2 mM of ethylenediaminetetraacetic acid, and 0.05% sodium azide), fixed in 1% paraformaldehyde, and analyzed using a FACSCAN flow cytometer (BD Biosciences PharMingen, San Diego, CA) and FlowJo analytical software (TreeStar, Ashland, OR). All antibodies were purchased from BD Biosciences PharMingen, except CD49d, CD49e, and CD52 (Serotec, Raleigh, NC); CD40 and CD221 (Invitrogen); and CD126 (Beckman Coulter, Fullerton, CA). ΔMFI (delta mean fluorescence intensity), is calculated from the MFI of the cells expressing the marker of interest divided by the MFI of the cells stained with the isotype control.
Proliferation assay
Cells were assessed for cytokine responsiveness using 3H-thymidine incorporation as previously described.18 Recombinant cytokines used were interferon-α (IFN-α) (BioSource International, Camarillo, CA; 250 U/mL); granulocyte-macrophage colony-stimulating factor, interferon-gamma (IFN-γ), interleukin-1α (IL-1α), IL-1β, IL-4, IL-10, IL-11, IL-12, IL-13, and IL-21 (PeproTech, Rocky Hill, NJ; 1 ng/mL); oncostatin M, tumor necrosis factor-α, and transforming growth factor-β (R&D Systems, Minneapolis, MN; 1 ng/mL); leukemia inhibitory factor (BD Biosciences PharMingen; 1 ng/mL); and IL-2 (RDI, Concord, MA; 100 U/mL).
Enzyme-linked immunosorbent assay
To determine Ig secretion/cell, serum-starved ALMC-1 and ALMC-2 cell lines were cultured for 24 hours in media containing 0.5% bovine serum album with or without IL-6. To assess the overall capacity of each cell line to serve as sources of amyloidogenic LCs, 8 × 10⁶ cells were seeded into 40 mL of complete media, and cell-free supernatants were harvested after various times. Microtiter plates (Nalge Nunc International, Rochester, NY) were coated with sheep anti–human free-λLC-specific antibody (Bethyl Laboratories, Montgomery, TX) or goat anti–human IgG-specific antibody (BioSource International), blocked with phosphate-buffered saline containing 0.2% casein (BioFX Laboratories, Owings Mills, MD), washed, and then culture supernatants were added and incubated for 2 hours. Free λLC was detected colorimetrically using a horseradish peroxidase-conjugated goat anti–human λLC antibody (Bethyl Laboratories), and IgG was detected using a horseradish peroxidase-conjugated goat anti–human IgG antibody (BioSource International). O-Phenylenediamine dihydrochloride dissolved in stable peroxide substrate buffer (Pierce Chemical, Rockford, IL) was used as the substrate, and a Molecular Devices (Sunnyvale, CA) microplate reader was used to determine values. Standard curves were generated using known amounts of purified human Bence Jones λLC (Bethyl Laboratories) and purified human IgG (Jackson ImmunoResearch Laboratories, West Grove, PA). The detection limits of both assays range from 1 μg/mL to 0.1 ng/mL.
Fluorescence in situ hybridization and conventional cytogenetic studies
Fluorescence in situ hybridization (FISH) and conventional cytogenetic studies were performed as previously described.19 FISH probes used were CCND1/IGH, Rb1/LAMP1, p53/D17Z1, c-MYC break-apart, D3Z1/D7Z1, D9Z1/D15Z4, FGFR3/IGH, and IGH/c-MAF (Abbott Laboratories, Abbott Park, IL), and the IGH break-apart and IGH/MAFB probes were made and validated at Mayo Clinic. All FISH-digitized 2-color, clone-specific images were stored and/or printed by either the Vysis Smart Capture system, the Oncor Imaging System, or an Applied Imaging Cytovision system after capturing them using a Leica microscope equipped with a Cuho camera and a Ludl filter wheel.
Gene expression profiling and array CGH
Gene expression profiling (GEP) was performed using Affymetrix U133Plus2.0 Genechips (Affymetrix, Santa Clara, CA), and RNA quality was determined using the Agilent Bioanalyzer 2100 (Agilent Technologies, Palo Alto, CA). Comparison datasets were retrieved from the Multiple Myeloma Genomics Portal (http://www.broad.mit.edu/mmgp/pages/publicPortalHome.jsf) and the raw expression values were extracted from the postscanning data files (CEL files) with Expression Console V1.1 (Affymetrix) using the PLIER+16 method. MAFB expression levels were analyzed in the ALMC-1 and ALMC-2 cell lines relative to other human MM cell lines18,20-22 and in the primary patient cells relative to other patient MM cells.
High-resolution array comparative genomic hybridizations (aCGH) were performed on the samples using Human Genome 244A microarrays. This platform features 60-mer oligonucleotide probe lengths and probes are distributed at an average genomic interval of approximately 6 kb. Briefly, 1.2 μg of test (patient CD138+ cells or ALMC-1 or ALMC-2) and normal female reference (Promega, Madison, WI) were directly labeled with either Cy5 or Cy3 using the BioPrime Array CGH Genomic Labeling Module (Invitrogen) and purified using Microcon YM-30 filters (Millipore, Billerica, MA). The hybridization reactions containing equal amounts of test and reference DNA were hybridized to the microarray at 65°C for 40 hours in a rotation oven at 20 rpm. Slides were washed and scanned using an Agilent G256BA DNA microarray scanner. The spot intensities for each feature on the microarray were generated using Feature Extraction v9.5.3.1 (Agilent Technologies), and the resulting log2 ratio data were analyzed with CGH Analytics v3.5 (Agilent Technologies). Primary GEP and aCGH data are publicly available through the Multiple Myeloma Research Consortium Genomics Portal (http://www.broad.mit.edu/mmgp/pages/publicPortalHome.jsf under “Mayo Clinic Amyloid Project”).
LC structural analysis
ALMC-1- and ALMC-2-derived free LCs were purified, concentrated, and purity assessed as previously described.23 Secondary structure determinations using circular dichroism spectroscopy, and thermal and chemical denaturation was performed as previously described.23 Protein concentrations were 12.3 μM and 10 μM for the ALMC-1– and ALMC-2–derived λLC proteins, respectively. Protein samples with 0.5 M of Na2SO4 were equilibrated overnight at 4°C before data acquisition (protein concentrations for ALMC-1 and ALMC-2 were 20 μM and 9.5 μM, respectively). In chemical denaturation experiments, equilibrations of ALMC-1 λLC with 0 and 7.6 M urea and ALMC-2 λLC with 0 and 6.5 M urea were performed at 4°C overnight. For fibril formation, λLCs were incubated in a microcentrifuge tube at their Tm for 4 days as previously described23 ; 5 μL of each reaction was added to a 5 μM Thioflavine T (ThT) solution and checked on the PTI-QM2001 fluorometer (Photon Technology International, Lawrenceville, NJ) using an excitation wavelength of 450 nm following emission from 470 to 530 nm. Washed fibril samples were analyzed on a Philips Tecnai T12 transmission electron microscope.
Results
Immunoglobulin gene analysis
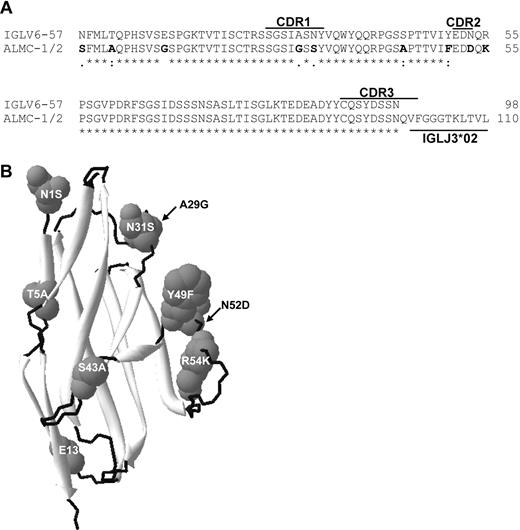
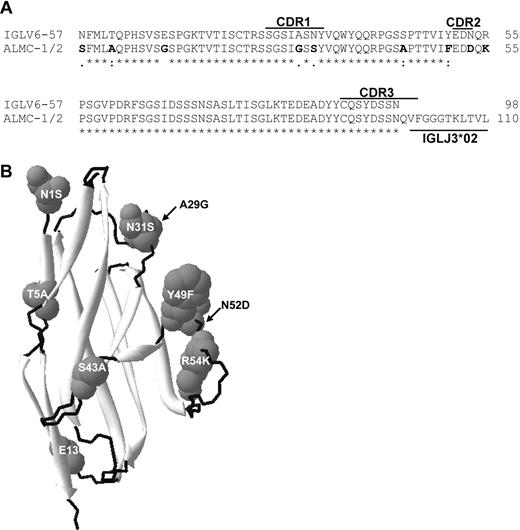
Sequence analysis of the IGL and IGH V region genes in both primary patient samples and both cell lines demonstrated that all 4 sequences were identical (data not shown), and specific genes used were IGLV6-57, IGLJ3, IGLC3, IGHV3-21, IGHD2-2, and IGHJ4b. The extent of somatic mutation was approximately 4% in both the IGHV and IGLV genes. Figure 1A compares the germ line amino acid sequence of IGLV6-57 with the ALMC sequence, and mutations are observed in CDR1 and CDR2, as well as the framework 1 region. Figure 1B depicts a structural model showing the location of each mutation based on the crystal structure of the IGLV6-57 protein Wil.24
ALMC λLC variable region amino acid sequence. (A) The amino acid sequence of the ALMC-1, ALMC-2, and primary patient PCs before and after PBSCT (designated ALMC-1/2) λLC variable region is shown relative to the germ line IGLV6-57 gene. (B) Model of the ALMC λLC variable region showing the location of each mutation based on the crystal structure of the lambda 6 IGLV protein Wil. The putative structural locations of each amino acid mutation are indicated, β sheets are shown in light gray, and loops are shown in black.
ALMC λLC variable region amino acid sequence. (A) The amino acid sequence of the ALMC-1, ALMC-2, and primary patient PCs before and after PBSCT (designated ALMC-1/2) λLC variable region is shown relative to the germ line IGLV6-57 gene. (B) Model of the ALMC λLC variable region showing the location of each mutation based on the crystal structure of the lambda 6 IGLV protein Wil. The putative structural locations of each amino acid mutation are indicated, β sheets are shown in light gray, and loops are shown in black.
Characterization of ALMC-1 and ALMC-2 cell line morphology and immunophenotype
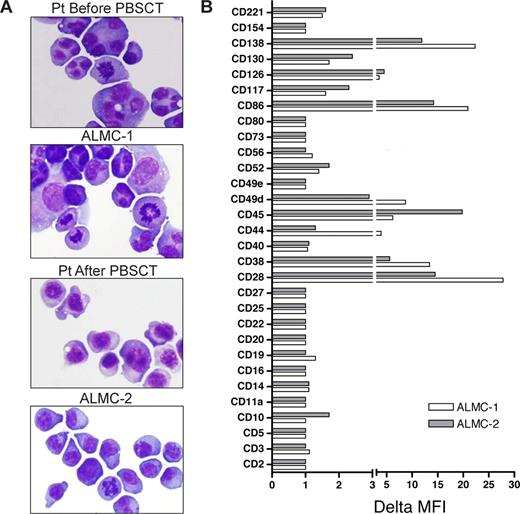
Both cell lines were similar to primary patient cells in that they displayed similar PC morphology with eccentrically located nuclei, a deeply basophilic cytoplasm, prominent nucleoli, and a perinuclear hof apparent in some of the cells (Figure 2A). The cell populations were primarily mononuclear, but binucleated and multinucleated cells are more frequent in the ALMC-1 cell line, a feature that was observed in the primary pre-PBSCT patient cells as well. The cells also exhibited a polymorphic appearance, which has remained constant with continued cell passage.
Characterization of ALMC-1 and ALMC-2 cell line morphology and immunophenotype. (A) Wright-Giemsa staining shows the typical plasmacytic features of the primary patient cells as well as both cell lines (original magnification ×60, Olympic Provus AX70 microscope). (B) A panel of antibodies was used to phenotype both cell lines by flow cytometry. Data reflect the ΔMFI as calculated by MFI of specific antibody/MFI of isotype matched control antibody.
Characterization of ALMC-1 and ALMC-2 cell line morphology and immunophenotype. (A) Wright-Giemsa staining shows the typical plasmacytic features of the primary patient cells as well as both cell lines (original magnification ×60, Olympic Provus AX70 microscope). (B) A panel of antibodies was used to phenotype both cell lines by flow cytometry. Data reflect the ΔMFI as calculated by MFI of specific antibody/MFI of isotype matched control antibody.
We next determined the immunophenotype of each cell line (Figure 2B). Consistent with PC maturation, both cell lines expressed CD38, CD49d, and CD13825-27 as well as CD28, CD45, and CD86. Low levels of the IL-6 receptor components, CD126 and CD130, and the IGF-I receptor (CD221) were expressed on both lines as were CD52 and CD117. Of interest, CD44 was only expressed by ALMC-1 cells, and CD10 was only dimly expressed on ALMC-2 cells.
Characterization of Ig secretion by ALMC-1 and ALMC-2 cells
We next measured cell line secretion of intact IgG as well as free LC (Table 1). In both experiments, the ALMC-2 cells displayed a higher rate of IgG and free λLC secretion per cell than did the ALMC-1 cells. IL-6 increased IgG secretion per cell in both lines but did not significantly modulate levels of secreted free λLC. Data shown in Table 2 indicate that each cell line is capable of significant production of free λLCs.
ALMC-1 and ALMC-2 cytokine responsiveness
Both cell lines proliferated significantly in response to IL-6 and IGF-I and to a lesser degree in response to tumor necrosis factor-α (Table 3). ALMC-2 cells, but not ALMC-1 cells, proliferated in response to oncostatin M, IFN-α, and IFN-γ. Both cell lines failed to proliferate in response to IL-1α, IL-1β, IL-3, IL-4, IL-10, IL-12, and IL-13 (data not shown). Lastly, using a sensitive PCR method that detects early Epstein-Barr virus–encoded RNA-1,28 both cell lines were negative for EBV (results not shown).
Karyotype and FISH analysis
We next determined the karyotypes of the 2 cell lines and primary patient cells (Table 4). Cytogenetic analyses classify this patient's tumor cells and both cell lines as being nonhyperdiploid (reviewed by Bergsagel and Kuehl29 ). It is interesting, however, that the ALMC-1 cell line is hypotetraploid, whereas the primary patient sample post-PBSCT as well as the ALMC-2 cell line were both hypodiploid. Although the pre-PBSCT sample largely contained hypodiploid PCs as well, there was evidence of a minor subpopulation of hypotetraploid cells as revealed using CEP probes specific for chromosomes 3, 7, 8, 11, and 15 (results not shown).
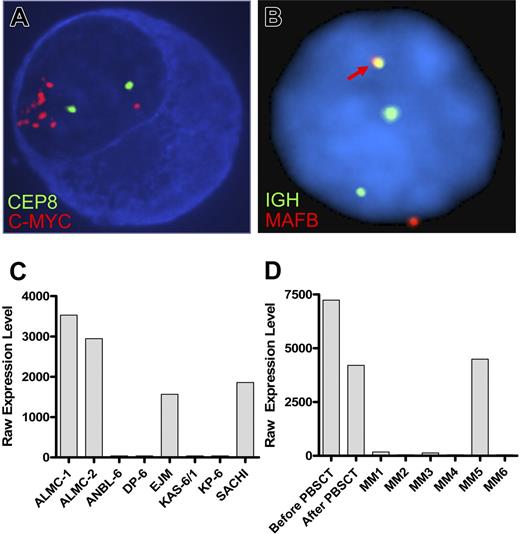
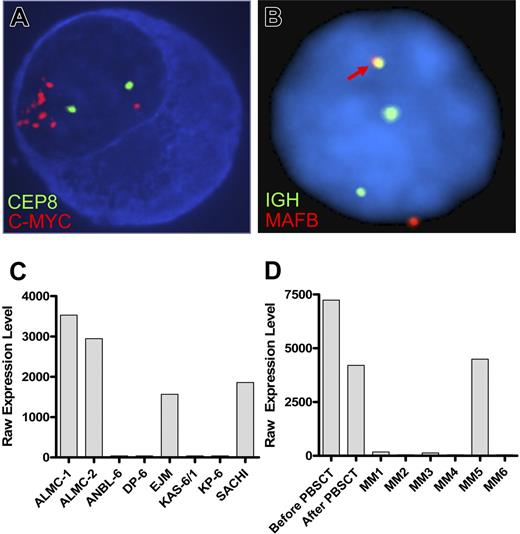
FISH analysis revealed that, at diagnosis, 30% of the patient plasma cells exhibited c-MYC amplification (Table 4). It is noteworthy that 100% of the primary patient cells post-PBSCT and 100% of the cells in both lines showed evidence of c-MYC amplification. Figure 3A depicts the striking amplification of c-MYC. A similar pattern emerged when we analyzed cells for p53 status using a p53/CEP 17 probe set (Table 4). Thus, 40% of the cells in the initial sample had a p53 deletion, whereas 100% of the PC found within the post-PBSCT sample and both cell lines exhibited a p53 deletion. Both cell lines displayed an IGH translocation as revealed by break apart of the 14q32 probe; however, this translocation did not involve chromosomes 4, 11, 16 (data not shown), but instead involved chromosome 20 (Figure 3B). Gene expression profiling analysis further corroborates this translocation and demonstrated substantially elevated levels of MAFB expression in both cell lines (Figure 3C) and both primary patient samples (Figure 3D). The EJM and SACHI MM cell lines exhibit a t(14;20), resulting in overexpression of MAFB,20,22 and the remaining lines tested are known to have IGH translocations that do not involve chromosome 20.
ALMC-1 and ALMC-2 cells exhibit c-myc amplification and a 14;20 translocation. (A) Representative cIg-FISH image of ALMC-1 cells showing c-MYC amplification. (B) Representative interphase FISH image of ALMC-2 cells demonstrating a 14;20 translocation. The fusion signal (arrow) resulting from comigration of the IGH and MAFB probes is consistent with a t(14;20). Original magnification ×100 (Leica DMRXA microscope, Wetzlar, Germany) for panels A and B. (C) MAFB expression levels in ALMC-1 and ALMC-2 cell lines relative to other MM cell lines that do or do not express a t(14;20). (D) MAFB expression levels in primary patient tumor cells relative to a number of other primary patient MM cells.
ALMC-1 and ALMC-2 cells exhibit c-myc amplification and a 14;20 translocation. (A) Representative cIg-FISH image of ALMC-1 cells showing c-MYC amplification. (B) Representative interphase FISH image of ALMC-2 cells demonstrating a 14;20 translocation. The fusion signal (arrow) resulting from comigration of the IGH and MAFB probes is consistent with a t(14;20). Original magnification ×100 (Leica DMRXA microscope, Wetzlar, Germany) for panels A and B. (C) MAFB expression levels in ALMC-1 and ALMC-2 cell lines relative to other MM cell lines that do or do not express a t(14;20). (D) MAFB expression levels in primary patient tumor cells relative to a number of other primary patient MM cells.
Array CGH analysis
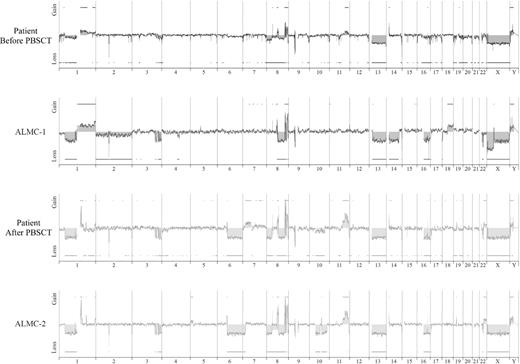
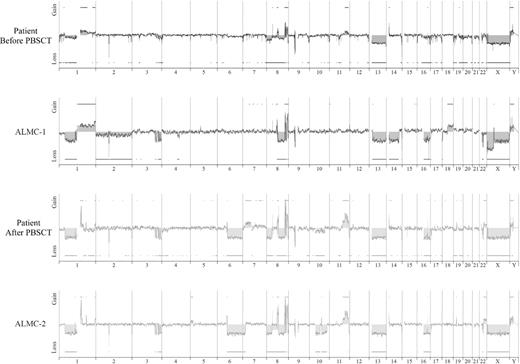
We next used array CGH, a methodology that permits a much higher resolution map of the 4 genomes than that achieved by conventional methods (Figure 4), to test the genetic relationship between the cell lines and the primary patient cells. This analysis permits 2 major conclusions. First, the data clearly demonstrate the overall similarity between the cell lines and the patient primary cells. Second, a number of genetic changes were acquired during the course of disease progression, including regional chromosomal gains in 1q, 11q, and 22q, and losses in 6q, 8p, 10p, and 10q, several of which have been associated with poor prognosis myeloma (reviewed by Tonon30 ). Of interest, 6q deletion is frequently observed in Waldenstrom macroglobulinemia and is associated with features of adverse prognosis.31
Genome-wide high resolution aCGH. Chromosomal copy number alterations across the pre-PBSCT, ALMC-1, post-PBSCT, and ALMC-2 cells are plotted for each probe evenly aligned along the x-axis in chromosomal order.
Genome-wide high resolution aCGH. Chromosomal copy number alterations across the pre-PBSCT, ALMC-1, post-PBSCT, and ALMC-2 cells are plotted for each probe evenly aligned along the x-axis in chromosomal order.
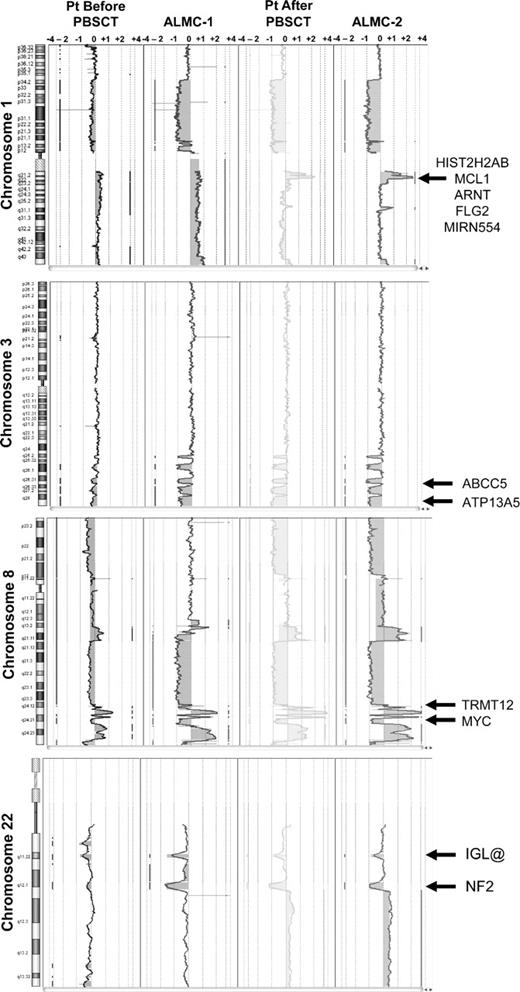
Although it is beyond the scope of this report to present a detailed analysis of all gains and losses, Figure 5 presents a more detailed view of chromosomes 1, 3, 8, and 22. Chromosome 1q21 is amplified only in the primary patient cells post-PBSCT and the ALMC-2 line. This region has a number of interesting genes that have been shown to play a role in other cancers, including the transcription factor, Arnt32 ; the Bcl2 family member, Mcl133 ; the micro RNA, MIRN55434 ; FLG2, a member of a family of genes whose products interact with intermediate filaments35,36 ; and the DNA-binding histone protein, HIST2H2AB.37 Several regions on chromosome 3 have undergone losses in all 4 samples tested and include ABCC5, a multidrug resistance gene,38 and ATP13A5, a lipid-transporting p-type ATPase.39 The transcription factor, TRMT12 (chromosome 8), has been shown to be amplified in breast carcinoma40 and is amplified in both primary patient samples and both cell lines (Figure 5). Finally, losses were also observed on chromosome 22 in all 4 samples. One of these regions includes the IGL locus and probably reflects genomic DNA lost on chromosome 22 during VJ rearrangement. Consistent with λLC expression, there is a biallelic loss of the κLC locus on chromosome 2p12 in all 4 samples studied (Figure 4). The second region of chromosome 22 loss highlighted involves the NF-2 gene, a known tumor suppressor gene.41,42 Collectively, these data demonstrate how closely the in vitro passaged cell lines resemble the primary patient cells. This analysis also demonstrates how the cell line established from the diagnostic marrow similarly evolved, albeit in vitro, in a way that largely mirrored in vivo evolution of the primary tumor.
Shared and emerging chromosome copy number abnormalities. Whole chromosome plots of chromosomes 1, 3, 8, and 22 are shown for the 4 samples. Arrows point out examples of gains or losses that appear uniformly across all 4 samples (chromosomes 3, 8, and 22), or are acquired during the course of disease progression (chromosome 1). The predicted number of gene copies is indicated on the top of each panel.
Shared and emerging chromosome copy number abnormalities. Whole chromosome plots of chromosomes 1, 3, 8, and 22 are shown for the 4 samples. Arrows point out examples of gains or losses that appear uniformly across all 4 samples (chromosomes 3, 8, and 22), or are acquired during the course of disease progression (chromosome 1). The predicted number of gene copies is indicated on the top of each panel.
Confirmation of protein structure and fibril formation
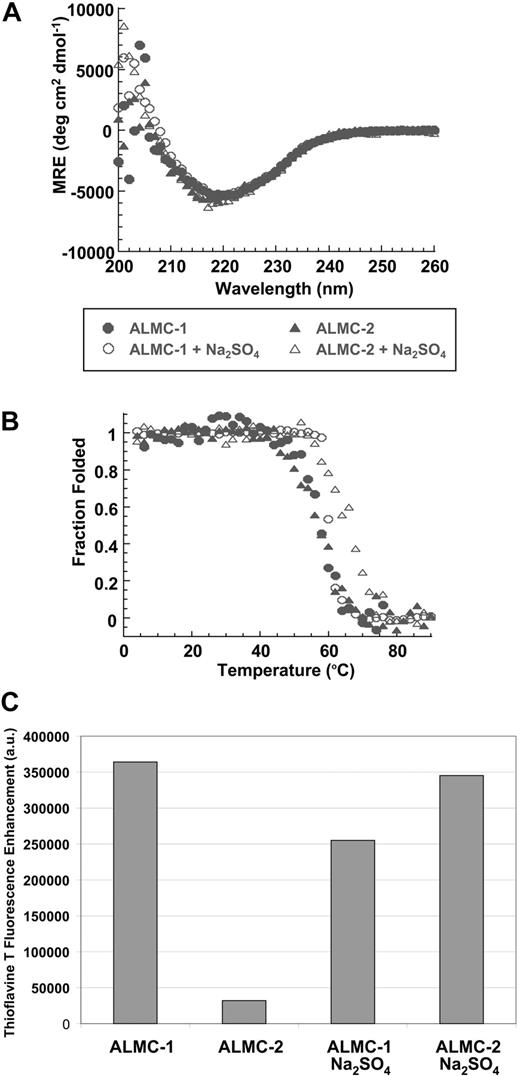
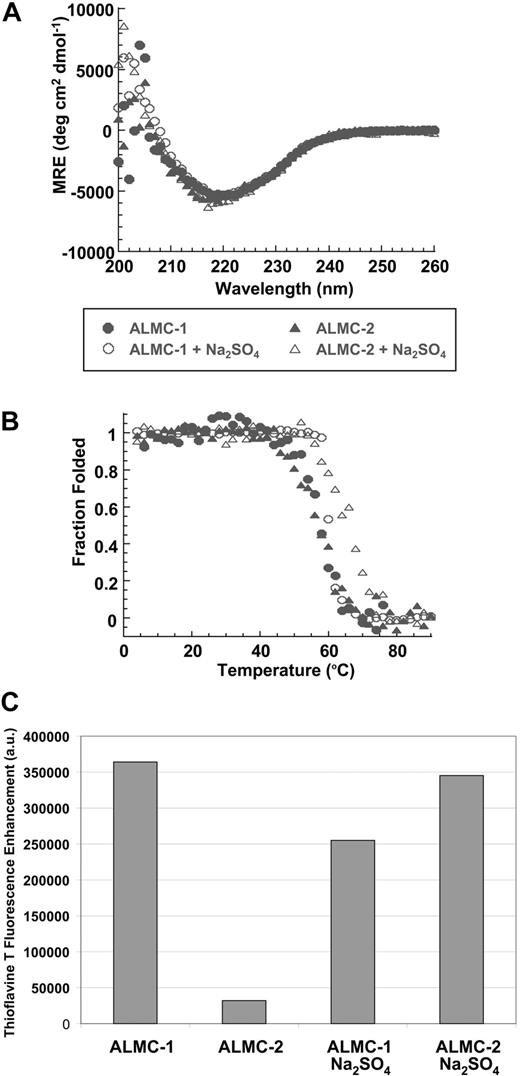
We studied the ability of the free λLC secreted by both cell lines to form fibrils in vitro. Both λLC proteins present the expected β sheet secondary structure of immunoglobulin proteins by Far UV-CD spectrum with a minimum observed at 218 nm, the value that is typical for a β sheet (Figure 6A). Figure 6B depicts the thermal denaturation experiments performed to calculate the melting temperature (Tm). An apparent 2-state unfolding transition was observed with a Tm for these proteins of 57.2°C (± 0.4°C) for ALMC-1 and 56.7°C (± 0.4°C) for ALMC-2. Neither protein was able to refold reversibly because of the precipitation that occurs at higher temperatures (data not shown), a behavior observed with other LC proteins.23 Chemical denaturation analysis of ALMC-1 λLC indicated a melting concentration of urea (Cm) of 3.1 M and ΔGfolding of −4.6 kcal/mol, whereas these values for the ALMC-2 λLC were a Cm of 2.9 M and ΔGfolding of −4.9 kcal/mol.
Confirmation of protein structure and fibril formation. (A) ALMC-1 and ALMC-2 display a β sheet conformation in the presence and absence of 0.5 M of Na2SO4 by Far UV-CD. (B) ALMC-1 and ALMC-2 λLC thermodynamic stability is slightly increased in the presence of 0.5 M of Na2SO4. (C) ALMC-1 and ALMC-2 endpoint ThT fluorescence fibril formation samples at their Tm. The excitation wavelength was 450 nm; emission wavelengths were 470 to 530 nm with a maximum fluorescence enhancement at 485 nm plotted for each sample with ThT baseline subtracted from them. Representative results from a single experiment are shown.
Confirmation of protein structure and fibril formation. (A) ALMC-1 and ALMC-2 display a β sheet conformation in the presence and absence of 0.5 M of Na2SO4 by Far UV-CD. (B) ALMC-1 and ALMC-2 λLC thermodynamic stability is slightly increased in the presence of 0.5 M of Na2SO4. (C) ALMC-1 and ALMC-2 endpoint ThT fluorescence fibril formation samples at their Tm. The excitation wavelength was 450 nm; emission wavelengths were 470 to 530 nm with a maximum fluorescence enhancement at 485 nm plotted for each sample with ThT baseline subtracted from them. Representative results from a single experiment are shown.
Na2SO4 is known to stabilize proteins and enhance their ability to form amyloid fibrils in vitro.43-45 The addition of 0.5 M of Na2SO4 did not change the secondary structure of either ALMC λLC proteins (Figure 6A). However, the addition of 0.5 M of Na2SO4 increased the Tm of both proteins by 3.5°C to 8.6°C (60.7°C ± 0.5°C for ALMC-1 and 65.3°C ± 0.4°C for ALMC-2; Figure 6B). Intriguingly, ALMC-1 λLC is less stable than ALMC-2 λLC in the presence of 0.5 M Na2SO4 in contrast with the results obtained in buffer alone. When we compared the stability of the ALMC-derived λLCs with previously characterized Bence Jones proteins obtained from patients with AL, light chain deposition disease, and MM,23 we observed that the stability of the ALMC proteins are indeed similar to other amyloidogenic LCs and distinct from nonamyloidogenic LCs (Table S1, available on the Blood website; see the Supplemental Materials link at the top of the online article).
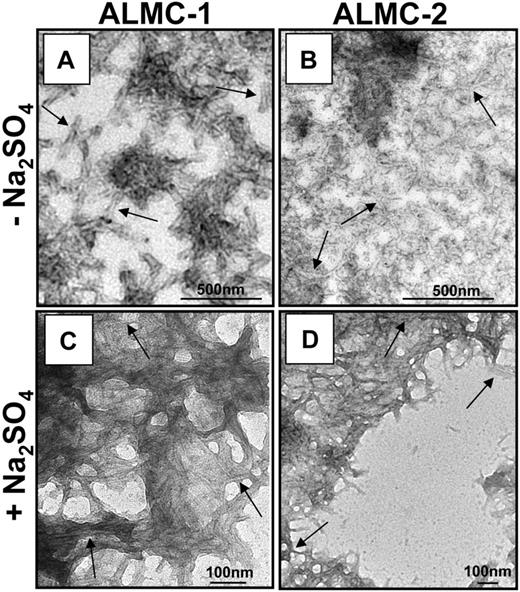
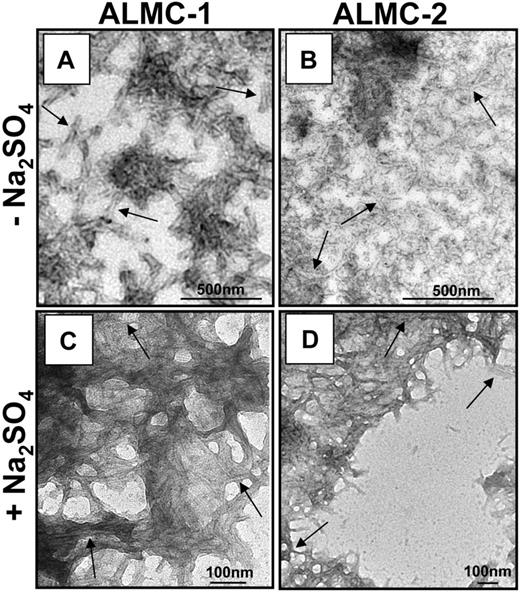
The proteins were then incubated at their respective Tm to maximize amyloid formation as previously observed with other proteins.43,45,46 ThT was added to the endpoint sample to determine whether there was enhanced fluorescence because of the presence of fibrils. ALMC-2–derived λLC exhibited slower kinetics of fibril formation in buffer alone, whereas the reactions of ALMC-2–derived λLC with Na2SO4 present marked enhancement in ThT fluorescence (Figure 6C). Although it appears that the presence of Na2SO4in ALMC-1 λLC reactions failed to further augment ThT fluorescence, this most probably reflects the faster kinetics of ALMC-1 λLC fibril formation of protein alone, so on Na2SO4 addition, considerable clumping occurred, which diminishes enhanced ThT fluorescence possibly because of an inner filter effect. Finally, electron microscopy (EM) demonstrated that both proteins after incubation at their Tm were able to form long, straight, unbranching fibrils (Figure 7 arrows) consistent with the morphology of amyloid fibrils, although Figure 7B (ALMC-2) shows smaller and narrower fibrils compared with Figure 7A (ALMC-1). Figure 7C,D demonstrates how the presence of Na2SO4 further enhances fibril formation in both samples, with considerable clumping observed in both ALMC samples.
Electron microscopic analysis of fibrils formed from ALMC-1 and ALMC-2 λLC. (A) ALMC-1 λLC. (B) ALMC-2 λLC (diluted 1:10). (C) ALMC-1 λLC in the presence of 0.5 M of Na2SO4 (1:10 dilution). (D) ALMC-2 λLC in the presence of 0.5 of M Na2SO4. Scale bars represent 500 nm for panels A and B and 100 nm for panels C and D. → highlights representative fibrils.
Electron microscopic analysis of fibrils formed from ALMC-1 and ALMC-2 λLC. (A) ALMC-1 λLC. (B) ALMC-2 λLC (diluted 1:10). (C) ALMC-1 λLC in the presence of 0.5 M of Na2SO4 (1:10 dilution). (D) ALMC-2 λLC in the presence of 0.5 of M Na2SO4. Scale bars represent 500 nm for panels A and B and 100 nm for panels C and D. → highlights representative fibrils.
Discussion
In this study, we describe the characterization of 2 sister cell lines derived from the same patient at different stages of disease. We have also extensively characterized the immunophenotype, cytokine responsiveness, properties of the amyloidogenic λLC, and molecular genetics. Our ability to study the genetics of both cell lines and how this relates to the primary patient cells during the course of disease progression has allowed us to directly demonstrate clonal evolution in this patient. Our analyses also provide an abundance of information that may have utility in not only identifying the molecular changes prevalent in AL, but also in understanding the genetic events that accompany progression to symptomatic MM. To our knowledge, this is the first establish-ment of cell lines from primary patient plasma cells secreting amyloidogenic LC.
As discussed in “Introduction,” the specific λLC V region genes IGLV3-1 (3r) and IGLV6-57 (6a) are involved in 40% of all AL patients (reviewed by Rajkumar et al6 and Gertz et al47 ), and the IGLV6-57 gene is almost invariably associated with AL.48-50 Of interest, sequence analysis determined that the IGLV6-57 gene was used in both cell lines and primary patient cells. Although it remains unclear as to why fibril formation by this particular LC is frequently observed, it has been suggested that mutations in the framework regions may be more effective at disturbing LC folding than mutations acquired in the complementarity determining regions (reviewed by Bellotti et al3 ). Of note, ALMC λLCs deviate from the germ line sequence by 9 amino acids, 6 of which are located outside of either CDR1 or CDR2. The ALMC cells also use the IGLJ3 and IGLC3 genes and therefore are strikingly similar to 2 previously described IGLV6-57 amyloidogenic LCs.51
We also demonstrated that secreted free λLCs from both cell lines are capable of forming fibrils in vitro. Although the fibrils detected in our EM analysis were somewhat wider in diameter than those previously reported by others,43,52,53 it should be noted that EM structural analysis of amyloidogenic LCs is typically performed using only the VL domain. In contrast, we performed EM analyses of LC proteins containing both the variable and constant domains. Because of the difficulty encountered in imaging thin fibrils when using full-length LC protein, it has been suggested that the constant domain may alter the way the fibrils interact. There is precedence for this in a yeast prion system.54 Thus, whereas the full-length form of an infectious protein (URE3) did not polymerize, a fragment of this protein formed thin amyloid fibrils and could seed polymerization of the full-length protein to form thicker, less regular filaments. Moreover, it has been reported that in vitro amyloid formation by LCs produced by some myeloma cells only occurs after partial hydrolysis.55 Taken together, our observations that full-length ALMC-derived LCs formed in vitro amyloid fibrils is impressive and may suggest the presence of low levels of VL fragments that catalyze formation of the observed thicker fibrils (Figure 7). The ALMC proteins also behave like other urine-derived Bence Jones proteins23 with respect to their Tm and Cm values. However, the ΔGfolding (ΔG (H20))values for the ALMC proteins are slightly higher than observed for amyloidogenic Bence Jones proteins, which means that from the point of view of free energy of folding, ALMC proteins are slightly more stable and require slightly more energy to unfold them. Even though the mechanisms underlying the thermodynamic differences between the different proteins are not completely understood, the use of different constant regions by λ proteins together with the λ6A germ line donor sequence may have a unique effect on increasing the overall free energy of folding.
Although both cell line–derived free λLCs formed fibrils in vitro, the ALMC-1–derived λLC was slightly less stable than the ALMC-2–derived λLC in the presence of 0.5 M of Na2SO4. Given the absolute identity in primary amino acid sequence of the IGLV gene in both cell lines, this is an unexpected result but has interesting implications. There is precedence for intracellular amyloid formation in myeloma cells, suggesting that the intracellular environment of the PC may facilitate amyloidogenic LC misfolding.56-58 However, we have thus far failed to observe intracellular amyloid fibrils in either cell line (results not shown). Despite the absolute IGHV and IGLV clonal relationship between the ALMC-1 and ALMC-2 cells, additional genetic analyses identified a number of differences, albeit fewer than anticipated, between the 2 cell lines. It remains plausible, therefore, that the ALMC-1 cells uniquely or quantitatively express more of a gene product(s) that results in a posttranslational modification(s) affecting stability of the ALMC-1–derived free λLC that was not detectable using the methods used to determine purity. Indeed, many factors influence protein aggregation (reviewed by Demeule et al59 ). The ALMC-2 cell line secreted both intact IgG and free λLC at a greater rate than did ALMC-1 cells. It was also interesting that IL-6 significantly enhanced intact IgG secretion in both cell lines, whereas it had a modest effect in reducing the amount of secreted free λLC, particularly in the ALMC-1 cells. This implies that heavy chain (HC) is limiting for secretion of intact IgG and that IL-6 may increase expression of Ig HC, but not Ig LC. This result also suggests that the presence of the HC may act as a chaperone of the toxic amyloidogenic LC, protecting against amyloidogenesis.
Because of the fortuitous establishment of the 2 cell lines before and after the patient received a PBSCT, we had the unique opportunity to study genetic events occurring during disease progression. Although malignant PCs obtained from both AL and MM patients are quite heterogeneous between patients, our analysis shows, for the first time, that the genetics within a patient, even during disease progression, are relatively stable. Moreover, our studies demonstrate that the cell lines are remarkably similar to the primary patient cells, underscoring the utility of both cell lines as model systems for further study of AL and MM.
Using FISH, we not only demonstrated that the ALMC-1 cell line evolved in vitro such that 100% of the cells displayed c-myc amplification and p53 deletion, but that intriguingly, the primary patient cells also evolved in vivo to acquire uniform display of these 2 abnormalities post-PBSCT. These data suggest that the increased frequency of these abnormalities gave both the ALMC-1 cells and the primary malignant PCs a growth advantage.
ACGH analysis also clearly demonstrated the clonal relationship between both cell lines and primary patient cells. Others have used this technology to investigate the genetics of myeloma,60-62 and Carrasco et al60 reported that more than 50% of MM tumors and MM cell lines exhibit chromosomal gains of the 1q21.1-1q22 region. It is noteworthy that a 1q21.1-1q22 gain was only observed in the post-PBSCT primary patient cells and the ALMC-2 cell line. Given that this sample was obtained after this AL patient progressed to symptomatic MM, these results suggest that one or more genes in this area may have been important in disease progression. Another chromosomal region frequently gained in MM is 8q24.21-8q24.360 ; however, this genetic abnormality was observed in this patient's malignant PCs before MM progression. Chromosome 3 displays an interesting set of regional chromosomal deletions that appear to be constant throughout the course of this patient's disease. In contrast to the chromosome 1 and 8 regional abnormalities, deletions in this region of chromosome 3 have not been commonly reported in MM.60
The ALMC cells are characterized by a t(14;20) translocation, which results in overexpression of the bZip transcription factor family member, MAFB. This IGH translocation was first described by Hanamura et al.63 MAFB expression in hematopoietic cells is restricted to myeloid lineage cells and has been shown under overexpression conditions to function as an oncogene and to transform cells.64 The precise role that MAFB expression plays in malignant PCs remains unknown; however, we are currently investigating the functional significance of MAFB overexpression in ALMC-1 and ALMC-2 cells, as well as whether there are additional genes on chromosome 20 whose expression is modulated by the IGH translocation.
In conclusion, we describe for the first time the establishment of 2 novel sister cell lines naturally secreting amyloidogenic λLCs. A long existing challenge in the study of AL has been the lack of a convenient and renewable source of amyloidogenic LCs. Purification of primary patient material has a number of limitations, and the alternative of generating recombinant Ig variable domains using bacterial expression systems5 necessarily precludes simultaneous biologic studies of the amyloidogenic LC secreting malignant plasma cells. The ALMC-1 and ALMC-2 cell lines circumvent these limitations. These cell lines also hold great promise for development of a needed animal model system of AL, and studies of this nature are currently underway. Both cell lines may also provide an in vitro model system to prescreen the activity of therapeutic compounds that inhibit amyloid fibril formation.65,66 Finally, fortuitous establishment of 2 cell lines from a single patient diagnosed first with AL, and later with MM, has allowed the identification of a number of candidate genes associated with disease progression that deserve additional study. Collectively, these studies validate use of human malignant PC lines as models that permit new insight into 2 diseases that generally have fatal outcomes.
The online version of this article contains a data supplement.
The publication costs of this article were defrayed in part by page charge payment. Therefore, and solely to indicate this fact, this article is hereby marked “advertisement” in accordance with 18 USC section 1734.
Acknowledgments
This work was supported by the National Institutes of Health, Bethesda, MD (CA062242, D.F.J.; and GM071514, M.R.-A.) and the Robert A. Kyle Hematologic Malignancies Program (Mayo Clinic).
National Institutes of Health
Authorship
Contribution: M.R.-A., R.F., and D.F.J. designed research; B.K.A., L.A.S., J.J.K., G.J.A., R.A.K., E.M.M., and R.C.T. performed research; B.K.A., L.A.S., J.J.K., G.J.A., R.A.K., E.M.M., and R.C.T. collected data; M.R.-A., J.J.K., A.D., R.F., R.P.K., X.W., S.R.Z., and D.F.J. analyzed and interpreted data; and B.K.A. and D.F.J. wrote the paper with input from all authors.
Conflict-of-interest disclosure: The authors declare no competing financial interests.
Correspondence: Diane F. Jelinek, Department of Immunology, Guggenheim 4, College of Medicine, Mayo Clinic, 200 First Street SW, Rochester, MN 55905; e-mail: jelinek.diane@mayo.edu.

