Abstract
Comparison of normal erythroblasts and erythroblasts from persons with the rare In(Lu) type of Lu(a-b-) blood group phenotype showed increased transcription levels for 314 genes and reduced levels for 354 genes in In(Lu) cells. Many erythroid-specific genes (including ALAS2, SLC4A1) had reduced transcript levels, suggesting the phenotype resulted from a transcription factor abnormality. A search for mutations in erythroid transcription factors showed mutations in the promoter or coding sequence of EKLF in 21 of 24 persons with the In(Lu) phenotype. In all cases the mutant EKLF allele occurred in the presence of a normal EKLF allele. Nine different loss-of-function mutations were identified. One mutation abolished a GATA1 binding site in the EKLF promoter (−124T>C). Two mutations (Leu127X; Lys292X) resulted in premature termination codons, 2 (Pro190LeufsX47; Arg319GlufsX34) in frameshifts, and 4 in amino acid substitution of conserved residues in zinc finger domain 1 (His299Tyr) or domain 2 (Arg328Leu; Arg328His; Arg331Gly). Persons with the In(Lu) phenotype have no reported pathology, indicating that one functional EKLF allele is sufficient to sustain human erythropoiesis. These data provide the first description of inactivating mutations in human EKLF and the first demonstration of a blood group phenotype resulting from mutations in a transcription factor.
Introduction
Erythroid differentiation is a highly regulated process involving numerous transcription factors, including GATA1 and EKLF.1-3 GATA1 binds to EKLF to form a functional unit.4,5 Absence of GATA1 in mice causes embryonic death from severe anemia because of maturation arrest and apoptosis of erythroid progenitor cells.6 In mice, EKLF is not required for the proliferation of erythroid progenitors but is essential for terminal differentiation of erythroid cells because it activates essential erythroid genes.7,8 Mice lacking EKLF die in utero around embryonic day 14 from severe anemia associated with β-globin deficiency, whereas heterozygous Eklf+/− mice develop normally.9 These data suggest homozygous inheritance of inactivating mutations affecting EKLF expression in humans would be incompatible with postembryonic life, although heterozygous inheritance of inactivating EKLF mutations would be viable. Nevertheless, inactivating mutations in human EKLF have not been previously reported.
The blood group phenotype Lu(a-b-) is known to arise from 3 distinct genetic backgrounds: homozygosity for inactivating mutations in the Lutheran gene,10,11 inheritance of an X-linked suppressor gene (XS2),12 and inheritance of an autosomal suppressor gene InLu.13 Inheritance of XS2 has been reported in only one family.12 In contrast, inheritance of InLu is relatively common, occurring with a frequency of approximately 1 in 3000 blood donors in South-East England14 and 1 in 5000 of South Wales blood donors.15 To elucidate the molecular mechanism giving rise to the In(Lu) type of Lu(a-b-) we compared the transcriptome of normal and In(Lu) erythroblasts at different stages of maturation and hypothesized that the differences observed could result from a mutated erythroid transcription factor. Sequencing of several erythroid transcription factor genes showed heterozygous inheritance of loss-of-function mutations in EKLF in 21 of 24 In(Lu) donors. This report identifies the first mutations in human EKLF, explores their likely molecular consequences, and shows the viability of the EKLF+/− genotype in humans.
Methods
Cell culture and flow cytometry
Waste buffy coat material from anonymous blood donors was made available from the National Blood Service (Tooting, United Kingdom) and the Welsh Blood Service (Cardiff, United Kingdom). This provision complies with the Nuffield Council on Bioethics Guidance on Human Tissue Ethical and Legal Issues 1954, the Medical Research Council's Operational and Ethical Guidance on Human Tissue and Biological Samples for use in Research 2005, and the Royal College of Pathologists Transitional Guidelines to facilitate changes in procedures for handling “surplus” and archival material from human biologic samples. Informed consent was obtained in accordance with the Declaration of Helsinki.
Waste buffy coat material was provided with informed consent from 4 blood donors with the In(Lu) phenotype (InLu1-4) and 4 controls (Con1-4) matched for age, sex, and ethnicity by the Welsh Blood Service, Cardiff, and the National Blood Service, Tooting, and made anonymous for the purposes of this study. CD34+ cells were isolated by positive selection with the MiniMACS magnetic bead system according to the manufacturer's instructions (Miltenyi Biotec, Auburn, CA). Erythroid progenitor cells were obtained by ex vivo culture of CD34+ cells, as described by Fricke et al.16 In(Lu) and matched control cells were grown in parallel. Cells were harvested during culture for analysis by flow cytometry and for freezing and storage at −70°C in RNAlater (Ambion, Austin, TX). Cells from an additional In(Lu) sample (InLu5) and an unmatched control (Con5) had previously been cultured and stored in RNAlater.
Cultured erythroid progenitor cells were analyzed by flow cytometry after labeling with mouse monoclonal antibodies: anti-RhAG (LA1818), anti-GPA (BRIC256), anti-Band 3 (BRIC6), and a blend of anti-Lub (BRIC108) and anti-Lu (BRIC221), detecting epitopes on domain 1 and domain 4 of the Lutheran glycoprotein, respectively. All BRIC antibodies were provided by the International Blood Group Reference Laboratory (IBGRL, Bristol, United Kingdom). Isotype controls (Dako UK, Ely, United Kingdom) were tested in parallel. Bound antibody was detected by adding RPE-conjugated F(ab′)2 anti–mouse globulin (Dako UK) and the geometric mean (FL2) was recorded for each test. Flow cytometry was performed on a FC500 flow cytometer and analyzed with CXP software (Beckman Coulter, Fullerton, CA).
RNA isolation
A minimum of 1.5 × 10⁶ erythroid cells were harvested every few days from day 4 to day 14 of culture and frozen in RNALater (Ambion). Total RNA was isolated using the RNeasy Mini Kit (Qiagen, Crawley, United Kingdom), including an on-column DNaseI digestion, according to the manufacturer's instructions. RNA yield was determined using the RiboGreen RNA Quantitation Kit (Invitrogen, Paisley, United Kingdom).
Transcriptomics
Two In(Lu) samples (InLu3 and InLu4) and their matched controls (Con3 and Con4) were analyzed by microarrays using cells from day 6 and day 11 of culture. Cells from day 4 from InLu3 and Con3 were also analyzed.
Total RNA (8-10 μg) was supplied to the University of Bristol Transcriptomics Facility. Quality of the total RNA samples and the resulting cRNA was checked with the use of a 2100 Bioanalyser (Agilent Technologies, Palo Alto, CA). Fragmented biotinylated cRNA was prepared and 15 μg was hybridized to each of 2 HG-U133A GeneChips (ie, 2 technical replicates of each) according to the manufacturer's recommended protocols (Affymetrix, Santa Clara, CA). Single Array Expression Analysis was performed using the Affymetrix GeneChip Operating Software. A global scaling strategy was used to give a target intensity of 500 for each array. Arrays were only included for further analysis if they complied with the quality control metrics defined by Affymetrix.17
Data from all 20 arrays were filtered in Microsoft Excel (Microsoft, Redmond, WA) to exclude all probe sets called either Absent or Marginal in all arrays. Control probe sets with the prefix AFFX were also removed before subsequent data analysis. Filtered data were imported into GeneSifter software (VizX Labs, Seattle, WA), transformed to a log2 scale and analyzed to determine differentially expressed genes. Day 6 and day 11 data were analyzed by balanced 2-way ANOVA. Day 4 data were analyzed by unpaired t test. A 1.5-fold change threshold and test statistic of P value less than .05 were used for both datasets. Gene Ontology terms showing enrichment were identified with the Z-score Report function of the software.
Quantitative real-time polymerase chain reaction
Total RNA (1 μg) from each harvested erythroid cell sample was converted to cDNA using SuperScript II reverse transcriptase according to the manufacturer's instructions (Invitrogen).
Differentially expressed genes were analyzed by quantitative real-time polymerase chain reaction (Q-PCR). Amplification of LU, CD44H, AHSP, and SLC4A1 used primers designed with Primer Express software v2.0 (Applied Biosystems, Foster City, CA). Sequences were as follows: LU, 5′-CCCCCAACAAAGGGACACT-3′ and 5′-TTGCGATACCACGTGATCTTG-3′; CD44H, 5′-CACAGACAGAATCCCTGCTACCA-3′ and 5′-TCCCATGTGAGTCCATCTGAT-3′; AHSP, 5′-GTTAGACCTGAAGGCAGATGGC-3′ and 5′-GAGGATCATTGAAGACCTGCTGA-3′; SLC4A1, 5′-GGATTTCTTCATTCAGGATACCTACAC-3′ and 5′-CCCCGGGCTGAGGAGTT-3′ and probe, 5′FAM-AAACTCTCGGTGCCTGATGGCTTCAAG-3′TAMRA. Amplification of SLC4A1 required TaqMan Universal PCR Master Mix, whereas the remaining amplifications used SYBR Green PCR Master Mix (Applied Biosystems). Primers for AHSP and SLC4A1 were kindly provided by Dr K. Finning (IBGRL). ALAS2, HBB, and PABPC1 gene amplifications were performed with the use of TaqMan Universal PCR Master Mix and inventoried TaqMan Gene Expression Assays (Applied Biosystems).
Q-PCR was performed on the ABI 7000 Sequence Detection System (Applied Biosystems) with the following conditions: 50°C for 2 minutes and 95°C for 10 minutes, followed by 45 cycles of 95°C for 15 seconds and 60°C for 60 seconds. All reactions were performed in triplicate.
Target gene expression was normalized to PABPC1 expression and compared with a calibrator sample (UR/FL; cDNA prepared from equal amounts of human Universal Reference RNA and fetal liver RNA [Clontech, Mountain View, CA]) using the Pfaffl method of relative quantification as described in the Bio-Rad Real-Time PCR Applications Guide.18 PABPC1 was used as a control for gene amplification because it has been shown by microarrays to have consistent expression in our erythroid cultures (B.K.S., unpublished data, July 1, 2005).
Genomic DNA
Genomic DNA (gDNA) was extracted from 1 × 10⁶ cells from each erythroid culture using the QIAamp DNA Blood Mini Kit (Qiagen). Additional samples from persons with the In(Lu) phenotype (InLu6-24) were obtained from archived gDNA or prepared from archived cryopreserved red blood cells (available in house). Control gDNA from 32 random blood donors (Con6-37) was kindly provided by Dr V. Karamatic Crew (Bristol Institute for Transfusion Sciences).
PCR
PCR was used to amplify human EKLF cDNA (Entrez Accession no. NM_006563.2) and exons from gDNA (Entrez Accession no. NT_086897.1: complement of region 4090501-4093981). PCR primers were designed with Primer Express software v2.0 (Applied Biosystems). EKLF cDNA was amplified using 2 overlapping pairs of primers: 5′-AGTTCACGAGGCAGCCGAG-3′ and 5′-CCGGGTCCCAAACAACTCA-3′; 5′-GCACTTCCAGCTCTTCCGC-3′ and 5′-CTTGTCCCATCCCCAGTCACT-3′. Two additional primers were also used for sequencing: 5′-CCGAGACTCTGGGCGCATA-3′ and 5′-ACCCAAAAGCCCAGCCAC-3′. PCR reactions contained 1 U Expand DNA polymerase with 1.5 mM MgCl2 and 1 times buffer (Expand High Fidelity PCR system; Roche, Mannheim, Germany), 200 μM dNTPs (GE Healthcare, Chalfont St Giles, United Kingdom), 500 nM each primer (Sigma-Aldrich, St Louis, MO) and 1 times PCRx Enhancer solution (Invitrogen). Amplification was performed using the GeneAmp PCR system 9700 (Applied Biosystems) with a Touchdown PCR profile as follows: 95°C for 5 minutes then 9 cycles of 95°C for 30 seconds, 70°C for 30 seconds, 72°C for 1 minute, with a drop in annealing temperature of 2°C per cycle (to 54°C). This was followed by 35 cycles of 95°C for 30 seconds, 52°C for 30 seconds, 72°C for 1 minute with a final extension at 72°C for 10 minutes.
EKLF exon 1 and 286 bp (base pairs) of promoter sequence was amplified from gDNA using primers 5′-TTACCCAGCACCTGGACCCT-3′ and 5′-GAACCTCAAACCCCTAGACCACC-3′ with the same conditions as for cDNA plus the addition of 2 times PCRx Enhancer solution (Invitrogen). EKLF exon 2 was amplified with 2 overlapping pairs of primers: 5′-GTGTCCAGCCCGCGATGT-3′ and 5′-CCGGGTCCCAAACAACTCA-3′; 5′-CCGAGACTCTGGGCGCATA-3′ and 5′-GCCCTCTGCAACCCTTCTTC-3′ with the same conditions as described for cDNA amplification. Exon 3 was amplified using primers 5′-TGCGGCAAGAGCTACACCA-3′ and 5′-CTTGTCCCATCCCCAGTCACT-3′ and required the addition of 2 times PCRx Enhancer solution (Invitrogen). Primers described for the amplification of EKLF cDNA were also used as gDNA sequencing primers, as appropriate.
gDNA derived from random blood donors was amplified as described except for the following modifications: exon 1 amplification used 0.625 U GoTaq Flexi DNA polymerase with its own buffer (Promega, Southampton, United Kingdom) and without PCRx Enhancer solution, and exons 2 and 3 used 1 U AccuPrime GC-Rich DNA polymerase with Buffer A (Invitrogen), also without PCRx Enhancer solution.
PCR products were purified using either the Qiaex II Gel Extraction Kit or QiaQuick PCR Purification Kit (Qiagen) and sequenced on both strands using the ABI-PRISM 3100 Applied Biosystem automated DNA sequencer (Applied Biosystems).
Details of primer sequences and PCR conditions used for the amplification and sequencing of other erythroid transcription factor genes (GATA1, FOG1, GFI1B, TAL1, SPI1, MYB, MZF1) are available on request.
Homology modeling
A homology model was constructed of the EKLF zinc finger domains in complex with a duplex oligodeoxynucleotide (5′-TTCCACACCCT-3′), based on the crystal structure of a Zif268-DNA complex (PDB ID 1AAY).19 The protein sequences are 44% amino acid identical with one insertion of 2 residues in EKLF. The initial protein model was constructed using Modeller20 to mutate the Zif268 sequence to EKLF; all other molecular modeling operations were performed with SYBYL7.3 (Tripos, St Louis, MO). The initial DNA model was constructed by manual mutation of DNA from the Zif268 structure. The 2 initial models were merged, and steric clashes between protein and DNA were relieved by manual alteration of amino acid side chain conformations. Three layers of water were then added to the complex and subsequently iteratively minimized to convergence using the Amber99 force-field21 while constraining the coordinates of the macromolecular atoms. During subsequent rounds of energy minimization the positional constraints on the macromolecular components were incrementally removed from the protein side chains, then the protein backbone, and finally the DNA. Molecular geometry was assessed with MolProbity22 and NUCheck.23 Areas with poor geometry were manually adjusted, and the solvation and energy minimization procedures were repeated. Models of 3 EKLF variants (Arg328Leu, Arg328His, and Arg331Gly) were constructed by mutation of the native EKLF model and repetition of the minimization process. All final models did not contain any Ramachandran outliers and were ranked by MolProbity within the 85th percentile of crystallographic structures determined at approximately 2-Å resolution.
Results
Transcription is altered in erythroblasts from cultures of In(Lu) cells
Transcriptional differences between control and In(Lu) erythroid cells at days 6 (pronormoblasts) and 11 (normoblasts) of ex vivo culture were determined by microarray analysis using RNA obtained from cultured erythroblasts. A balanced 2-way ANOVA was used to look for genes differentially expressed between the 2 cell types and between the 2 days tested. The data discussed in this article were deposited in NCBI's Gene Expression Omnibus (GEO, http://www.ncbi.nlm.nih.gov/geo/) and are accessible through GEO Series accession no. GSE10584.
Analysis of control and In(Lu) transcript levels showed 373 genes with increased levels between day 6 and day 11 and 389 with decreased levels. The same genes were affected in control and In(Lu) erythroblasts. Selected results are displayed in Table S1 (available on the Blood website; see the Supplemental Materials link at the top of the online article). As expected, many genes involved in hemoglobin synthesis or encoding blood group antigens were found to increase their expression. Genes involved in antigen processing and presentation showed decreased expression, in keeping with the flow cytometric findings of Southcott et al.24 Further inspection of the data showed significant differences between control and In(Lu) erythroblasts with respect to the magnitude of transcript levels. In In(Lu) samples, 314 genes had higher expression than in controls and 354 had lower expression at day 6, or at day 11, or both. Gene expression between days 6 and 11 of cultured In(Lu) cells showed the same qualitative pattern seen with controls but marked differences regarding the levels of gene expression (Table 1). Genes with decreased expression during erythropoiesis (eg, the major histocompatibility complex [HLA] genes) showed higher expression in the In(Lu) cells, whereas erythroid-specific genes (eg, delta-aminolevulinate synthase 2 [ALAS2], α-hemoglobin stabilizing protein [AHSP], and glycophorin A [GPA]) showed lower expression, suggesting that the pattern of gene expression in In(Lu) cells is less capable of promoting erythroid maturation. Flow cytometric analysis of In(Lu) cells (donor InLu2) from day 8 of culture showed reduced surface expression of GPA, Band 3, and Lutheran (mean fluorescence intensity 106.4, 1.9, and 0.6, respectively, compared with control [Con2] values of 172.5, 5.6, and 11.6, respectively), suggesting that reduced transcript levels are reflected in the cell surface phenotype. The differences between In(Lu) and control cells were most apparent on day 6 when almost all erythroid-specific genes show a difference between the In(Lu) and the control cells. The only exceptions are the genes for the basal cell adhesion molecule (BCAM) that carries the Lutheran blood group antigens and CD44 that carries the Indian blood group antigens. These genes show a greater difference change at day 11. This is of particular interest because the expression of these blood group antigens on the surface of red blood cells is known to be suppressed in persons with the In(Lu) phenotype.13,25,26
We reasoned that, if gene expression profiles at day 6 showed a relative reduction in transcription of erythroid genes in In(Lu) cells, then this effect might be even more apparent earlier in the cultures. cRNA derived from day 4 cells from one pair of control and In(Lu) cultures were hybridized to arrays (2 technical replicates of each). Microarray data were analyzed by unpaired t test and the results showed 378 genes with at least a 1.5-fold difference in expression between the 2 cell types (P < .05). Selected results are shown in Table S2. The 159 genes up-regulated in In(Lu) cells at day 4 again involved the defense response and antigen processing and presentation. Two hundred nineteen genes were down-regulated, and, as at day 6, these contained genes for hemoglobin synthesis and erythroid-specific factors. The transcript for ALAS2 showed a greater reduction at day 4 than at the later days (down 12.5-fold at day 4 compared with 2-fold at day 6 and no change at day 11). ALAS2 is an enzyme that catalyzes the first step of heme synthesis. This first step is rate limiting, and so the reduction in expression may be expected to have severe consequences for heme and hence hemoglobin production. At day 4 reduced expression of α- and β-globin transcripts is also apparent. This was not seen at the later time points. Furthermore, expression of RNA encoding the erythrocyte anion exchanger (SLC4A1, also known as Band 3) also shows a much greater reduction at day 4 compared with later days (ie, down 18.8-fold at day 4, 3.1-fold at day 6, and only 1.1-fold at day 11). The greater differences in expression of these erythroid-specific genes at the earlier time point are consistent with our initial observation that erythroid cells from persons with the In(Lu) phenotype are less able to promote erythroid maturation at the transcriptional level.
Validation of microarray data by Q-PCR
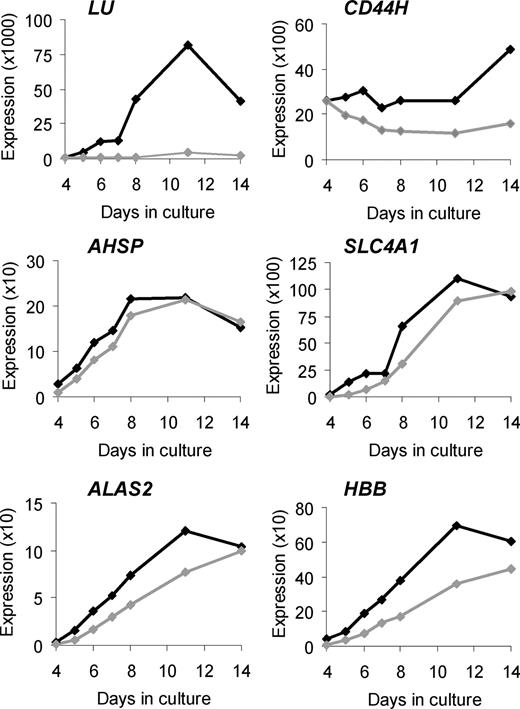
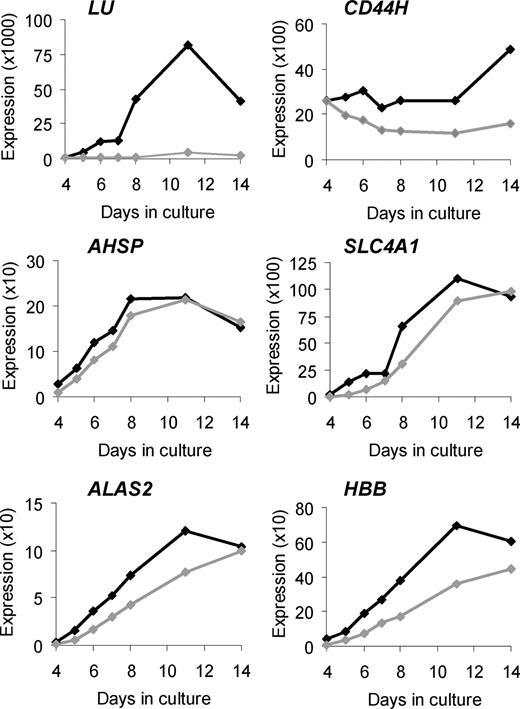
To validate our microarray findings and to obtain more comprehensive data about temporal changes in expression of selected genes, we performed Q-PCR on cDNA from 4 pairs of control and In(Lu) cultures, and included a greater number of time points (Figure 1; Figure S1).
Validation of selected microarray results by Q-PCR. Changes in target gene expression during ex vivo erythropoiesis are depicted. The vertical axis represents the target gene expression normalized to PABPC1 expression and relative to the UR/FL calibrator (as described in “Quantitative real-time polymerase chain reaction”). Black lines indicate average expression in control erythroblasts (n = 4); gray lines indicate average expression in In(Lu) erythroblasts (n = 4).
Validation of selected microarray results by Q-PCR. Changes in target gene expression during ex vivo erythropoiesis are depicted. The vertical axis represents the target gene expression normalized to PABPC1 expression and relative to the UR/FL calibrator (as described in “Quantitative real-time polymerase chain reaction”). Black lines indicate average expression in control erythroblasts (n = 4); gray lines indicate average expression in In(Lu) erythroblasts (n = 4).
In control cells, LU RNA is expressed at very low levels during early days of culture, rising by day 8 and peaking at day 11. The Lutheran antigens can be detected on the surface of cultured erythroblasts at around day 7 to 8.24 In In(Lu) cells, LU appears to be transcriptionally repressed (a maximum of 40-fold at day 8; Figure 1; Figure S1), although some expression is detected at all days with a slight increase at day 11, suggesting that the gene is not completely silenced. Although red blood cells from persons with the In(Lu) phenotype serologically type as Lu(a-b-), in many cases adsorption and elution techniques have shown the presence of very weak Lutheran antigen expression.27
The hemopoietic form of CD4426,28 shows consistently higher expression in the control cells than in the In(Lu) cells, but the difference is much smaller than for LU (a maximum of 3-fold at day 14).
Four additional erythroid genes tested by Q-PCR (AHSP, SLC4A1, ALAS2, and β-globin [HBB]) share similar patterns of expression. In control cells there is an increase in expression from day 4 to day 8 or 11 and then a reduction at day 14. The In(Lu) cells show a similar pattern, but expression is lower at all but the last time point. For HBB, expression is always lower in the In(Lu) cells. For all 4 genes, the difference in expression between control and In(Lu) cells is greatest at day 4: 3.2-fold for AHSP, 17.1-fold for SLC4A1, 4.4-fold for ALAS2, and 5.2-fold for HBB (Figure 1; Figure S1). These results are consistent with the microarray findings and our hypothesis that In(Lu) erythroblasts have a general abnormality of transcription with respect to erythroid genes.
In(Lu) erythroblasts have mutations in erythroid transcription factor EKLF
Because abnormal transcript levels were observed for multiple erythroid genes in In(Lu) type erythroblasts, we looked for evidence of altered erythroid transcription factors. We amplified and sequenced exons from 2 control and 2 In(Lu) samples (gDNA or cDNA) for genes encoding several transcription factors functioning in erythropoiesis (GATA1, FOG1 [90% covered], EKLF, GFI1B, MYB, MZF1 [80% covered], TAL1, SPI1 [PU.1]). Only EKLF showed the presence of mutations unique to In(Lu) samples. We sequenced the 3 EKLF exons from 3 more cDNA samples (derived from In(Lu) erythroid cultures), 18 more gDNA samples typed as Lu(a-b-) In(Lu) type, and 1 unusual Lu(a-b-) (InLu24), derived from archived gDNA or archived blood samples (available in house). Mutations were detected in all but 3 of the samples (Table 2). In all cases the mutated allele was expressed with a normal EKLF allele.
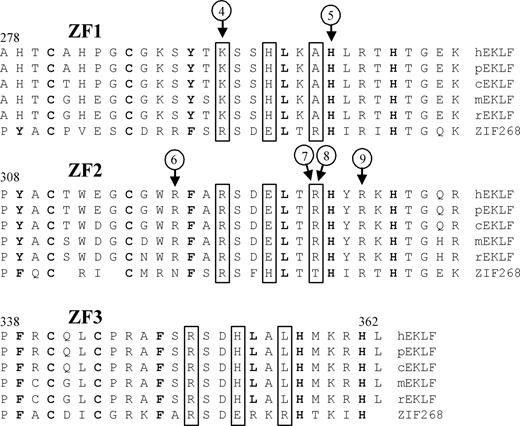
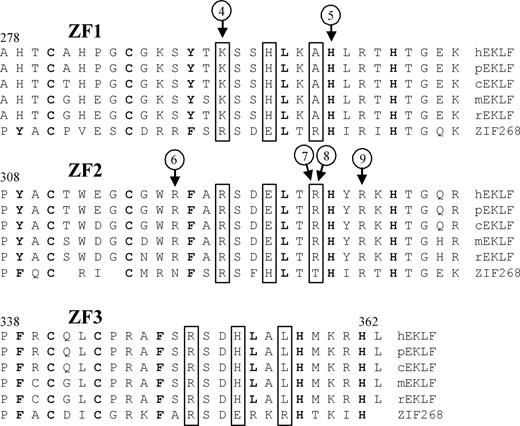
Nine different mutations were detected. Eight persons from the United Kingdom had a single base insertion in exon 3 (Arg319GlufsX34). 6 persons from 2 Spanish families had a single base deletion in exon 2 (Pro190LeufsX47). Six of the 9 mutations occur in that part of the EKLF gene encoding the zinc finger domains (Figure 2). One (Arg319GlufsX34) is predicted to cause a frameshift and another (Lys292X) encodes a premature termination codon; all others result in single amino acid substitutions (His299Tyr, Arg328Leu, Arg328His, and Arg331Gly). The 3 mutations outside of the zinc finger domains result in a premature termination codon (Leu127X), a frameshift (Pro190LeufsX47), and an altered GATA1 binding site in the EKLF promoter (−124T>C).
Sequence variants located in the zinc finger domains of EKLF. Alignment of the zinc finger domains (ZF1-ZF3) from EKLF is compared with ZIF268 (based on Figure 4 in Feng et al29 ). Protein sequences of genes identified as putative homologs of EKLF by NCBI's HomoloGene30 are from Homo sapiens (h), Pan troglodytes (p), Canis lupus familiaris (c), Mus musculus (m), and Rattus norvegicus (r). Boxed residues indicate XYZ amino acids required for DNA sequence recognition,31 bold residues show matches to the classical CC/HH motif,32 and circled numbers indicate positions of sequence variant types as described in Table 2.
Sequence variants located in the zinc finger domains of EKLF. Alignment of the zinc finger domains (ZF1-ZF3) from EKLF is compared with ZIF268 (based on Figure 4 in Feng et al29 ). Protein sequences of genes identified as putative homologs of EKLF by NCBI's HomoloGene30 are from Homo sapiens (h), Pan troglodytes (p), Canis lupus familiaris (c), Mus musculus (m), and Rattus norvegicus (r). Boxed residues indicate XYZ amino acids required for DNA sequence recognition,31 bold residues show matches to the classical CC/HH motif,32 and circled numbers indicate positions of sequence variant types as described in Table 2.
Two known single nucleotide polymorphisms (SNPs; dbSNP rs2072597 and dbSNP rs2072596) were also detected (Table 2). Interestingly, a third reported SNP (dbSNP rs35891202) has a single base deletion at the beginning of exon 3, which would be predicted to result in a frameshift affecting the entire zinc finger region. This SNP may therefore represent an EKLF mutation in another person with the In(Lu) phenotype.
We also sequenced all EKLF exons and the promoter region in 5 cDNA samples from control erythroid cultures and 32 control gDNAs from random blood donors. None of the mutations found in the In(Lu) samples were seen in the controls.
EKLF mutations in In(Lu) create a nonfunctional allele
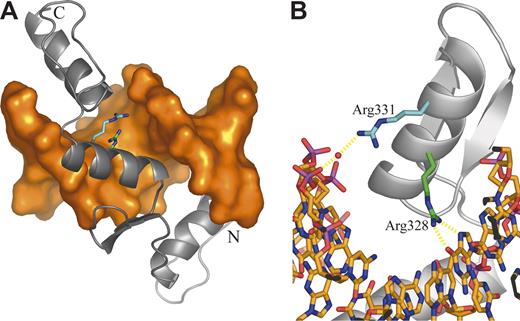
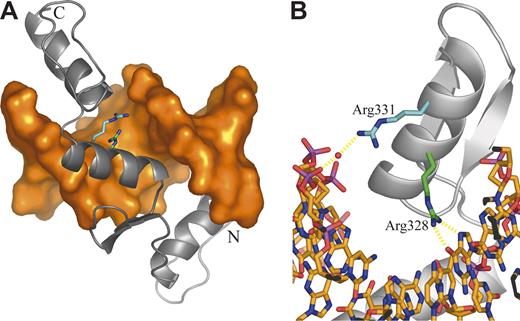
Mutation 1 disrupts a GATA1 binding site in the EKLF promoter (Table 2). The other mutations identified are located in the EKLF coding region. Several mutations must render the affected EKLF allele nonfunctional. Mutations 2 and 4 convert Leu127 and Lys292, respectively, to termination codons, resulting in translated proteins lacking all zinc finger (ZF) domains. Mutation 3 is a base deletion in the codon for Pro190, whereas mutation 6 is a base insertion in the codon for Arg319. Both mutations would alter the subsequent reading frame with consequent loss of all ZF domains (mutation 3) or loss of ZF domains 2 and 3 (mutation 6). Mutations 5, 7, 8, and 9 cause amino acid changes in or near the consensus sequence of a ZF domain. Mutation 5, which changes His299 (ZF1) to Tyr, is expected to diminish the binding of zinc that is integral to the overall protein conformation. Mutations 7 and 8 lead to substitution of Arg328 (ZF2) by His and Leu, respectively. These changes are expected to disrupt the normal mode of DNA binding in which Arg328 is predicted to form 2 central hydrogen bonds with a guanine base (Figure 3). Mutation 9 substitutes Arg331 with Gly. In the model, Arg331makes a water-mediated interaction with a phosphate of the DNA backbone; this interaction is not possible when Gly is incorporated at this position (Figure 3).
Homology model of the EKLF-DNA complex. (A) Overall structure of the complex. DNA is shown as an orange molecular surface; protein is shown as a gray Cα cartoon. The amino terminus (Ala278) is labeled N; the carboxy terminus (Leu362) is labeled C. The side chains of mutated residues are highlighted as sticks with the carbon atoms of Arg328 and Arg331 colored green and cyan, respectively. (B) Close-up of the ZF2 domain highlighting protein-DNA interactions involving mutated residues. DNA is shown as sticks colored by atom type. Protein is displayed as in panel A. The bound water molecule is shown as a red sphere, and putative hydrogen bonds are shown as dashed yellow lines.
Homology model of the EKLF-DNA complex. (A) Overall structure of the complex. DNA is shown as an orange molecular surface; protein is shown as a gray Cα cartoon. The amino terminus (Ala278) is labeled N; the carboxy terminus (Leu362) is labeled C. The side chains of mutated residues are highlighted as sticks with the carbon atoms of Arg328 and Arg331 colored green and cyan, respectively. (B) Close-up of the ZF2 domain highlighting protein-DNA interactions involving mutated residues. DNA is shown as sticks colored by atom type. Protein is displayed as in panel A. The bound water molecule is shown as a red sphere, and putative hydrogen bonds are shown as dashed yellow lines.
Discussion
The molecular basis of the In(Lu) type of Lu(a-b-) blood group phenotype has not previously been established. Many families exhibiting this phenotype have been studied using serologic methods and apparent dominant inheritance was observed, hence, InLu (inhibitor of Lutheran) to describe the gene responsible.14,15,33,34 The phenotype is of interest because its characteristic reduced red cell surface expression of antigens from several genetically independent blood group systems (i, P1, and Inb) in addition to Lutheran system antigens suggests abnormality in a pathway common to the biosynthesis of these blood group–active molecules (reviewed in Daniels35 ). The Inb antigen is carried on CD44 and defined by its amino acid sequence.25,26 In contrast the i and P1 antigens are carbohydrate antigens.36,37
To explore the molecular basis of this phenotype we compared gene expression profiles of normal and In(Lu) cultured erythroblasts. The results showed a clear difference between the 2 cell types with respect to transcript levels of LU and CD44 (Table 1; Figure 1), consistent with the serologic profile of In(Lu) red cells. Lutheran expression occurs late during ex vivo erythropoiesis,24 and the markedly reduced levels of LU transcript appear indicative of incomplete erythroid maturation. Further inspection of the gene expression data showed a reduction in transcript levels of erythroid genes in general. This was particularly noticeable when erythroblasts from day 4 of culture were examined where marked reductions in transcript levels for ALAS2, globin genes, and SLC4A1 (Band 3) were apparent (Table S2; Figure 1; Figure S1). These data prompted us to search for mutations in erythroid transcription factor genes in DNA from blood donors with the In(Lu) phenotype. Initial analysis of DNA from 2 persons of the In(Lu) type showed mutations in EKLF. Subsequently, we were able to obtain In(Lu) DNA from 24 persons. Our data showing the occurrence of mutations in the promoter or coding region of EKLF in all but 3 of these persons and the absence of any of these mutations in persons of normal Lutheran phenotype provide persuasive evidence that the EKLF mutations are responsible for the In(Lu) phenotype in these persons. All 21 In(Lu) samples in which we found EKLF mutations had the mutations on one allele, whereas the other EKLF allele had a normal sequence (Table 2).
EKLF comprises a proline-rich N-terminal region (amino acids 1-275) containing a transactivation domain and a C-terminal region (amino acids 276-358) containing 3 zinc finger domains essential for binding to the DNA consensus sequence 5′-CCACACCCT-3′ (Figure 2).29,38,39 In mice, EKLF is expressed at high levels only in erythroid cells, and abundant evidence supports the view that it is a key regulator of erythroid-specific gene expression (reviewed in Bieker40 ). Eklf knock-out mice die at around embryonic day 14 because of severe anemia resulting from the failure to switch from embryonic to adult β-globin expression.2,3 Murine EKLF is also required for the transcription of heme biosynthesis genes such as Alas2 and Ahsp and for genes encoding erythroid membrane proteins, including EPB49, DARC, and ERMAP.7,8 Comparison of the gene expression profiles observed for In(Lu) with those reported for mice deficient in EKLF7,8 shows numerous similarities with respect to reduced expression of EKLF-dependent erythroid genes (Table 1; Figure 1). Less information is available about transcript levels in Eklf+/− mice, but β-globin and TER119 (murine glycophorin A) are expressed at intermediate levels and in this respect are similar to human In(Lu) cells (Figure 1).8,9
The 21 In(Lu) persons studied exhibited 9 different EKLF mutations. Mutation 1 (−124T>C; Table 2) causes the loss of 1 of 3 possible GATA1 binding sites in the human EKLF promoter. Analysis of mouse Eklf promoter activity by transient transfection in MEL cells of promoter constructs in which 1 or other of 3 GATA1 binding sites were disrupted showed that one site was critical for Eklf expression, whereas inactivation of the other sites had a relatively minor effect.41 In this context it is interesting to note that red cells from the person with the promoter mutation (InLu24) had Lutheran antigens and Inb antigen expression weaker than normal red cells but noticeably stronger than most In(Lu) samples (J. Poole, IBGRL, e-mail, February 4, 2008), suggesting that some expression of EKLF occurs from the mutant allele in the absence of this GATA1 site.
Eight different mutations were found in the EKLF coding sequence of persons with the In(Lu) phenotype. Eight persons had the Arg319GlufsX34 mutation and 6 had the Pro190LeufsX47 mutation; it seems likely that these groups share common ancestors in the United Kingdom and Spain, respectively. All other mutations were single examples. The In(Lu) phenotype appears to be benign with no associated pathology and little evidence of erythroid abnormality reported. The red cells of 2 In(Lu) siblings with normal hematologic indexes had a normal half-life, although they showed increased hemolysis on storage at 4°C.42 In one family the In(Lu) phenotype was associated with acanthocytosis.43 It would be of interest to examine EKLF in the latter family to determine whether the reported acanthocytosis is linked to a unique mutation in EKLF.
By analogy with Eklf “knock-out” mice it would be predicted that inheritance of 2 InLu alleles would result in embryonic death, and in this context it is interesting to note that none of the many reported families with In(Lu) type red cells have progeny of proven homozygosity with respect to InLu. Of particular interest is the NEA family described by Gibson34 in which a first-cousin marriage produced 5 children all of whom had the In(Lu) phenotype. Four of these children had children of their own (who were not of the In(Lu) phenotype), proving that they were heterozygous.
The presence of a mutated EKLF allele is easily detected by observing the almost complete absence of Lutheran blood group antigens on the red cells of affected persons because most persons with the Lu(a-b-) phenotype will be of the In(Lu) type. The dramatic reduction in Lutheran expression observed in In(Lu) cells may be related to its transcriptional activation being at a later stage in erythropoiesis than other erythroid-specific genes. This suggests that EKLF availability in In(Lu) becomes limiting at later stages of erythroid maturation (Figure 1; Figure S1). In this context it is interesting to note that EKLF protein content declines as J2E cells mature in response to erythropoietin under conditions where globin synthesis is increasing rapidly.44 Spadaccini et al44 suggest lower levels of EKLF are needed to maintain transcription once initial activation has occurred. If this observation also applies to human erythropoiesis, it may be that levels of EKLF in In(Lu) are too low for transcriptional activation of LU at day 8 of culture. Several potential EKLF binding sites have been identified in the LU promoter.45
We conclude that the In(Lu) phenotype is most likely caused by inheritance of a loss-of-function mutation on one allele of EKLF. Transcription of EKLF from the single normal allele results in reduced levels of EKLF, and, as a consequence, a general reduction in transcription of erythroid genes ensues. The absence of mutation in the EKLF coding sequence in 3 In(Lu) samples (InLu8, 9, and 23) suggests either the presence of a mutation in part of the gene not sequenced (enhancer or distal promoter regions), or the possibility of other causes of the In(Lu) phenotype. In several In(Lu) persons the mutated copy of EKLF can only produce nonfunctional protein, and so they are representative of the EKLF+/− phenotype. It can be inferred that this phenotype is physiologically benign in humans as it is in mice. In other cases mutations change single amino acids in the region of zinc finger domains 1 and 2 and so, by inference, alter residues critical for normal EKLF function. The diversity of mutations within a small number of In(Lu) persons is consistent with sporadic mutation. The In(Lu) phenotype therefore results from reduced transcription (as previously postulated42 ) rather than the action of a dominant inhibitor gene. These data provide the first evidence of naturally occurring mutations affecting human EKLF and the first description of transcription factor mutations directly responsible for a specific blood group phenotype.
An Inside Blood analysis of this article appears at the front of this issue.
The online version of this article contains a data supplement.
The publication costs of this article were defrayed in part by page charge payment. Therefore, and solely to indicate this fact, this article is hereby marked “advertisement” in accordance with 18 USC section 1734.
Acknowledgments
We thank Heather Davies and Alan Gray for the Lu(a-b-) samples and their controls, Peter Martin and Joanna Summers-Yeo for DNA sequencing, Jane Coghill for the microarray hybridization service, and Vanja Karamatic Crew and Kirstin Finning for providing useful reagents. We are grateful to Geoff Daniels, Frances Spring, and Anna Ribera for providing archived samples. We also thank Joyce Poole and Nicole Warke for serology data and Kevin Gaston and Lucio Luzzatto for helpful advice and discussions.
This work was supported by the Department of Health (England).
Authorship
Contribution: B.K.S. designed and conducted experiments and wrote the paper; N.M.B. and C.G. conducted experiments; R.L.B. designed experiments; and D.J.A. designed experiments and wrote the paper.
Conflict-of-interest disclosure: The authors declare no competing financial interests.
Correspondence: Belinda K. Singleton, Bristol Institute for Transfusion Sciences, Southmead Rd, Bristol, BS10 5ND, United Kingdom; e-mail: belinda.singleton@nbs.nhs.uk.

