Abstract
Leukemia caused by retroviral insertional mutagenesis after stem cell gene transfer has been reported in several experimental animals and in patients treated for X-linked severe combined immunodeficiency. Here, we analyzed whether gene transfer into mature T cells bears the same genotoxic risk. To address this issue in an experimental “worst case scenario,” we transduced mature T cells and hematopoietic progenitor cells from C57BL/6 (Ly5.1) donor mice with high copy numbers of gamma retroviral vectors encoding the potent T-cell oncogenes LMO2, TCL1, or ΔTrkA, a constitutively active mutant of TrkA. After transplantation into RAG-1–deficient recipients (Ly5.2), animals that received stem cell transplants developed T-cell lymphoma/leukemia for all investigated oncogenes with a characteristic phenotype and after characteristic latency periods. Ligation-mediated polymerase chain reaction analysis revealed monoclonality or oligoclonality of the malignancies. In striking contrast, none of the mice that received T-cell transplants transduced with the same vectors developed leukemia/lymphoma despite persistence of gene-modified cells. Thus, our data provide direct evidence that mature T cells are less prone to transformation than hematopoietic progenitor cells.
Introduction
Gamma retroviral vectors integrate into the target cell genome, thus supporting long-term transgene expression. They are among the best-established therapeutic vector systems and have successfully been used for gene transfer to hematopoietic stem cells (HSCs) in the treatment of X-linked and adenosine deaminase-deficient severe combined immunodeficiency (SCID). A limitation of retroviral gene transfer to HSC has been the risk of insertional mutagenesis, which was reported to lead to the preferential expansion of individual hematopoietic cell clones (clonal dominance) or even overt leukemia/lymphoma.1 At the date of submission, 4 human cases of leukemia resulting from retroviral insertional mutagenesis had been described, all after initially successful treatment of X-linked SCID.2-4 Three of these cases were associated with the activation of the T-cell oncogene LMO2 near the retroviral integration site, and all cases manifested as T-cell lineage leukemias.5
It has been long known that leukemias can be linked to specific chromosomal translocations that juxtapose a strong promoter/enhancer element to a cellular oncogene, such as LMO2 or TCL1,6,7 thus up-regulating the expression of the oncogene. For several of these oncogenes, transgenic mouse models have confirmed their transforming activity.8,9 LMO2-transgenic mice develop T-cell leukemia of an immature phenotype, whereas TCL1 is found to induce mature T-cell malignancies. A deletion mutant of the receptor tyrosine kinase TrkA (ΔTrkA) for nerve growth factor was described that is constitutively active. ΔTrkA was found to generate acute myeloid leukemia as well as immature T-cell leukemia after retroviral gene transfer and a very short latency period.10
Activation of potential oncogenes by retroviral insertion alone is not thought to be sufficient for transformation.11,12 One factor that may determine the penetrance of overt leukemia after oncogene activation is thought to be the level of cell lineage differentiation. In general, stem cells are supposed to be a preferred target for transformation as they already have the machinery for self-renewal activated, thus maintaining that this activation may be simpler than turning it on de novo in a more differentiated cell. In addition, there is growing evidence that myeloid leukemias originate in hematopoietic stem/hematopoietic progenitor cells (HPCs) or early myeloid progenitors.13,14 However, compared with other mature cell lineages, fully differentiated lymphocytes claim a special position in hematopoiesis. They show long life-spans, sustained proliferation, and the ability of self-renewal.15 For B-cell leukemias/lymphomas, it was recently shown that fully maturated B lymphocytes can still be transformed.16
Nevertheless, several observations indicate that mature T cells are less susceptible to transformation than HSCs/HPCs. Human mature T-cell leukemias/lymphomas are less frequent and occur predominantly in older patients after a long latency.17 In clinical trials involving gene transfer into mature T cells, leukemia was never observed, despite follow-up assessments of more than 10 years.18-21 On the other hand, in none of the T-cell trials was such a high level of gene marking achieved as in the SCID-X1 trial, and in SCID-X1 the selective advantage mediated by transgene expression may also have contributed to leukemic transformation. Therefore, the question of transformability of mature T cells remains to be clarified.
Because the answer to this question is of utmost relevance for clinical gene therapy, we aimed at directly comparing the susceptibility to transformation of mature T cells and HSCs/HPCs. To do so, we developed an experimental “worst case scenario” involving transplantation of T cells and HSCs/HPCs transduced with multiple copies of the T-cell oncogenes LMO2, TCL1, or ΔTrkA into RAG-1–deficient mice. Using this animal model, which allows efficient long-term engraftment of transduced cells of either cell type, we found highly reproducible leukemia/lymphoma induction after oncogene transfer into HSCs/HPCs but no case of malignant transformation of mature T cells.
Methods
Mice
Six- to 8-week-old C57BL/6J.Ly5.1 (CD45.1+) and C57BL/6J.Ly5.2 (CD45.2+) RAG-1-deficient mice were obtained from Charles River Laboratories (Sulzfeld, Germany) and The Jackson Laboratory (Bar Harbor, ME). Animals were bred and maintained under specific pathogen-free-like conditions in the animal facilities of the Georg-Speyer-Haus. Cages were individually ventilated. Symptomatic/leukemic or healthy animals (donors) were killed after anesthesia by cervical dislocation and examined for pathologic abnormalities, including histology, morphology, white blood counts (WBCs), and flow cytometry. The experiments were performed in compliance with the local animal experimentation guidelines. Animal experiments were approved by the regional council (Regierungspräsidium, Darmstadt, Germany).
Retroviral vectors/cloning
SF91-ΔTrkA-IE was previously described.10 The vector is referred to as SF91-ΔTrkA. The vector MP91-wPRE was shown to support high transgene expression in mouse transplantation models.22,23 An internal ribosome entry site (IRES) from the encephalomyocarditis virus was cloned in front of the gene for the enhanced green fluorescence protein (eGFP) into the vector, resulting in the control vector MP91-eGFP. The cDNAs of murine LMO2 and its HA-tagged version LMO2-HA were kindly provided by Olga Kustikova (Hannover Medical School, Department of Experimental Hematology, Hannover, Germany) and cloned into the described gamma retroviral vector MP91-eGFP in front of the IRES. HA-tag was located at the C-terminus of LMO2 after amino acid 158. The cDNA of the murine TCL1 was obtained from RZPD Deutsches Ressourcenzentrum für Genomforschung (ImaGenes, Berlin, Germany) and also cloned into MP91-eGFP as described for LMO2.
Retroviral vector production
Vector supernatants were produced in Dulbecco modified Eagle medium (Lonza Walkersville, Rockville, MD) supplemented with 10% fetal calf serum (Pan Biotech, Aidenbach, Germany), 2% l-glutamine (Lonza Walkersville), and 1% penicillin/streptomycin (Pan Biotech). Ecotropic supernatant was produced in a split genome approach by calcium-phosphate-mediated transient transfection of 293T human embryonic kidney producer cells. After 24, 48, and 60 hours, supernatant was collected, filtered (45 μm), and stored at 4°C. All supernatants were pooled and titrated on the embryonic murine fibroblast SC-1 cell line.
Retroviral transduction and transplantation of stimulated Sca1+ HSCs/HPCs and mature T cells
Bone marrow cells were flushed from tibias and femurs of C57BL/6J.Ly5.1 (or C57BL6J.Ly5.2 RAG-1−/−) donor mice. Enrichment of Sca1+ cells was carried out with the EasySep Murine SCA1 Selection Kit (StemCell Technologies, Vancouver, BC). Sca1+ cells were cultured for 3 days in RPMI (Lonza Walkersville), supplemented with the following cytokines: 10 ng/mL murine interleukin-3 (IL-3), 50 ng/mL murine IL-6, and 50 ng/mL murine stem cell factor (Tebu-bio, Offenbach, Germany); 24-well nontissue culture plates (BD Biosciences PharMingen, San Diego, CA) were coated with 50 μg/mL retronectin (Takara, Kyoto, Japan), according to the manufacturer's protocol and preloaded with the retroviral supernatants by 3 centrifugation cycles (3 times 1 mL vector supernatant per well; 1000g, 4°C, each 30 minutes.). Stimulated Sca1+ cells were cultured on particle-covered plates, and 24 hours later the transduction was repeated. Six days after isolation and after 2 rounds of transduction, 5 × 10⁵ bone marrow cells were injected intravenously into RAG-1–deficient recipients. Before transplantation (4-6 hours), mice were previously sublethally irradiated at 500 cGy using a BIOBEAM 2000 Cs-137 chloride gamma irradiator (Eckert & Ziegler, Berlin, Germany).
Murine mononuclear cells were isolated from the spleen and the lymph nodes (mesenteric and superficial inguinal) of C57BL6J.Ly5.1 mice and stimulated by anti-CD3 (clone 145-2C11), anti-CD28 monoclonal antibody (mAb, clone 37.51; both from BD Biosciences PharMingen) coated paramagnetic beads (Invitrogen, Carlsbad, CA) for 4 days to obtain stimulated mature T cells. The use of paramagnetic beads conjugated with mAb has been previously described.24 At day 4 after isolation, cells were transduced on retronectin-vector supernatant-preloaded (3 times 3 mL vector supernatant per well; 1000g, 4°C, each 30 minutes) 6-well nontissue culture plates (BD Biosciences PharMingen) as described for HSCs/HPCs. Stimulated mature T cells were kept in RPMI 1640 (Lonza Walkersville), supplemented with 10% fetal calf serum (Pan Biotech), 2% l-glutamine (Lonza Walkersville), 1% Pen/ Strep (PAA Laboratories, Coelbe, Germany), 1% sodium pyruvate (Invitrogen), 1% nonessential amino acids (Invitrogen), and 0.1% β-mercaptoethanol (Invitrogen) throughout the entire cultivation time. Culture conditions also included human IL-2 (Roche Diagnostics, Mannheim, Germany) at 100 U/mL for stimulation. Seven days after isolation and after 2 rounds of transduction, 2 × 10⁷ transduced mature T cells were injected intravenously into RAG-1–deficient recipients without any further conditioning. When showing massive colitis, recipients were killed, and mature T cells were isolated from spleen and lymph nodes (mesenteric, superficial inguinal, and mandibular). Organs were homogenized through a 100-μm cell strainer, and cell suspensions were washed 2 times in phosphate-buffered saline. No CD8/CD4 selection was performed. After fluorescence-activated cell sorter (FACS) analysis for transgene expression single-cell suspensions were subsequently transplanted into secondary recipients by intravenous injection of 1 to 2 × 10⁷cells per animal.
Western blot analysis
For expression studies of transduced oncogenes, RAG-1–deficient mice received transplants of either gene-modified HSCs/HPCs or mature T cells. Six weeks after transplantation, animals were killed for isolation of thymocytes (of HSC/HPC-transplanted animals) or lymphocytes (of T cell–transplanted animals). The same quantity of eGFP-expressing cells (for both cell types) was used for Western blot analysis. Subsequently, detection of eGFP was used as a loading control for genetically modified cells.
Western blot for ΔTrkA was performed as previously described.2,10,25 Primary antibodies used in this study included: rabbit anti–TrkA (763) in a 1:200 dilution, rabbit anti-HA (Y-11) for LMO2-HA detection in a 1:1000 dilution, biotinylated anti-eGFP (B2) in a 1:200 dilution (all from Santa Cruz Biotechnology, Santa Cruz, CA) and rabbit anti-TCL1 in a 1:1000 dilution (Cell Signaling Technology, Danvers, MA).
Western blotting was performed according to the manufacturer's instructions; primary antibodies were detected with horseradish peroxidase (HRP)-conjugated secondary antibodies or reagents: goat anti–rabbit HRP in a (1:2000 or 1:10 000) dilution and streptavidin-HRP in a 1:2000 dilution (Santa Cruz Biotechnology). Molecular sizes of detected proteins were calculated by referring to a marked protein ladder (10-250 kDa) from New England Biolabs (Ipswich, MA) run in parallel on each gel.
Flow cytometric analysis and white blood counts of leukemic samples
Immediately before death and necropsy, blood was obtained from symptomatic animals, and a hemogram using a Scil vet animal blood counter (Scil Animal Care, Viernheim, Germany) was prepared to determine the WBCs in the periphery.
Flow cytometric analyses were carried out on blood and single-cell suspensions of thymus, spleen, lymph nodes, and bone marrow. The following anti–mouse monoclonal antibodies were used for staining: rat anti–mouse monoclonal antibodies (Invitrogen) phycoerythrin (PE)–conjugated CD8a (CT-CD8a), PE Cy5.5 (PE-Cy5.5)-conjugated CD4 (RM4-5), PE-conjugated CD11b (M1/70.15), PE Cy5.5 (PE-Cy5.5)–conjugated CD19 (6D5), PE Cy5 (PE-Cy5)-conjugated CD3 (145-2C11); mouse anti–mouse monoclonal antibodies (BD Biosciences PharMingen) allophycocyanin-conjugated CD11b (M1/A70), PE-conjugated CD45.1 (A20), (PerCP-Cy5.5)-conjugated CD45.2 (104), and a hamster anti–mouse monoclonal antibody (BD Biosciences PharMingen) allophycocyanin-conjugated T-cell receptor β (TCRβ; H57-597). To prevent nonspecific binding to Fc receptors, samples were incubated with mouse seroblock FcR (Serotec, Oxford, United Kingdom) or CD16/CD32 mAbs (2,4G2; BD Biosciences PharMingen). Blood and spleen samples were treated, after staining, with Cal-lysis solution (Invitrogen) to remove red blood cells.
Analyses were performed on a FACScalibur using the CellquestPro software (both from BD Biosciences PharMingen). All cell counts were performed on a CASY Cell Counter (Schärfe System, Reutlingen, Germany).
Histopathologic analysis
Sick mice with a high WBC count were killed for necropsy and examined for pathologic abnormalities. After securing single-cell suspensions of infiltrated organs for FACS analysis, lymph nodes, spleen, thymus, liver, kidney, lung, heart, brain, and bone marrow were fixed in 10% Zinc-Formal-Fixx (Thermo Electron, Waltham, MA). Sections were prepared and stained with hematoxylin and eosin as a commercial service from MFD Diagnostics (Wendelsheim, Germany), according to the pathology database RITA.26 For histologic examination, a light microscope (Eclipse E1000m; Nikon, Tokyo, Japan) with 4×, 20×, and 40× lenses with a digital camera (DXM 1200, Nikon) was used.
LM-PCR, shotgun cloning, and insertion site analysis
Ligation-mediated polymerase chain reaction (LM-PCR) was performed as previously described.27-29 Detailed descriptions for LM-PCR, shotgun cloning, and insertion site analysis are provided in Document S1 (available on the Blood website; see the Supplemental Materials link at the top of the online article).
Results
Study design and retroviral vectors
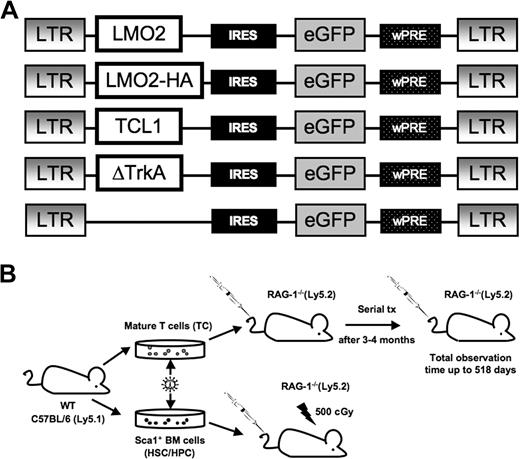
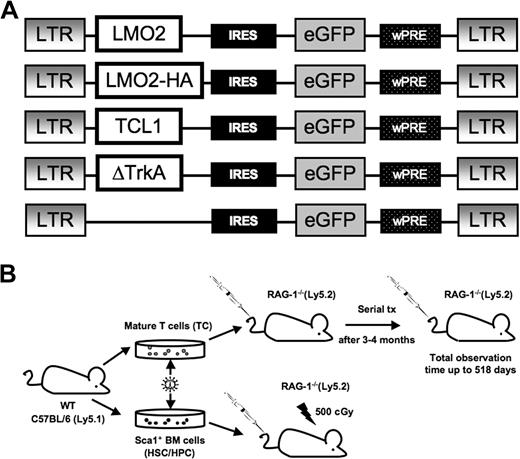
To assess whether mature T cells could be transformed by overexpression of potent T-cell oncogenes, we introduced gamma retroviral vectors that encode the potent T-cell oncogenes LMO2, (LMO2-HA), TCL1, or ΔTrkA (a constitutively active mutant of TrkA, Figure 1A). In addition, the vectors coexpressed eGFP as a marker gene via an IRES. The hemagglutinin (HA)–tagged variant of LMO2 was used to enable Western blot analysis. As a positive control, we transduced Sca1+ HSCs/HPCs with the same vectors.
Gamma retroviral vectors and experimental design. (A) The design of the retroviral vectors used in this study. The retroviral vector SF91-ΔTrkA has been described elsewhere.10 wPRE indicates Woodchuck hepatitis virus posttranscriptional regulatory element; IRES, internal ribosomal entry site. An HA-tagged LMO2 was used for Western blot analysis. (B) C57BL/6.Ly5.1 mice were used as donors for Sca1+ HSCs/HPCs and mature T cells. Isolated Sca1+ HSCs/HPCs were stimulated for 3 days, mature T cells for 4 days, followed by retroviral transduction and transplantation into RAG-1–deficient recipient mice. After 12 to 16 weeks, animals that received T-cell transplants developed massive colitis and were killed. T cells were isolated and serially transplanted several times into secondary recipients (1 donor to 1 recipient).
Gamma retroviral vectors and experimental design. (A) The design of the retroviral vectors used in this study. The retroviral vector SF91-ΔTrkA has been described elsewhere.10 wPRE indicates Woodchuck hepatitis virus posttranscriptional regulatory element; IRES, internal ribosomal entry site. An HA-tagged LMO2 was used for Western blot analysis. (B) C57BL/6.Ly5.1 mice were used as donors for Sca1+ HSCs/HPCs and mature T cells. Isolated Sca1+ HSCs/HPCs were stimulated for 3 days, mature T cells for 4 days, followed by retroviral transduction and transplantation into RAG-1–deficient recipient mice. After 12 to 16 weeks, animals that received T-cell transplants developed massive colitis and were killed. T cells were isolated and serially transplanted several times into secondary recipients (1 donor to 1 recipient).
After transduction, T cells and HSCs/HPCs of C57BL/6J.Ly5.1 (or HPCs of C57BL/6J.Ly5.2 RAG-1−/−) mice were each transplanted into RAG-1-deficient recipients (of a C57BL/6J.Ly5.2 background; Figure 1B). To discriminate between donor and host cells, samples of repopulated animals were stained for the CD45 panleukocyte antigen. BL6 Ly5.1 cells show the allelic variant CD45.1 and can be easily distinguished from BL6 RAG-1−/− Ly5.2 cells expressing the CD45.2 variant.
BL6 RAG-1−/− Ly5.2 mice do not develop mature T and B lymphocytes30 and thus support high levels of long-term engraftment of donor cells. For transplantation of hematopoietic stem cells, RAG-1−/− recipients were sublethally irradiated (5 Gy). Animals that received transplants were monitored for repopulation and development of leukemia/lymphoma.
A few animals (3 of 54) developed CD8+CD4+ double positive (DP) host-derived lymphomas from the RAG-1–deficient precursors after sublethal γ-irradiation (data not shown). Previous studies had already found that sublethal γ-irradiation induces differentiation of CD4−/CD8− into CD8+/CD4+ thymocytes in RAG-1– and RAG-2–deficient mice in a TCRβ chain-independent pathway.31,32 Because of a longer observation period in the present study, the fate of these DP cells could be followed. We observed massive enlargement of the thymi that required death of the animals between weeks 18 and 40 after transplantation. Mice with host-derived tumors were not included in the data presented here.
After 12 to 16 weeks, T cell–transplanted animals (including the eGFP control group) developed massive colitis combined with weight loss and were therefore killed. Minor antigen differences in the donor and recipient strain, although both on a C57Bl6 background, may have been responsible for this reactivity. Lymphocytes were isolated from the spleen and lymph nodes (mesenteric, superficial inguinal, and mandibular) of symptomatic animals. Cells were checked for transgene expression by FACS and serially transplanted without selection. The lymphocytes from every animal were each transplanted into a secondary recipient (Figure 1B). If necessary, this procedure was repeated up to 4 times to enable sufficient long-term follow-up of transduced mature T cells in vivo. Interestingly, the development of colitis in the T-cell recipient mice was not accelerated with increasing passage number, indicating that autoreactive T-cell clones were not enriched in the lymph nodes used to isolate T lymphocytes for serial transplantation. The autoreactive populations were probably concentrated in the inflamed gut mucosa and possibly in the corresponding draining lymph nodes. Importantly, the percentage of gene-modified T cells as assessed by FACS remained stable over the whole observation period.
Comparable levels of retroviral transduction and expression of the oncogenes in HSCs/HPCs, mature T cells, and their respective progeny
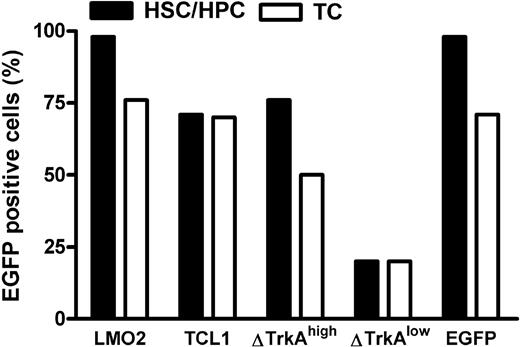
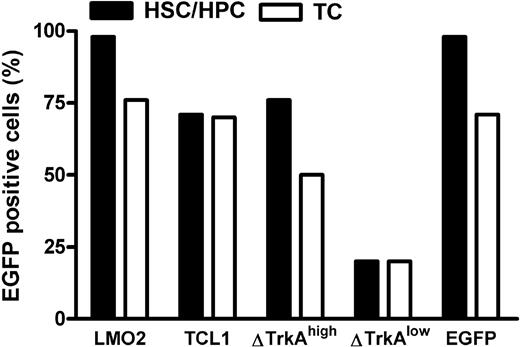
Mature T cells were stimulated with anti-CD3/-CD28–coupled paramagnetic beads for 4 days, followed by transduction with ecotropic vector supernatants. HSCs/HPCs were enriched for Sca-1+ cells and prestimulated for 3 days with mIL-3, mIL-6, and murine stem cell factor. After 2 rounds of transduction, up to 70% of mature T cells and up to 98% of HSCs/HPCs expressed the transgene (Figure 2). For ΔTrkA, a high copy and a low copy batch of cells were prepared because pilot experiments showed that high copy numbers led to rapid death of the animals from a polyclonal myeloproliferative disease and ΔTrkA had been reported to produce hematologic malignancies also in a single copy setting.10
Level of transduction for HSCs/HPCs and mature T cells. Transduction efficacies in percentage eGFP-positive cells for hematopoietic progenitor cells (■) and primary, stimulated mature T cells (□). For ΔTrkA, 2 cell populations (one with high, ΔTrkAhigh; and one with low transduction levels, ΔTrkAlow) were prepared. TC indicates T cells.
Level of transduction for HSCs/HPCs and mature T cells. Transduction efficacies in percentage eGFP-positive cells for hematopoietic progenitor cells (■) and primary, stimulated mature T cells (□). For ΔTrkA, 2 cell populations (one with high, ΔTrkAhigh; and one with low transduction levels, ΔTrkAlow) were prepared. TC indicates T cells.
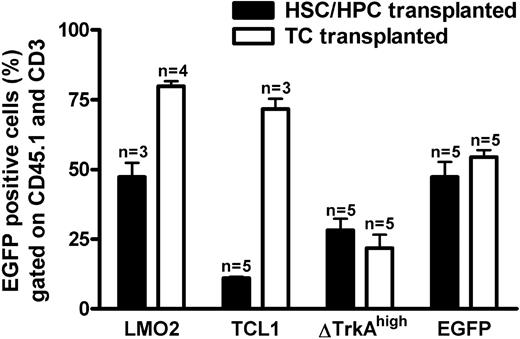
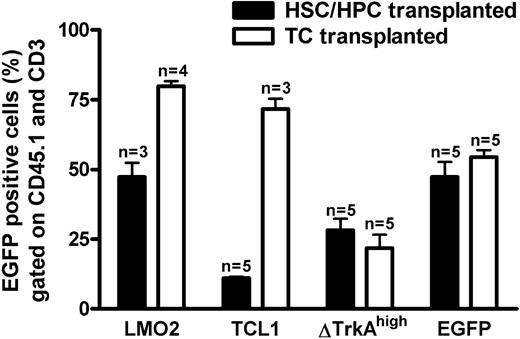
Transduced T cells and HSCs/HPCs were transplanted into RAG-1–deficient recipients. Six weeks after gene transfer, animals were analyzed for donor cell engraftment and transgene (eGFP) expression. Blood from the tail vein was stained for CD45.1 (donor marker) and CD3 (T-cell marker) to analyze retroviral expression in the donor-derived T-cell compartment. As shown in Figure 3, circulating mature donor T cells were detectable in the periphery of animals that received transplants of HSCs/HPCs and T cells. After 4 to 6 weeks, the number of blood T lymphocytes was comparable between T cell– and HSC/HPC-transplanted animals, and no obvious difference in the size of mesenteric and inguinal lymph nodes was observed between the 2 groups (data not shown). Flow cytometric analysis revealed eGFP expression for all investigated groups, indicating engraftment of gene-modified cells. For SF91-ΔTrkAhigh and the control vector MP91-eGFP expression was similar for T cell– and HSC/HPC-transplanted animals (Figure 3), although transduction efficacies had been higher for the HSC/HPC transplants (Figure 2). For MP91-LMO2 and MP91-TCL1, the expression of eGFP in T cell–repopulated animals (70%-80%) was higher than for HSC/HPC reconstituted recipients (11%-55%). HSC/HPC-transplanted animals, as analyzed for MP91-eGFP, showed a normal T-cell development. Peripheral blood, thymus, and the lymph nodes of reconstituted recipients were analyzed via FACS for the expression of donor marker CD45.1, eGFP, CD19, and the T-cell markers TCR, CD3, CD4, and CD8. The size of the different subpopulations was similar to the situation in wild-type animals (data not shown).
Percentage eGFP-expressing cells in peripheral donor-derived T cells of HSC/HPC and T cell (TC)-transplanted animals. Six weeks after transplantation, blood was drawn from HSC/HPC and TC recipient mice. Percentages of eGFP-positive cells in the CD45.1+ (donor cells) and CD3+ (T cell) gates of animals that received transplants of HSCs/HPCs (■) and TCs (□). Engraftment of transferred gene-modified T cells was at least equal, if not higher, compared with HSCs/HPCs. Error bars represent SD.
Percentage eGFP-expressing cells in peripheral donor-derived T cells of HSC/HPC and T cell (TC)-transplanted animals. Six weeks after transplantation, blood was drawn from HSC/HPC and TC recipient mice. Percentages of eGFP-positive cells in the CD45.1+ (donor cells) and CD3+ (T cell) gates of animals that received transplants of HSCs/HPCs (■) and TCs (□). Engraftment of transferred gene-modified T cells was at least equal, if not higher, compared with HSCs/HPCs. Error bars represent SD.
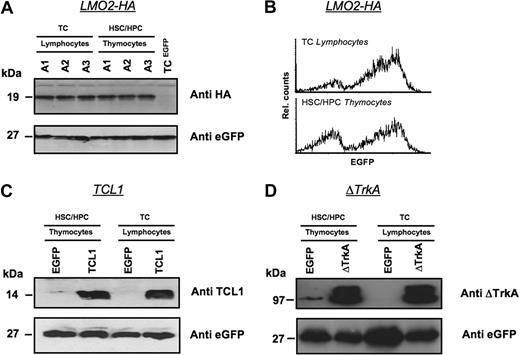
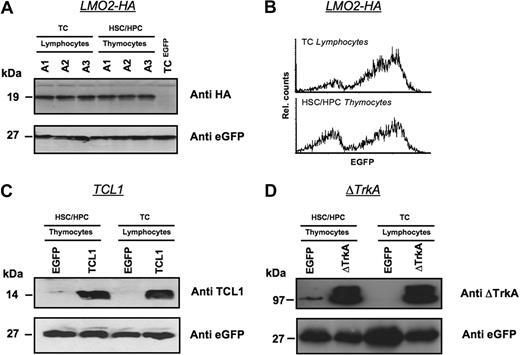
Oncogene expression was also analyzed directly for a subset of HSC/HPC and T cell–repopulated animals by Western blot (Figure 4). Three animals received transplants of MP91-LMO2-HA–transduced HSC/HPC and T cells and killed 6 weeks after transplantation. Isolated thymocytes of HSC/HPC-transplanted animals and T lymphocytes of T cell–transplanted animals showed comparable expression levels of LMO2-HA (Figure 4A). eGFP served as a loading control and MP91-eGFP transduced mature T cells served as a negative control for LMO2-HA expression. In line with the Western blot analysis, comparable expression profiles for LMO2-HA and eGFP were detected by flow cytometry in lymphocytes and thymocytes of T cell– and HSC/HPC-transplanted animals, respectively (Figure 4B).
Expression levels of oncogenes in T lymphocytes and thymocytes after transplantation of transduced HSCs/HPCs and mature T cells. Animals were killed 6 weeks after transplantation, and Western blot analysis was performed for the expression of LMO2-HA (A,B), TCL1 (C), and ΔTrkA (D) in thymocytes of HSCs/HPCs and T lymphocytes of TC-transplanted animals. Lymphocytes of MP91-eGFP–transduced mature T cells and thymocytes of MP91-eGFP-transduced progenitor cells were used as negative controls. eGFP expression served as a loading control to ensure equal quantities of gene-modified cells. For MP91-LMO2-HA–transduced cells, flow cytometric analysis of lymphocytes and thymocytes of TC- and HSC/HPC-transplanted animals showed comparable expression intensities (B). In panel A, A1-3 indicates number of animals killed.
Expression levels of oncogenes in T lymphocytes and thymocytes after transplantation of transduced HSCs/HPCs and mature T cells. Animals were killed 6 weeks after transplantation, and Western blot analysis was performed for the expression of LMO2-HA (A,B), TCL1 (C), and ΔTrkA (D) in thymocytes of HSCs/HPCs and T lymphocytes of TC-transplanted animals. Lymphocytes of MP91-eGFP–transduced mature T cells and thymocytes of MP91-eGFP-transduced progenitor cells were used as negative controls. eGFP expression served as a loading control to ensure equal quantities of gene-modified cells. For MP91-LMO2-HA–transduced cells, flow cytometric analysis of lymphocytes and thymocytes of TC- and HSC/HPC-transplanted animals showed comparable expression intensities (B). In panel A, A1-3 indicates number of animals killed.
In an analogous experimental setup, TCL1 and ΔTrkA expression was also analyzed in thymocytes and lymphocytes after HSC/HPC and T-cell transplantation, respectively (Figure 4C,D). Again, MP91-eGFP transduced cells were used as negative controls. Thymocytes and T lymphocytes showed similar expression of TCL1 and ΔTrkA relative to eGFP, which again served also as a control for equal loading.
Oncogenes transform primary murine HSCs/HPCs
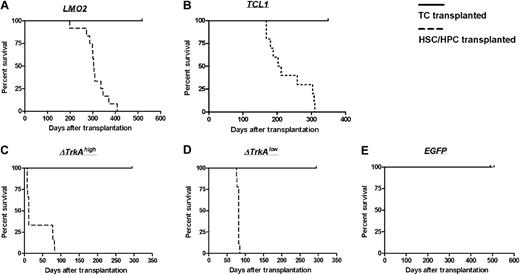
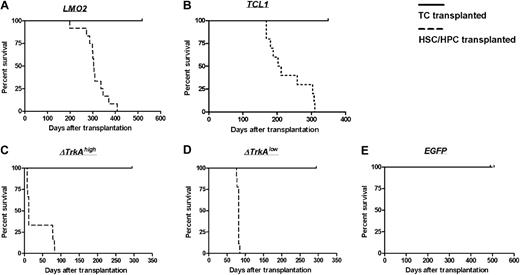
After transplantation of oncogene-transduced HSCs/HPCs, all animals developed hematologic malignancies after characteristic latency periods (Figure 5). Animals that received transplants of MP91-LMO2–transduced HSCs/HPCs developed T lymphoblastic leukemia after 198 to 408 days. An immature phenotype for CD4 and CD8 was primarily observed (10 of 12; Table 1), in contrast to the double negative (DN) phenotype described for LMO2 transgenic mice.8 We found the following organs to be enlarged: thymus (enlarged thymi up to 0.8 g, control mice 0.02 g; Figure S1A), spleen (splenomegaly up to 0.6 g, control mice 0.09 g) and in some cases also lymph nodes (lymphoma up to 1.3 g for mesenteric, inguinal, and superficial cervical lymph nodes, control mice 0.05 g). In most of the cases (7 of 8 animals analyzed), WBCs were elevated (up to 0.2 × 10⁹/L [200 × 103/μL], control 0.015 × 10⁹/L [15 × 103/μL]; Tables 1 and S1A).
Survival of TC- and HSC/HPC-transplanted animals. Animals that received transplants of HSCs/HPCs transduced with the oncogenes LMO2 (A), TCL1 (B), ΔTrkAhigh (C), or ΔTrkAlow (D) developed hematologic malignancies after characteristic latency periods (A-D,  ). Control animals that received transplants of MP91-eGFP (E) and recipients of TC transplants survived throughout the observation time (A-E, —) with no indication of leukemia/lymphoma.
Survival of TC- and HSC/HPC-transplanted animals. Animals that received transplants of HSCs/HPCs transduced with the oncogenes LMO2 (A), TCL1 (B), ΔTrkAhigh (C), or ΔTrkAlow (D) developed hematologic malignancies after characteristic latency periods (A-D,  ). Control animals that received transplants of MP91-eGFP (E) and recipients of TC transplants survived throughout the observation time (A-E, —) with no indication of leukemia/lymphoma.
The cohort of MP91-TCL1 HSC/HPC-transplanted animals showed a larger variety in tumor phenotypes. Leukemia/lymphoma developed 168 to 310 days after transplantation (Table S1B); thus, leukemia developed much more rapidly than in TCL1 transgenic animals, which were reported to develop leukemia/lymphoma at 450 to 600 days of age.9 Three of 9 animals developed leukemia/lymphoma of a single positive (SP) phenotype, 2 were CD4+ and one was CD8+. Two of 9 showed an immature DP phenotype, and the remaining animals (4 of 9) developed CD19+ tumors at later time points (259-310 days after transplantation), indicative of a B-cell malignancy (Table 1). TCL1-induced leukemias/lymphomas were characterized by massive enlargement of lymph nodes (up to 3.4 g; Table S1B; Figure S1D), thymus, and spleen. One of the animals that received a transplant (TCL1_A3) presented a distinct and unclear phenotype with massive subcutaneous infiltration and an enlarged liver (4 g, control 1 g; Table S1B). Unfortunately, it was not possible to determine a specific lineage phenotype, as none of the tested markers (CD45.1, CD3, TCR, CD8, CD4, CD19, CD11b) stained cells of the subcutaneous infiltrate and only a very dim eGFP expression was observed. Again, the majority (5 of 7) of mice with TCL1 lymphomas were leukemic with WBCs up to 0.096 × 10⁹/L (96 × 103/μL; Table S1B).
In more than half of the mice (5 of 9) that received transplants of SF91-ΔTrkAhigh–transduced HSCs/HPCs, we observed a hyperacute myeloid proliferation, previously termed “transient leukemia” (TL),10 with a latency of less than 12 days (Table 1). This TL was characterized by significant spleen enlargement (up to 4.8 g; Table S1C). As previously described,10 all animals that survived TL (4 of 9) subsequently developed lymphoblastic leukemia of a DP phenotype (Table 1), which was characterized by a gross thymic mass (up to 0.9 g). Interestingly, in the ΔTrkAlow group, only the DP T lymphoblastic leukemia phenotype was observed (9 of 9), with a latency of 76 to 85 days (Table S1D) without any signs of TL.
For all oncogene groups, histopathology of diseased animals showed massive leukemic blast infiltrations in all analyzed organs, including liver, lung, heart, kidney, spleen, brain, bone marrow, and thymus (Figure S1; data not shown).
To investigate the contribution of chromosomal translocation to leukemogenesis potentially caused by recombinase activity in the thymocyte population of HSC/HPC-transplanted animals, we transplanted RAG-1–deficient HSCs/HPCs transduced with LMO2. RAG-1−/− HSCs/HPCs were susceptible to transformation by LMO2 at a level comparable with wild-type cells (Figure S2). This result clearly shows that recombinase activity is not required for transformation of thymic precursors in our experimental setup.
HSC/HPC-derived tumors were characterized by oligoclonal to monoclonal integration site profiles (Figure S3A-C). Animals 3 and 4 (ΔTrkAhigh_A3 +, A4 +) of the ΔTrkAhigh group showed a highly polyclonal pattern, which was described previously as typical for the TL phenotype (Figure S3C lanes 2 and 3).10 In contrast, leukemias occurring with a longer latency had monoclonal patterns, indicating that secondary mutations contributed to leukemogenesis.
To analyze the potential contribution of retroviral vector insertional mutagenesis to leukemogenesis, integration sites of the T lineage leukemias were mapped. For the 3 oncogene vectors, genomic regions flanking the retroviral integrations in the leukemias/lymphomas obtained using LM-PCR were sequenced and aligned to the mouse genome to identify adjacent genes. For ΔTrkA, only the low transduction group was analyzed. Hit loci were examined for the nearest genes to the vector integrations as well as the genes within a 100-kb upstream and downstream window. Genes in this window were analyzed for appearance in the RTCGD33 and by gene ontology annotations, such as IDDb and PANTHERDB, which describe the biologic functions of genes. Overrepresented and underrepresented biologic processes and PANTHERDB pathways were retrieved by comparing the sample set to a reference list consisting of all genes in the NCBI36 database using a multiple testing corrected binomial test.
In the dataset obtained with ΔTrkAlow transduced cells, 2 hits, Prkcq and Mapk11, were found to be represented in several signaling pathways (Table S2). The LMO2 and TCL1 datasets did not contain any genes involved in multiple pathways.
Biologic process gene ontology annotation for the different groups showed that in all datasets genes involved in the high level process “signal transduction” were overrepresented, whereas only few oncogenes and tumor suppressor genes were located next to or near the integrations.
Comparing genes within 100 kb of the integrations in each group with the genes present in RTCGD, we obtained a strikingly large number of integrations that had at least one RTCGD gene within a 100-kb window. Taken together with the fact that in all experimental groups the biologic process “signal transduction” is found frequently, this might either show preferential retroviral integration near genes within these groups or provide a set of genes that collaborate with the transgene in oncogenesis (Tables S2,3). In one case, in the LMO2 group, a gene was found (Snx12) that was previously reported to be a possible collaboration partner of the oncogene.34 A detailed list of all integration sites for HSC/HPC-derived tumors can be found in the supplemental data (Table S4; A-LMO2, B-TCL1, C-ΔTrkAlow).
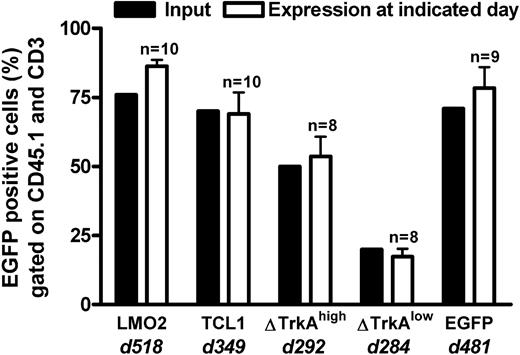
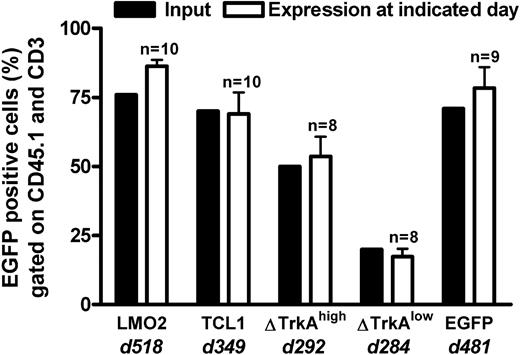
Primary mature T cells cannot be transformed after transduction with T-cell oncogenes and show an oligoclonal to polyclonal integration pattern. None of the animals that received transplants of control-vector–transduced HSCs/HPCs (MP91-eGFP) nor any of the T cell–transplanted animals developed leukemia/lymphoma throughout the follow-up period of up to 518 days (Figure 5). Mature T cells showed a stable high-level expression of eGFP (Figure 6; data not shown) and had to be serially transplanted every 12 to 16 weeks because of massive colitis that developed in the animals 3 to 4 months after T-cell transfer. Thereby, extensive in vivo observation periods for gene-modified mature T cells were achieved with no decrease in transgene expression (Figure 6). In total, 45 T cell–transplanted animals were observed for the different oncogene groups: LMO2 (10 animals), TCL1 (10 animals), ΔTrkAhigh (8 animals), ΔTrkAlow (8 animals), and eGFP (9 animals). Subsequent to death, lymph nodes of repopulated animals were isolated and single-cell suspensions were analyzed by flow cytometry after staining for CD45.1, CD3, CD8, and CD4. Relative to the input, CD4/CD8 ratios in lymph nodes, spleen, and peripheral blood changed dramatically in reconstituted animals. After ex vivo stimulation, expansion, and transduction, most of the transferred T cells displayed a cytotoxic, CD8 phenotype (∼90%), which declined to a more natural proportion after long-term repopulation, as shown for the eGFP group (Figure S4; data not shown). Surprisingly, expression levels in the repopulated T cells were comparable with the input level of eGFP in the transplant. All animals were thoroughly investigated for signs of leukemia. No enlargement of the spleen, lymph nodes, or any indication of leukemia was observed.
Percentage eGFP-expressing cells in the lymph nodes of TC-transplanted animals. T cell–transplanted animals were killed after long-term follow-up of genetically modified mature T cells. eGFP expression (gated on CD45.1 and CD3) in the lymph nodes of killed animals (□) was compared with the input at transplantation (■) for each transplanted population. d indicates days after transplantation. n = number of transplanted animals. The high level of eGFP expression, even after a very long observation time, indicated that no vector silencing was observed. Error bars represent SD.
Percentage eGFP-expressing cells in the lymph nodes of TC-transplanted animals. T cell–transplanted animals were killed after long-term follow-up of genetically modified mature T cells. eGFP expression (gated on CD45.1 and CD3) in the lymph nodes of killed animals (□) was compared with the input at transplantation (■) for each transplanted population. d indicates days after transplantation. n = number of transplanted animals. The high level of eGFP expression, even after a very long observation time, indicated that no vector silencing was observed. Error bars represent SD.
For each T cell–transplanted group (except the ΔTrkAlow), 5 animals were examined for clonality by LM-PCR. Furthermore, eGFP, LMO2, and ΔTrkAhigh populations were compared with the transplant. LM-PCR analysis revealed an oligoclonal to polyclonal integration pattern for long-term T-cell populations after prolonged follow-up (Figure S5). After shotgun cloning of the LM-PCR products of the lymph nodes from the eGFP (4 animals) and ΔTrkAhigh group (5 animals), 48 DNA clones were analyzed per animal. After trimming and processing, the remaining 98 (61 for ΔTrkAhigh, 37 for eGFP) sequences were aligned to the NCBI mouse genome (NCBI37). All genes within 100 kb of the insertion (79 for ΔTrkAhigh, 125 for eGFP) were analyzed. The gene ontology biologic processes were determined using PantherDB. Table S5 shows the biologic processes, which were found to be significantly overrepresented or underrepresented relative to the NCBI mouse reference dataset. Although T cells were observed for a long period of time in vivo (eGFP group: 481 days, ΔTrkAhigh group: 292 days), integrations near proliferation or tumor-supporting genes were not overrepresented in the analyzed datasets comparing the eGFP and ΔTrkAhigh integrations directly. However, significantly more integrations near genes from the PANTHERDB biologic processes “other signal transduction” and “chromatin packaging and remodeling” were found in the ΔTrkAhigh group relative to the eGFP group (Table S5, numbers in bold). In general, the small number of animals and sequences analyzed do not support reliable conclusions. A detailed list of all identified integrations for all analyzed mature T cells is provided in Table S6A (eGFP) and Table S6B (ΔTrkA).
Discussion
In the present work, we directly compared the susceptibility of mature T cells and HSCs/HPCs to transformation after retroviral gene transfer with potent T-cell oncogenes. High transduction efficacies were achieved for both cell types with all 3 analyzed oncogenes: LMO2, TCL1, and ΔTrkA. A total of 52 HSC/HPC and 45 T cell–transplanted animals were evaluated. All animals that received transplants of HSCs/HPCs transduced with a T-cell oncogene developed leukemia/lymphoma after characteristic latency periods. In contrast, T cell–transplanted recipients showed no sign of hematologic malignancy throughout a follow-up of 284 to 518 days. Thus, even in this experimental “worst case scenario,” involving multiple retroviral vector insertions, continuously high expression of a potent oncogene, serial transplantation, and a long-term follow-up, mature T cells were not transformable and demonstrated an oligoclonal to polyclonal integration pattern.
Potential experimental artifacts can hardly explain the lack of transformation of mature T cells observed in this study. An insufficient expression level of the active oncogene in mature T cells was largely excluded because expression levels of the transgenes in mature T cells and thymic progenitors of the T cell– and HSC/HPC-transplanted mice, respectively, were carefully monitored and found to be comparable. As the expression of eGFP was detectable throughout the whole observation time, an immunologic control of potentially transformed mature T cells also seems unlikely, although eGFP has been described to be immunogenic in mice.35,36
One limitation of the experimental setting is that only memory T cells were examined for transformation, as gamma retroviral gene transfer ex vivo involves stimulation and expansion of T cells. This converts virtually all initially naive T cells to a memory cell phenotype. In future studies, transduction of naive T cells with T-cell oncogenes, using cytokine-displaying lentiviral vectors, could be attempted.37 On the other hand, the procedure for T-cell transduction used here closely resembled the protocols used in most, if not all, clinical gene therapy trials based on gamma retroviral gene transfer into primary T lymphocytes.
Although we chose potent oncogenes representing different mechanisms of T-lineage transformation, we cannot rule out that these genes may not be relevant in transformation of mature T cells. However, at least TCL1 is a relatively good choice, as this is the major proto-oncogene involved in the development of human mature T-cell leukemia/lymphoma.
Despite these experimental limitations, our results clearly show that memory T cells per se are less susceptible to transformation than T-lineage progenitors for the 3 potent T-cell oncogenes analyzed. Several characteristics of T-cell biology could be responsible for this resistance. Telomerase, which is absent in most normal somatic cells, is highly active in immature thymocyte subpopulations. In contrast, telomerase activity is extremely low in quiescent peripheral blood lymphocytes.38 However, telomerase activity is inducible in mature T cells by CD3/CD28 and mitogen stimulation.38,39 Furthermore, telomere length correlates with the in vivo persistence of transferred T cells,40 which was very extensive in the study, indicating that telomerase must have been active in the engrafted T cells. We thus do not favor the interpretation that telomerase activity is the rate-limiting component that explains the higher susceptibility to transformation of HSCs/HPCs.
In addition, immature thymocytes may undergo more mitotic cycles, subsequently accumulating additional mutations. However, in our experiments, serial transplantation induced repeated lymphopenia-driven homeostatic proliferation, and in the experimental setting used, T cells also accumulate a high number of cell divisions over time.
Chromosomal translocations during recombination of the TCR genes can lead to aberrant expression of developmentally important transcription factors in differentiating thymocytes. Such translocations could serve as a second hit in transduced HSC/HPC-transplanted animals not found in mature T cells and may explain the discrepancy in cancer development in these 2 cell populations. Unfortunately, tumor cells could not be grown in vitro for chromosomal analysis in this study. Karyotyping was successfully performed for only one LMO2-induced leukemia/lymphoma and showed a trisomy 17 but no translocations (data not shown). However, the observation that HSCs/HPCs from RAG-1–deficient mice, which do not undergo significant TCR recombination, were susceptible to transformation by LMO2 at a level comparable with wild-type mice argues against a significant contribution of chromosomal translocation to leukemogenesis in the experimental setting used here (Figure S2). T-cell leukemia after LMO2 transduction of RAG-1–deficient HSCs/HPCs was also described by others in a double-transgenic mouse model.41 This observation leads to the conclusion that the role of TCR recombination at least in the tumorigenesis of LMO2 is negligible.
An interesting potential mechanism of controlling leukemogenesis in mature T cells could be the competition of T lymphocytes with a similar TCR for a stimulatory niche that consists of the corresponding major histocompatibility complex (MHC)/self-peptide complexes. This clonal competition restricts the size of T-cell clones and has been described as a homeostatic mechanism to preserve the polyclonality of T cells.42 Accordingly, expansion of a premalignant T-cell clone that still has a certain dependence on MHC/self-peptide interaction for survival would be restricted by the size of the corresponding MHC/self-peptide niche. Studies are under way to test this hypothesis.
In conclusion, even under extreme conditions of oncogene challenge in combination with random vector insertion, mature T cells could not be transformed. This strongly indicates that especially polyclonal T-cell therapies based on transgenes, which do not provide proliferative advantage, such as the herpes simplex-thymidine kinase or anti-HIV principles, do not involve a major risk of insertional mutagenesis and development of cancer.43-45 The safety of infusing transduced oligoclonal T-cell populations or T cells modified with nonneutral transgenes, such as those encoding TCRs, must be evaluated, as this might affect the dynamics of modified T-cell populations. In a more general perspective, our data indicate that even mature T-cell leukemias and lymphomas, such as TCL1-induced malignancies seen in humans, may arise from transformed thymic precursors and not from mature T cells.
An Inside Blood analysis of this article appears at the front of this issue.
The online version of this article contains a data supplement.
The publication costs of this article were defrayed in part by page charge payment. Therefore, and solely to indicate this fact, this article is hereby marked “advertisement” in accordance with 18 USC section 1734.
Acknowledgments
The authors thank Tefik Merovci, Margot Landersz, and Janine Kimpel for technical assistance, Felix Hermann for discussions, and Anna Jauch, Brigitte Schoell, and Heidi Holtgreve-Grez for karyotype analysis of some of the samples used in this work.
The presented publication is part of the PhD theses of S.N. and K.C.
This study was supported by the Bundesministerium für Forschung und Technologie (grant 01GU0507), TreatID (Berlin, Germany), and the Deutsche Forschungsgemeinschaft (Bonn, Germany; FE568/9-1) within the SPP1230.
Authorship
Contribution: S.N. designed and performed research, analyzed data, and wrote the paper; M.H. performed research; K.C. performed LM-PCR and integration site analysis; B.F. edited the paper and contributed to research design; Z.L. and C.B. provided retroviral vectors and contributed to research design; C.B. edited the paper; J.M. performed Western blots; M.H.B. performed bioinformatic analysis of the integration sites; S.H. and M.-L.H. performed pathologic/histologic analysis of leukemic samples; and D.v.L. designed research, analyzed data, and wrote the paper.
Conflict-of-interest disclosure: The authors declare no competing financial interests.
Correspondence: Sebastian Newrzela, Georg-Speyer-Haus, Institute for Biomedical Research, Frankfurt, Hessen, Germany; e-mail: newrzela@em.uni-frankfurt.de; or Dorothee von Laer, Georg-Speyer-Haus, Institute for Biomedical Research, Frankfurt, Hessen, Germany; e-mail: laer@em.uni-frankfurt.de.


 ). Control animals that received transplants of MP91-eGFP (E) and recipients of TC transplants survived throughout the observation time (A-E, —) with no indication of leukemia/lymphoma.