Abstract
Asthma is a comorbid condition associated with increased rates of pain, acute chest syndrome, and premature death in human sickle cell disease (SCD). We developed an experimental asthma model in SCD and control mice expressing either normal human or murine hemoglobin to determine its effect on mortality and lung pathology. To induce lung inflammation, experimental mice were sensitized to ovalbumin (OVA) by subcutaneous OVA implantation (Sen), allowed 2 weeks to recover, and then divided into 2 groups, each receiving over a subsequent 10-day period the same dosage of aerosolized OVA but 2 different levels of exposure: 15 minutes (LoSen) and 30 minutes (HiSen). During recovery, 10% of SCD mice died compared with no deaths in control mice. An additional 30% of HiSen SCD mice died during aerosolization compared with 10% in LoSen SCD. Histologic indices of lung inflammation (eg, eosinophil recruitment, airway and vessel wall thickening, and immunoreactive TGFβ and fsp-1) and bronchial alveolar lavage fluid eosinophil peroxidase activity differentially increased in sensitized mice compared with unsensitized mice. Our findings indicate SCD mice with experimentally induced asthma are more susceptible to death and pulmonary inflammation compared with control mice, suggesting that asthma contributes significantly to morbidity and mortality in SCD.
Introduction
The major causes of morbidity and mortality in sickle cell disease (SCD) are initiated by tissue ischemia and infarction due to vascular occlusion that results in progressive organ damage. The etiology of vaso-occlusion is unclear and likely reflects the complex interplay between the sickle red blood cell, the injured vessel wall, and increased inflammation. In support of this notion, there is considerable evidence for increased inflammation in both human and murine SCD. The leukocyte count is elevated in SCD and correlates with a more severe clinical course, including increased risk of stroke and early death.1-4 In addition, patients with SCD have chronically elevated acute-phase proteins, which often increase further during crisis.5 The fact that patients with SCD have increased numbers of circulating endothelial cells that increase to even higher levels during times of vaso-occlusive crises, provide strong evidence that endothelial inflammation and injury play important roles in the mechanisms impairing vascular function in SCD.6 These circulating endothelial cells express an activated phenotype, including increased expression of the adhesive molecules VCAM-1, E-selectin, and ICAM-1.6 In parallel with these human studies, additional experiments showed that sickle cell disease mice also have increased circulating endothelial cells that express higher levels of E-selectin, VCAM, and ICAM-1.7 Other studies have shown that sickle cell disease increases the expression of tissue factor in the veins of the lungs in response to ischemia/reperfusion by a mechanism that can be inhibited by lovastatin.8 Moreover, plasma levels of the proinflammatory cytokines IL-1β, IL-6, IFN-γ, and TNF-α are sometimes elevated in human SCD at steady state, with further increases during acute vaso-occlusive events.9 Again, with respect to developing relevant murine models of human disease, levels of IL-6 are elevated in SCD mice.10
To further support the claim that SCD is a “proinflammatory state,” Holtzclaw et al found that transgenic SCD mice have increased mortality and exaggerated inflammatory responses to low-dose LPS challenge compared with control mice.11 This included elevated levels of TNF-α, IL-1β, and soluble VCAM-1 in the serum and bronchoalveolar lavage fluid of SCD mice. Taken together, these studies in individuals with SCD and experimental murine models of SCD suggest that sickle cell anemia increases inflammation.
Asthma is common among African Americans, the population in the United States that is predominantly affected with SCD, with a prevalence in non-Hispanic African American individuals of at least 9%.12 As an inflammatory, comorbid condition, asthma likely contributes to sickle hemoglobin–induced vascular and organ pathologies.12 To support the global hypothesis that inflammation may increase SCD morbidity and mortality, we recently demonstrated that a diagnosis of asthma among children with SCD significantly increases the incidence of pain and acute chest syndrome compared with children without asthma.13,14 Furthermore, we have shown that, among individuals with SCD, asthma is an independent risk factor for death.15 On the basis of these reports, it seems logical to view asthma as a comorbid condition in SCD that has significant adverse effects on the health of SCD individuals, including increasing the risk of death.
To evaluate the contribution of chronic airway inflammation to SCD pathologies, we examined the effects of experimentally induced asthma on mortality and lung pathology in a murine model of severe SCD. Asthmalike pathological changes were induced in mice using a modified ovalbumin (OVA) sensitization protocol previously established in C57BL/6 mice.16,17 We found that SCD mice have exaggerated inflammatory responses to OVA sensitization compared with control mice.
Methods
Mice
Institutional Animal Care and Use Committee of the Medical College of Wisconsin approved these studies. We used the Berkeley murine model of SCD (SCD mice). Erythrocytes from adult Berkeley SCD mice (Tg(Hu-miniLCRα1Gγ AγδβS) Hba0//Hba0 Hbb0//Hbb0) exclusively express human sickle hemoglobin and have a phenotype that closely mimics many features of severe SCD in humans.18 This includes a moderately severe hemolytic anemia (hematocrit: ∼ .25 [25%]; reticulocytes: > .30 [30%]), irreversibly sickled red cells on the blood smear, and multiorgan pathology.18,19 The Berkeley SCD mice express an excess of alpha globin chain synthesis, indicating that these mice also possess a mild β-thalassemia phenotype. For controls, we used both Berkeley transgenic hemoglobin A mice (HbA mice) and C57BL/6 mice (WT mice; The Jackson Laboratory, Bar Harbor, ME). Adult HbA mice (Tg(Hu-miniLCRα1Gγ AγδβA) Hba0//Hba0 Hbb0//Hbb0) express only normal human HbA in circulating erythrocytes and are derived from the same Berkeley mixed genetic background.18 The C57BL/6 (WT) mice represent one of the strains in the Berkeley mixed genetic background and express only normal murine hemoglobins. Both SCD and HbA mice were generated from a colony established at the Biomedical Resource Center (BRC, Medical College of Wisconsin, Milwaukee, WI). Both male and female SCD mice and HbA mice were used for studies, whereas only male WT mice were used. All of the mice used were approximately 12 to 14 weeks old. Mice were housed in sterile autoclavable microisolation cages. Standard mouse chow and water were provided ad libitum. All protocols were approved by the Institutional Animal Care and Use Committee (IACUC) of the Medical College of Wisconsin.
OVA sensitization
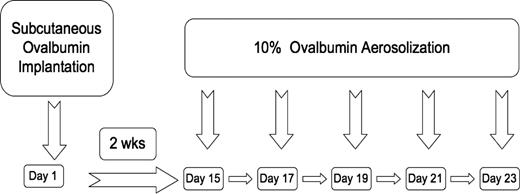
SCD, HbA, and WT mice were either placed into a control unsensitized (UnSen) group or an ovalbumin-sensitized (Sen) group. OVA sensitization was achieved using a modification of a protocol previously described by de Siqueira et al16 (Figure 1). This protocol was chosen for OVA sensitization because it has been shown to sensitize C57BL/6 mice reproducibly for long periods of time with exaggerated allergic responses to OVA. C57BL/6 mice are not easily sensitized to OVA by intraperitoneal injection,20,21 as opposed to our current method of subcutaneous implantation. Furthermore, we have found that if the OVA is heat denatured and then placed under the skin, it remains a constant source of antigen throughout the study. When the mouse inhales aerosolized OVA, robust allergic responses are routinely observed.17 Briefly on day 1, mice were anesthetized (halothane; Halocarbon Laboratories, River Edge, NJ) and heat-denatured OVA fragment (80 mg, 5 × 2 × 2 mm) was implanted subcutaneously in the dorsal aspect of the neck. The incision was closed with stainless steel clips and the mouse allowed to recover. Implantation of the heat-denatured OVA fragment initiates sensitization. On day 15, the implanted mice were exposed to aerosolized OVA (10% in PBS) for either 15 minutes (LoSen) or 30 minutes (HiSen) every other day for 10 days. Twenty-four hours after the last OVA challenge, the mice were deeply anesthetized (halothane) and exsanguinated and the lungs removed for analysis.
Timeline showing OVA subcutaneous implantation relative to OVA aerosolization in WT, HbA, and SCD mice.
Timeline showing OVA subcutaneous implantation relative to OVA aerosolization in WT, HbA, and SCD mice.
Nine SCD mice died during anesthesia to implant the OVA and were not included in the study. Mice received 100% O2 during halothane anesthesia and were warmed during recovery. Medical-grade compressed air was provided during exposure to aerosolized OVA. At no time did the FIO2 drop below 21%. No deaths occurred during exposure to the aerosolized OVA. Mice that died and were included in the mortality statistics (Figure 2) died approximately 3 to 4 days after surgical implantation of the OVA fragment, indicating that death was unlikely related to complications of anesthesia.
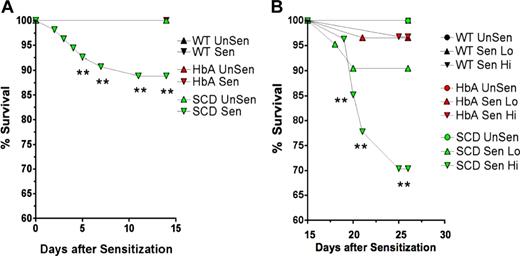
Survival curves. These line graphs show the percentage of survival for WT, HbA, and SCD mice from (A) day 1 of OVA implantation to day 15 prior to exposure to aerosolized OVA and from (B) day 15 to day 23 for UnSen, LoSen, and HiSen WT, HbA, and SCD mice. Total numbers of mice were as follows: On day 1, WT mice (n = 28) were placed in the UnSen protocol or were subjected to OVA implantation (n = 38). On day 15, all of the OVA-implanted WT mice that survived (100%) were divided into the LoSen protocol (n = 14) and the HiSen protocol (n = 24). On day 1, HbA mice (n = 25) were placed in the UnSen protocol or were subjected to OVA implantation (n = 60). On day 15, all of the OVA-implanted HbA mice that survived (n = 60) were divided into the LoSen protocol (n = 29) and the HiSen protocol (n = 31). On day 1, SCD mice (n = 21) were placed in the UnSen protocol or were subjected to OVA implantation (n = 54). On day 15, the surviving OVA-implanted SCD mice (n = 48) were divided into the LoSen protocol (n = 21) and the HiSen protocol (n = 27). Circles and triangles represent mice that died (when less than 100%) and lived (when = 100%) after OVA sensitization (days 1-14) or after OVA aerosolization (days 15-23). ** indicates significant increase in mortality (P < .01).
Survival curves. These line graphs show the percentage of survival for WT, HbA, and SCD mice from (A) day 1 of OVA implantation to day 15 prior to exposure to aerosolized OVA and from (B) day 15 to day 23 for UnSen, LoSen, and HiSen WT, HbA, and SCD mice. Total numbers of mice were as follows: On day 1, WT mice (n = 28) were placed in the UnSen protocol or were subjected to OVA implantation (n = 38). On day 15, all of the OVA-implanted WT mice that survived (100%) were divided into the LoSen protocol (n = 14) and the HiSen protocol (n = 24). On day 1, HbA mice (n = 25) were placed in the UnSen protocol or were subjected to OVA implantation (n = 60). On day 15, all of the OVA-implanted HbA mice that survived (n = 60) were divided into the LoSen protocol (n = 29) and the HiSen protocol (n = 31). On day 1, SCD mice (n = 21) were placed in the UnSen protocol or were subjected to OVA implantation (n = 54). On day 15, the surviving OVA-implanted SCD mice (n = 48) were divided into the LoSen protocol (n = 21) and the HiSen protocol (n = 27). Circles and triangles represent mice that died (when less than 100%) and lived (when = 100%) after OVA sensitization (days 1-14) or after OVA aerosolization (days 15-23). ** indicates significant increase in mortality (P < .01).
Histopathology
The standard protocol for fixing the lungs was to inflate the lung with 0.5 mL PBS-Zn-formalin prior to removal. The tissues were embedded in paraffin, and sections were cut (5 μm) and stained either with hematoxylin and eosin (H&E) to enhance cytoplasmic and nuclear structures or with McLetchie trichrome to visualize collagen deposition and that would be used to assess thickening of basement membranes of airway epithelium and pulmonary vessels. All histologic samples were examined, photographed, and scored in a blinded fashion. Images were captured on a Zeiss Imager.Z1 microscope using 40×/0.95 aperture objective and Axiocam HRc camera and Axiovision Software (version 4.6) (all from Carl Zeiss, Heidelberg, Germany). Airway basement membrane and vessel wall thickening were determined as follows: the perpendicular distance from a tangential line on the outer edge to the inner edge of the basement membrane or vessel wall was measured 4 times at 4 different points around the circumference. The 4 measurements were averaged and the average was recorded for each vessel. Infiltration of eosinophils was quantified as follows: Cells were counted in 10 fields (100 μm2) randomly selected in the peribronchial and perivascular regions in the lung sections of each mouse.
Immunofluorescence of TGF-β1 and fsp-1
Immunofluorescence was performed on 5-μm sections of paraffin-embedded, PBS-Zn-formalin–fixed lungs. Two sections were present on each slide. Sections were deparaffinized with xylene (3 changes) and dehydrated in a descending alcohol row. The sections were incubated separately with rabbit polyclonal antibodies against transforming growth factor beta 1 (TGF-β1) and fibroblast specific protein-1 (fsp-1) (1:50 for TGF-β1 and 1:100 for fsp-1; Santa Cruz Biotechnology, Santa Cruz, CA) and incubated for 30 minutes at 37°C. The slides were washed with PBS 3× and then incubated with Alexa Fluor 488 goat antirabbit IgG (H + L) (catalog no. A11055; Invitrogen-Molecular Probes, Eugene, OR) for 30 minutes at 37°C. Nuclei were counterstained for 3 minutes at room temperature with TO-PRO-3 iodide (642 nm/661 nm) (catalog no. T3605; Invitrogen-Molecular Probes). The slides were washed and mounted, and images were captured on a krypton argon laser Nikon Eclipse TE2000U confocal microscope (Melville, NY) using 10×/0.17 aperture objective with the total magnification of 100 (Ex/Em at 488 nm/580 nm for FITC and 633 nm/661 nm for TO-PRO-3) and IBM EXC1 software (Armonk, NY). Staining controls were slides incubated in the absence of the primary antibodies.
Total IgE assay
Total IgE was determined as previously described.17 Blood was collected directly from the heart into heparin and plasma separated from red cells, aliquoted, and stored at − 80°C until analysis. Total IgE was measured by enzyme-linked immunosorbent assay (ELISA). Briefly, 96-well flat-bottom polystyrene microplates (Fisher Scientific, Hampton, NH) were coated with anti–mouse IgE (2 μg/mL, 100 μL/well, 4 hours at room temperature, then 12 hours at 4°C) (PharMingen, San Diego, CA). After washing with PBS-Tween, the plates were blocked with 1% bovine serum albumin (BSA; Sigma-Aldrich, St Louis, MO) for 1 hour and the wells washed again. Serially diluted standards and test samples were then added to the plate and incubated for 12 hours at 4°C. Following another set of washes, biotinylated anti–mouse IgE was added to the well (room temperature, 1 hour; PharMingen). Excess biotinylated Ab was removed by washing and the wells were incubated with streptavidin peroxidase (1 hour, room temperature; Sigma-Aldrich). After washing the plate with PBS (200 μL, 3×), the reaction was initiated by adding 100 μL/well OPD-substrate (30 mg O-phenyldiamine hydrochloride in 50 mL sodium citrate, pH 4.0, with 0.25 mL of 3% hydrogen peroxide). The reaction was stopped by adding 50 μL/well sulfuric acid (2 N). Absorbance was measured at 490 nm using a Biotek EL312e plate reader (Winooski, VT).
Bronchoalveolar lavage fluid eosinophil peroxidase activity
After collecting the blood, the trachea of the mouse was cannulated and the lungs were washed with PBS (0.8 mL, 5 ×, 25°C). Bronchoalveolar lavage fluid (BALF) was collected and centrifuged to isolate suspended cells. The pelleted cells and the cell-free supernatant were separated and stored at −80°C until analysis. Eosinophil peroxidase (EPO) activity was determined on the isolated cells using a modified method of Schneider et al.22 Briefly, the BALF cell pellet was resuspended in 0.5 mL PBS, sonicated for 1 minute, and then centrifugated (20 000g, 10 minutes) to remove cell debris. The samples were frozen in liquid nitrogen, placed at −80°C for 20 minutes, removed, and then thawed. This step was repeated 2 more times. The freeze-fractured BALF samples were centrifuged for 30 minutes and the supernatant was transferred to a new tube. An aliquot of supernatant (100 μL) was incubated with OPD substrate (100 μL, 50 mM Hepes, pH 8.0, 6 mM KBr, 3 mM OPD, and 8.8 mM H2O2) for 30 minutes at 37°C. The reaction was halted by addition of 50 μL sulfuric acid (4N). Absorbances were measured at 450 nm on Turner Biosystems Modulus microplate reader (Sunnyvale, CA). EPO activity was expressed as Abs@450 nm/min.
Scoring airway epithelial desquamation
A 0 to 3 scoring system was used to assess airway epithelial desquamation. Normal intact airway epithelial lining equaled 0. Elongation and distortion of the cuboidal/columnar epithelial cells lining the airways equaled 1. Elongation associated with in folding of the epithelium and narrowing of the airway lumen equaled 2. Loss of epithelial cells resulting in broken airways equaled 3.
Statistical analysis
For the analysis of survival, a Kaplan-Meier analysis was performed with statistical significance determined by a log rank (Mantel-Cox) test. For the parameters of histologic and morphometric data, a 2-way ANOVA was performed (mouse group by level of sensitization) to determine the statistical differences between groups and their response to 2 levels of OVA sensitization. When a significant difference was found, the Tukey test was performed in the post hoc analysis to determine significant differences between experimental conditions. Analysis was performed with the Sigma-Stat (SyStat, San Jose, CA) or Prism GraphPad (version 4.0; GraphPad Software, San Diego, CA). Values are expressed as means plus or minus SEM unless otherwise specified.
Results
Mortality
The rate of death was higher in SCD mice compared with WT or HbA mice. Ten percent of SCD mice died after day 5 following OVA implantation (P < .01; Figure 2A). In contrast, no WT or HbA mice died during the first 15 days after OVA implantation. During the subsequent experimental days 15 to 23 during high-dose OVA aerosolization (HiSen), an additional 30% of the SCD mice died (P < .01). Decreasing OVA exposure to 15 minutes (LoSen) reduced the chance of death in SCD mice to approximately 10%, which was not significantly different from WT or HbA groups. Thus, reducing OVA from the HiSen to the LoSen dose protocol allowed more SCD mice to survive sensitization. None of the WT mice died at any point in the protocol. Furthermore, only approximately 4% of HbA mice died after treatment with either LoSen or HiSen aerosolization on days 15 to 23 (Figure 2B).
Blood markers of sensitization: total IgE
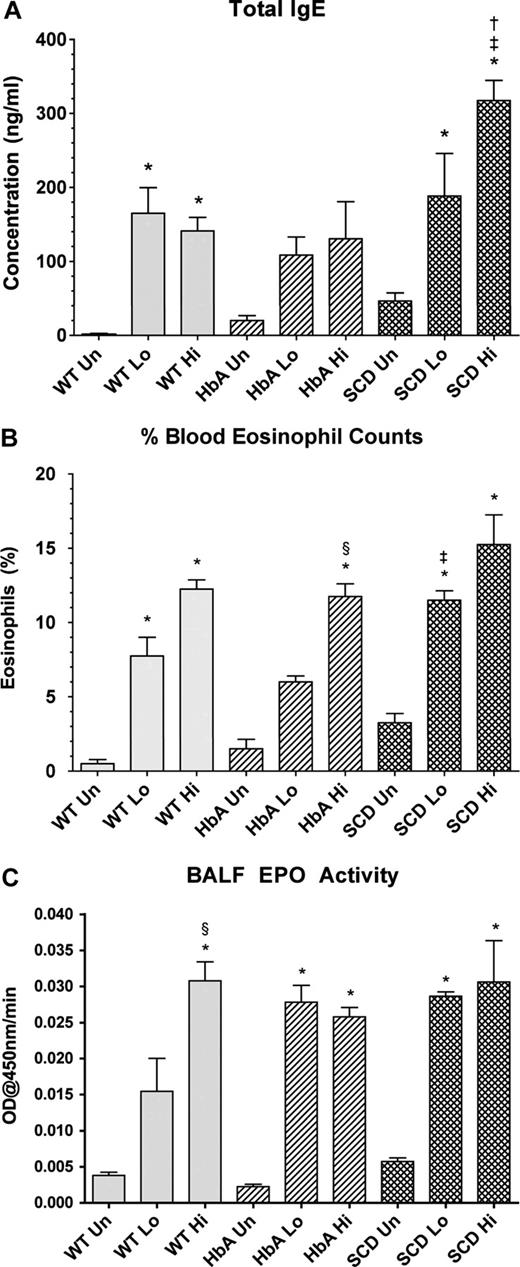
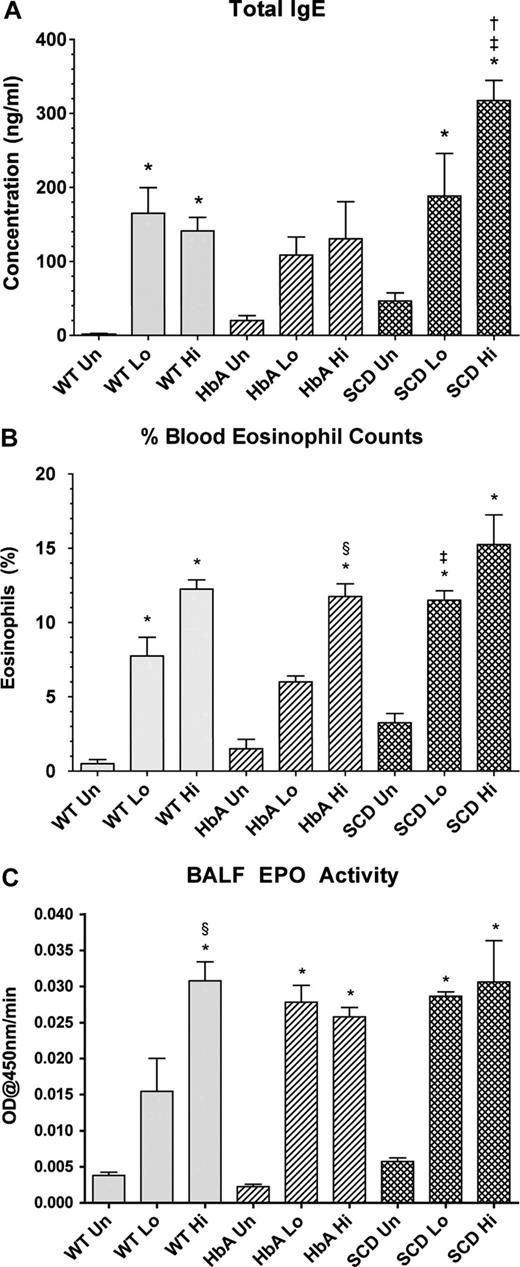
Marked increases in total IgE levels are often indicative of active asthma.23 OVA sensitization significantly increased IgE concentrations in WT-Lo or WT-Hi mice compared with WT-Un mice (Figure 3A). Although sensitization increased IgE in HbA mice, significance was not achieved. In contrast, sensitization of SCD mice markedly increased IgE. Moreover, IgE levels in SCD-Hi mice were increased more than in the WT-Hi or HbA-Hi mice (Figure 3A).
Blood and lung markers of inflammation. (A) Total IgE levels from UnSen (Un), LoSen (Lo) and HiSen (Hi) WT, HbA and SCD mice. (B) Percentage of peripheral blood eosinophil from Un, Lo, and Hi WT, HbA, and SCD mice. (C) BALF EPO activity from UnSen (Un), LoSen (Lo), and HiSen (Hi) WT, HbA, and SCD mice. * indicates significantly different from UnSen group within same strain; §, significantly different from LoSen (Lo) group within same strain; †, significantly different from wild-type (WT) group with same treatment; and ‡, significantly different from the HbA groups with same treatment. (P < .05, adjusted for the number of comparisons.)
Blood and lung markers of inflammation. (A) Total IgE levels from UnSen (Un), LoSen (Lo) and HiSen (Hi) WT, HbA and SCD mice. (B) Percentage of peripheral blood eosinophil from Un, Lo, and Hi WT, HbA, and SCD mice. (C) BALF EPO activity from UnSen (Un), LoSen (Lo), and HiSen (Hi) WT, HbA, and SCD mice. * indicates significantly different from UnSen group within same strain; §, significantly different from LoSen (Lo) group within same strain; †, significantly different from wild-type (WT) group with same treatment; and ‡, significantly different from the HbA groups with same treatment. (P < .05, adjusted for the number of comparisons.)
Blood markers of sensitization: peripheral blood eosinophils
Increased peripheral blood eosinophil counts directly correlate with severity of asthma in humans24 and mice.25 OVA sensitization markedly increased eosinophils in both WT-Lo and WT-Hi mice compared with WT-Un mice (Figure 3B). Similarly, OVA sensitization significantly increased eosinophil counts in both SCD-Lo and SCD-Hi mice compared with SCD-Un mice. In contrast, eosinophil counts in HbA-Lo mice were more modest and not significantly different from HbA-Un mice, although HbA-Hi mice eosinophils were increased compared with both HbA-Un and HbA-Lo mice. Moreover, SCD-Lo mice had a greater increase in eosinophil counts than HbA-Lo mice.
Lung markers of inflammation: BALF EPO activity
Measurements of BALF EPO activity are used to assess inflammatory responses to experimental allergenic challenges.22 BALF EPO activity increased in WT-Sen, HbA-Sen, and SCD-Sen mice after OVA sensitization and exposure to OVA aerosolization (Figure 3C). Interestingly, WT mice showed a graded EPO response to OVA sensitization, whereas responses for HbA and SCD mice were maximal regardless of the OVA sensitization level.
Histopathology
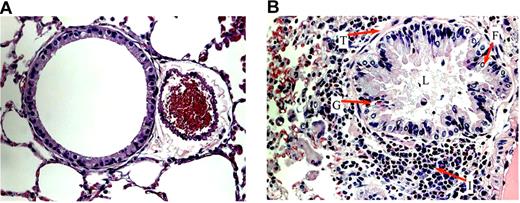
After OVA sensitization, SCD, HbA, and WT mice all exhibited marked increases in subepithelial, peribronchial, and perivascular inflammation compared with UnSen mice. The cells invading these regions were composed mainly of eosinophils (Figure 4B). We also noted patches of eosinophils in areas of mast cell degranulation (Document S1, available on the Blood website; see the Supplemental Materials link at the top of the online article) in sensitized mice. Eosinophils were noted in the lamina propria of the trachea and the bronchi (data not shown). Airway architecture in sensitized mice was distorted as evidenced by epithelial folding, lumen narrowing, goblet cell metaplasia, and subepithelial fibrosis compared with unsensitized mice (Figure 4B). In contrast, lung parenchyma in UnSen mice was clear, lacy, and essentially devoid of inflammatory cells (Figures 4A,5A).
Airway architecture in normal and sensitized mice. General pulmonary architecture in the unsensitized (A) and sensitized (B) mice. (A) In all groups of unsensitized mice, lung parenchyma was clear, lacy, and essentially devoid of inflammatory cells. (B) In the lung parenchyma of sensitized mice, epithelial folding and distortion (F), lumen narrowing (L), goblet cell metaplasia (G), eosinophil infiltration (I), and subepithelial fibrosis (basement membrane thickening, T) are evident. All images were captured at a magnification of 40×.
Airway architecture in normal and sensitized mice. General pulmonary architecture in the unsensitized (A) and sensitized (B) mice. (A) In all groups of unsensitized mice, lung parenchyma was clear, lacy, and essentially devoid of inflammatory cells. (B) In the lung parenchyma of sensitized mice, epithelial folding and distortion (F), lumen narrowing (L), goblet cell metaplasia (G), eosinophil infiltration (I), and subepithelial fibrosis (basement membrane thickening, T) are evident. All images were captured at a magnification of 40×.
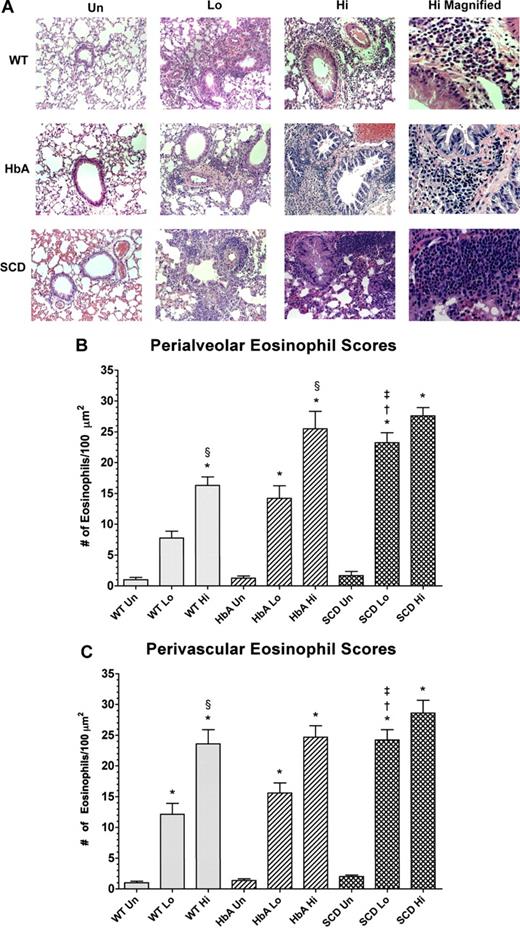
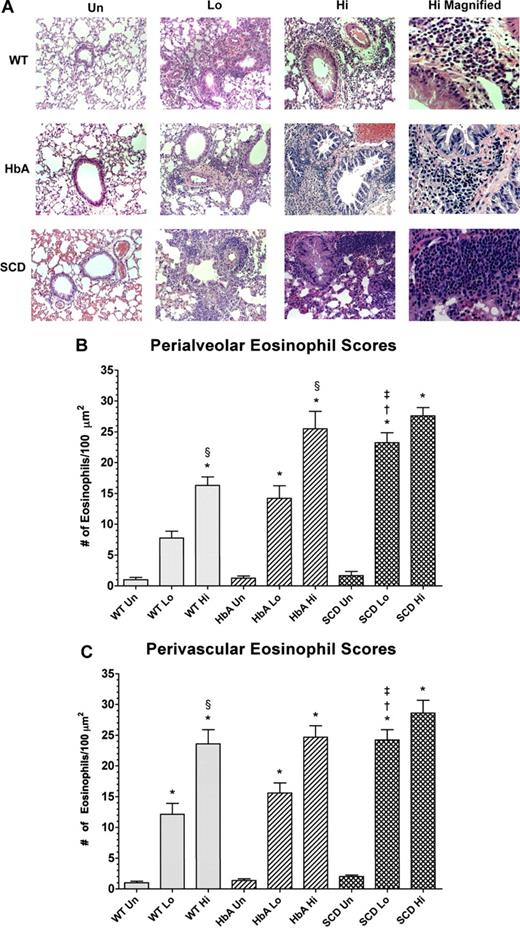
Histology of lungs from unsensitized and sensitized WT, HbA, and SCD mice. (A) This figure shows images of H&E staining of lungs from UnSen, LoSen, and HiSen WT, HbA, and SCD mice. First row: Images of lung sections from UnSen (Un), LoSen (Lo), and HiSen (Hi) WT mice. Second row: Images of lung sections from UnSen (Un), LoSen (Lo), and HiSen (Hi) HbA mice. Third row: Images of lung sections from UnSen (Un), LoSen (Lo), and HiSen (Hi) SCD mice. Eosinophil counts in the (B) peribronchial and (C) perivascular regions of the lungs from UnSen, LoSen, and HiSen WT, HbA, and SCD mice. Statistical analysis: * indicates significantly different from UnSen group within same strain; §, significantly different from LoSen (Lo) group within same strain; †, significantly different from wild-type (WT) group with same treatment; and ‡, significantly different from the HbA groups with same treatment. (P < .05, adjusted for the number of comparisons.)
Histology of lungs from unsensitized and sensitized WT, HbA, and SCD mice. (A) This figure shows images of H&E staining of lungs from UnSen, LoSen, and HiSen WT, HbA, and SCD mice. First row: Images of lung sections from UnSen (Un), LoSen (Lo), and HiSen (Hi) WT mice. Second row: Images of lung sections from UnSen (Un), LoSen (Lo), and HiSen (Hi) HbA mice. Third row: Images of lung sections from UnSen (Un), LoSen (Lo), and HiSen (Hi) SCD mice. Eosinophil counts in the (B) peribronchial and (C) perivascular regions of the lungs from UnSen, LoSen, and HiSen WT, HbA, and SCD mice. Statistical analysis: * indicates significantly different from UnSen group within same strain; §, significantly different from LoSen (Lo) group within same strain; †, significantly different from wild-type (WT) group with same treatment; and ‡, significantly different from the HbA groups with same treatment. (P < .05, adjusted for the number of comparisons.)
Airway epithelial desquamation increased in WT-Lo, WT-Hi, HbA-Lo, and HbA-Hi mice in a dose-dependent fashion (Table 1). Interestingly, in UnSen mice, desquamation was observed only in SCD mice (P < .05). Furthermore, within LoSen groups, airway epithelial desquamation was increased in SCD-Lo mice compared with WT-Lo or HbA-Lo mice (P < .05). Moreover, airway epithelial desquamation in SCD-Lo and SCD-Hi mice was essentially equal and maximally increased. Finally, responses of SCD mice to LoSen OVA sensitization were exaggerated compared with the responses of WT and HbA mice.
Eosinophil counts
Figure 5A shows eosinophil infiltration in response to OVA sensitization in the peribronchial and perivascular regions in lungs from WT, HbA, and SCD mice. Eosinophil infiltration in WT-Sen and HbA-Sen mice increased in a dose-dependent fashion (Figure 5B and 5C, respectively). In addition, the HiSen protocol induced maximal increases in eosinophil counts in all 3 groups. More importantly, eosinophil counts in SCD-Lo mice were greater (P < .05) than in WT-Lo and HbA-Lo mice. These data demonstrate that inflammatory responses in SCD-Lo mice are exaggerated compared with responses in WT-Lo and HbA-Lo mice.
Basement membrane thickening: collagen deposition
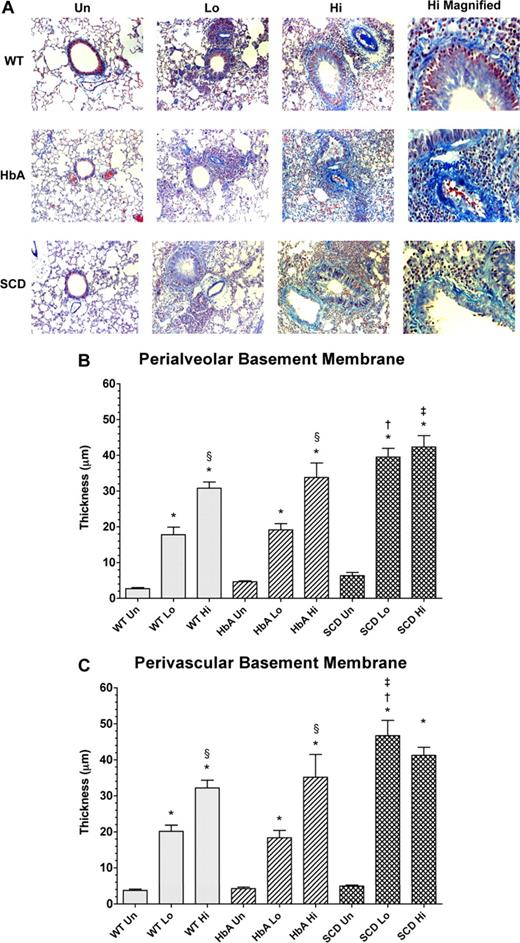
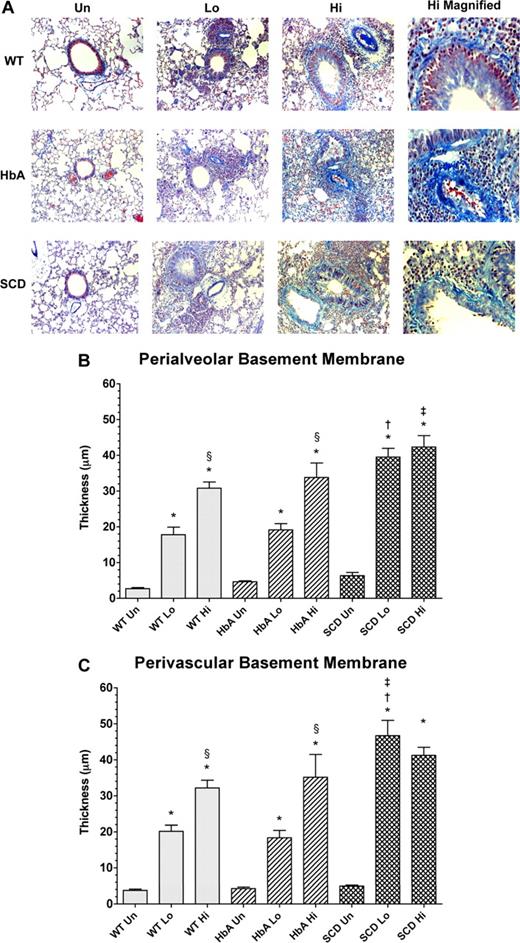
Morphometric analysis revealed significant and dose-dependent increases in the amount of collagen deposited in the peribronchial and perivascular regions in the lungs of OVA-sensitized mice (Figure 6A). Analysis of peribronchial and perivascular thickening revealed that OVA sensitization induced a significant dose-dependent increase in thickening in WT and HbA mice (Figure 6B,C). As with eosinophil counts, the HiSen protocol induced maximal increases in basement membrane thickening in all 3 groups compared with UnSen groups (P < .05). In contrast, peribronchial and perivascular thickening in SCD-Lo mice was already increased to the same level as SCD-Hi mice, presumably a maximal inflammatory response (Figure 6B,C). These data demonstrate that the inflammatory response of collagen deposition in SCD mice is accentuated compared with other sensitized groups.
Collagen deposition in lungs from unsensitized and sensitized WT, HbA, and SCD mice. (A) This figure shows images of McLetchie trichrome staining of lungs from UnSen, LoSen, and HiSen WT, HbA, and SCD mice. First row: Images of lung sections from UnSen (Un), LoSen (Lo), and HiSen (Hi) WT mice. Second row: Images of lung sections from UnSen (Un), LoSen (Lo), and HiSen (Hi) HbA mice. Third row: Images of lung sections from UnSen (Un), LoSen (Lo), and HiSen (Hi) SCD mice. Basement membrane thickening in the (B) peribronchial and (C) perivascular regions of the lungs from UnSen, LoSen, and HiSen WT, HbA, and SCD mice. Statistical analysis: * indicates significantly different from UnSen group within same strain; §, significantly different from LoSen (Lo) group within same strain; †, significantly different from wild-type (WT) group with same treatment; and ‡, significantly different from the HbA groups with same treatment. (P < .05, adjusted for the number of comparisons.)
Collagen deposition in lungs from unsensitized and sensitized WT, HbA, and SCD mice. (A) This figure shows images of McLetchie trichrome staining of lungs from UnSen, LoSen, and HiSen WT, HbA, and SCD mice. First row: Images of lung sections from UnSen (Un), LoSen (Lo), and HiSen (Hi) WT mice. Second row: Images of lung sections from UnSen (Un), LoSen (Lo), and HiSen (Hi) HbA mice. Third row: Images of lung sections from UnSen (Un), LoSen (Lo), and HiSen (Hi) SCD mice. Basement membrane thickening in the (B) peribronchial and (C) perivascular regions of the lungs from UnSen, LoSen, and HiSen WT, HbA, and SCD mice. Statistical analysis: * indicates significantly different from UnSen group within same strain; §, significantly different from LoSen (Lo) group within same strain; †, significantly different from wild-type (WT) group with same treatment; and ‡, significantly different from the HbA groups with same treatment. (P < .05, adjusted for the number of comparisons.)
Immunofluorescence of TGFβ and fsp-1
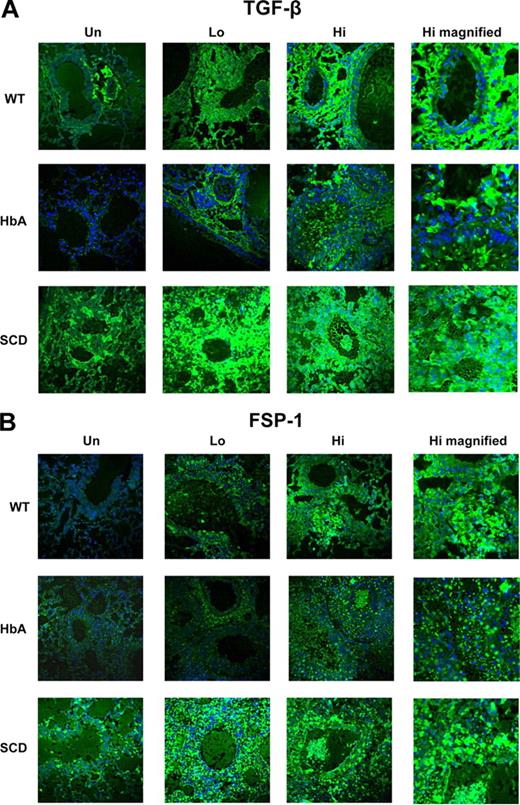
TGFβ expression is commonly increased in asthma.26 OVA sensitization markedly increased TGFβ expression in the lungs of WT, HbA, and SCD mice compared with UnSen mice (Figure 7A). Interestingly, TGFβ expression in untreated animals was increased in SCD compared with UnSen WT and HbA mice. With the exception of the higher baseline levels of expression in UnSen SCD mice, these data are consistent with the increase in collagen deposition (Figure 6).
TGFβ and fsp-1 expression in lungs from UnSen and Sen WT, HbA, and SCD mice. This figure shows images of (A) immunofluorescence of TGFβ1 and (B) immunofluorescence of fsp-1 in lungs of UnSen, LoSen, and HiSen WT, HbA, and SCD mice. First row: Images of lung sections from UnSen (Un), LoSen (Lo), and HiSen (Hi) WT mice. Second row: Images of lung sections from UnSen (Un), LoSen (Lo), and HiSen (Hi) HbA mice. Third row: Images of lung sections from UnSen (Un), LoSen (Lo), and HiSen (Hi) SCD mice. Magnification: 40× for all frames except high magnified (100×).
TGFβ and fsp-1 expression in lungs from UnSen and Sen WT, HbA, and SCD mice. This figure shows images of (A) immunofluorescence of TGFβ1 and (B) immunofluorescence of fsp-1 in lungs of UnSen, LoSen, and HiSen WT, HbA, and SCD mice. First row: Images of lung sections from UnSen (Un), LoSen (Lo), and HiSen (Hi) WT mice. Second row: Images of lung sections from UnSen (Un), LoSen (Lo), and HiSen (Hi) HbA mice. Third row: Images of lung sections from UnSen (Un), LoSen (Lo), and HiSen (Hi) SCD mice. Magnification: 40× for all frames except high magnified (100×).
Fibroblast specific protein-1 (fsp-1) is expressed on fibroblasts and on cells transitioning into fibroblasts.27 The overall pattern of fsp-1 expression in all groups of mice appears similar to the pattern of TGFβ expression (Figure 7). At baseline, SCD-Un mice express higher levels of fsp-1 than HbA-Un and WT-Un mice. OVA sensitization increased fsp-1 expression in all groups, with a slightly greater level of expression in HbA mice and an exaggerated level of expression in SCD mice. These data suggest that fsp-1 expression in OVA-sensitized mice is increased in SCD mice to a greater extent than in controls.
Discussion
We developed a novel model of experimentally induced asthma in Berkeley SCD mice.18 Our findings show that experimentally induced asthma increases mortality of SCD mice and that SCD mice exhibit exaggerated responses to allergen-induced lung inflammation. This conclusion is based on our observations that, in general, OVA sensitization increases recruitment of eosinophils, thickening of airways and vessels, and collagen deposition to high levels in SCD mice after either LoSen or HiSen OVA sensitization, whereas controls generally exhibited moderate inflammation when exposed to the LoSen protocol, but could reach maximal levels of inflammation when exposed to the HiSen protocol. Consistent with these findings, TGFβ and fsp-1 expression in SCD mice were also increased to higher levels in SCD mice at both baseline and after exposure to LoSen protocol compared with controls. Maximal inflammatory responses in WT and HbA mice were achieved only when these controls were exposed to the HiSen protocol.
Several models of experimentally induced asthma have been developed to study mechanisms of pulmonary inflammation and fibrosis. Agents used for sensitization range from allergens, to fungi, to nematodes, to viruses. One of the most common methods for increasing bronchopulmonary inflammation is sensitizing with a specific antigen and a Th-2 skewing adjuvant, such as aluminium hydroxide (alum). Typically, OVA is adsorbed onto alum and then injected either subcutaneously or intraperitoneally, followed by OVA intranasally or via aerosolization. To induce experimental asthma in SCD mice, we modified an OVA model that was previously optimized for C57BL/6 mice.17 Our model is similar to others, in that it develops asthmalike histopathology and inflammation with eosinophil infiltration that is similar to that which develops in humans. For example, peripheral blood eosinophil counts (as percentage of total WBCs) in the OVA-sensitized mice increased in direct relation to quantitative measures of histopathologic eosinophil infiltration within the lungs (r = 0.9229; Figures S1,S2). However, our model differs from others, in that pulmonary inflammation develops early, typically within less than one month, even without multiple intraperitoneal or subcutaneous antigen injections. Another way this model differs from others is that systemic sensitization was induced by subcutaneous implantation of denatured OVA.
Based on observations in humans,13,14 we hypothesized that asthma would be a comorbid condition that would increase susceptibility to death in an established murine model of SCD. Our survival data are consistent with this hypothesis. For example, approximately 40% of SCD-Hi mice died (∼ 10% after OVA implantation; ∼ 30% after OVA aerosolization), whereas the HiSen protocol had little to no effect on survivability of HbA or WT mice. Indeed, one of our concerns in establishing this model in SCD mice was increased mortality, potentially limiting end point data. Fortunately, lowering OVA exposure from 30 minutes to 15 minutes reduced mortality rates to levels that were statistically indistinguishable from controls, yet provides sufficient numbers with which to assess changes in pulmonary inflammation. Although we do not have definitive data on the cause of death in SCD mice, we speculate that the marked increase in airway inflammation induced by the HiSen protocol combined with an existing increased baseline in systemic chronic inflammation that is typically observed in human and murine SCD likely contributed to the higher mortality rates in the SCD mice.
Similarly, our hypothesis that SCD mice would have greater inflammatory responses to OVA sensitization than healthy controls is clearly supported by our findings. Our data suggest that the LoSen protocol induces maximal inflammatory responses in SCD mice because further increases in histopathologic indices were not achieved in SCD mice exposed to the HiSen protocol. In agreement, the HiSen protocol induced “maximal” increases in eosinophil recruitment, thickening of airways and vessels, or collagen deposition that were similar in all 3 groups. However, the increased death rate observed in HiSen versus LoSen SCD mice (30% vs 10% deaths, respectively) suggests that prolonged OVA exposure induces additional detrimental physiologic changes that go beyond our current histologic measures of lung inflammation. Pulmonary function testing and measures of oxygen delivery to tissues in vivo would help to further clarify the physiologic impact of OVA-induced sensitization in this murine model of SCD.
It is interesting that the perialveolar and perivascular eosinophil scores for HbA-Hi and SCD-Hi mice were similar, but the mortality rates were different (although the total IgE was higher in SCD-Hi mice compared with the other groups). We theorize that this result occurred because maximal levels of sensitization were achieved when mice were exposed to the HiSen protocol. SCD mice, however, have additional complications resulting from chronic organ damage and ongoing sickling of red cells that are evident at baseline. Such complications may have contributed to higher mortality rates for SCD mice in the same way as is observed for humans with SCD.15 As the cause of death in our mice was not determined, it is difficult to say why SCD-Hi mice died more frequently. However, because most of the mice that died were SCD mice, it seems logical to conclude that sickle hemoglobin–induced RBC and vascular pathologies contributed significantly to the cause of death. Furthermore, these data are similar to those obtained by Holtzclaw et al, who found that sublethal LPS caused death in 60% of SCD mice compared with less than 5% in control mice.11 Thus, SCD mice may be predisposed to exaggerated inflammatory responses regardless of the source, including pulmonary allergens. This conclusion is based in part on observations that the LoSen protocol induced inflammatory responses in SCD mice that were essentially equivalent to the maximal responses induced in SCD mice exposed to the HiSen protocol. In contrast, the LoSen protocol induced inflammatory responses in the WT and HbA mice that were approximately half of that induced by the HiSen protocol. Thus, our findings demonstrate that SCD mice are “primed” for exaggerated inflammatory responses.
In many respects, findings here parallel those in humans with SCD. First, the Berkeley SCD mice are fragile animals that are susceptible to red cell congestion, exaggerated oxidative lung injury,28 and increased chronic inflammation10 as are individuals with SCD.29-35 Second, SCD mice with comorbid experimentally induced “asthma” have increased rates of mortality compared with SCD mice without asthma. These results are similar to the increased death rates among individuals with SCD and asthma compared with SCD individuals without asthma.15 Exactly what makes humans with SCD and asthmalike symptoms more susceptible to death, painful vaso-occlusive events, and acute chest syndrome is unknown. However, it is well recognized that SCD increases vascular inflammation and injury.30-35 Accordingly, pulmonary vascular beds in humans with SCD may also be predisposed to an exaggerated inflammatory response in the clinical setting of comorbid asthma. Such changes begin to explain the increased incidence of acute chest syndrome, acute painful vaso-occlusive events, and premature death observed in individuals with both SCD and asthma. Regardless of how this proinflammatory state begins and evolves, our findings demonstrate that SCD mice are “primed” for exaggerated responses to OVA sensitization.
The role of eosinophils in asthma is controversial, in that they have the ability to both repair and injure pulmonary tissue.26 Eosinophils express TGFβ in the latent state that can be activated by αvβ6 integrin on epithelial cells36 as well as by mast cell tryptase.37 Interestingly, genetic deletion of catalase increases oxidative stress, TGFβ and fsp-1 expression, and fibrosis.38 TGFβ, after activation, is well recognized for increasing fsp-1 expression, accelerating the transition of epithelial cells into mesenchymal cells, and increasing fibrosis.39 It should be noted that extracellular oxidant stress also activates TGFβ, which, in turn, increases pulmonary fibrosis.40 On the basis of these reports, chronic states of oxidative stress and inflammation in SCD mice may play an important role in increasing TGFβ expression and activation in SCD-Un mice. Our data suggest that OVA sensitization exaggerates inflammatory and fibrotic responses in SCD mice compared with WT and HbA mice. As increased pulmonary fibrosis and inflammation correlate with impaired lung function, such differences may explain why sickle cell predisposes SCD mice to increased morbidity and mortality.
To our knowledge, this is the first model of experimentally induced asthma in a murine model of severe SCD. As such, these mice provide unique opportunities to study the mechanism driving airway disease in SCD as well as to dissect the role of inflammation in sickle hemoglobin–induced pulmonary and systemic organ pathologies. With this murine model of experimental asthma and SCD, we can begin to explore new mechanisms by which different inflammatory cells and pathways participate in the asthmatic inflammatory process. For example, blood from these mice could be analyzed to determine whether and the extent to which eosinophils, neutrophils, and/or monocytes/macrophages are activated. A full complement of cytokines could be quantified to follow the time course of the inflammatory response to OVA sensitization. The experimentally induced asthma SCD mouse could also be used to test clinically relevant therapies (such as supplemental oxygen and bronchodilators) and specific anti-inflammatory therapies to identify the most effective means of attenuating inflammation in the SCD lung. Finally, the OVA-sensitized SCD mice could be helpful in delineating fundamental mechanisms to explain why children with SCD and asthma are more susceptible to systemic and pulmonary vaso-occlusive events and are at increased risk for premature death.13,14
The online version of this article contains a data supplement.
The publication costs of this article were defrayed in part by page charge payment. Therefore, and solely to indicate this fact, this article is hereby marked “advertisement” in accordance with 18 USC section 1734.
Acknowledgments
The authors acknowledge Deron W. Jones, Sandra L. Holzhauer, Thomas D. Foster, and Dawn Retherford for technical assistance and expertise with working with the murine model of sickle cell disease. The authors also thank Lynn Gruman, program coordinator in the Department of Pathology, Medical College of Wisconsin, for assistance with histology, and Meghann Sytsma for assistance with the paper preparation.
This research was supported by grants HL079937 (M.R.D.), P01-HL44612 (C.A.H.), and HL081588 (K.A.P.) from the National Institutes of Health (Bethesda, MD).
National Institutes of Health
Authorship
Contribution: S.D.N. performed the research and contributed to writing the paper; T.R.F. analyzed data and contributed to writing the paper; W.H. assisted S.D.N. with performing the research; D.W. performed immunostaining and image analysis; K.S.K. designed the ovalbumin sensitization animal model of asthma; J.W. assisted in performing the research; R.C.S. and M.R.D. formulated the pathophysiological concepts on which the research was based; and C.A.H. and K.A.P. designed the experiment and wrote the paper.
Conflict-of-interest disclosure: The authors declare no competing financial interests.
Correspondence: Kirkwood A. Pritchard, Medical College of Wisconsin, Children's Research Institute, 8701 Watertown Plank Road, Milwaukee, WI 53226; e-mail: kpritch@mcw.edu.
References
Author notes
*C.A.H. and K.A.P. contributed equally to this work and are senior authors.

