Abstract
The bone marrow plays a unique role within the immune system. We compared the phenotype and function of virus-specific CD8+ T cells from matched samples of human peripheral blood and bone marrow. Analysis of virus-specific memory CD8+ T cells showed widely divergent partition of antigen-specific populations between blood and bone marrow. T cells specific for Epstein-Barr virus (EBV) lytic antigens were enriched 3-fold in marrow compared with blood, whereas the response to EBV latent epitopes was equivalent between the 2 compartments. No difference in EBV viral load or expression of the EBV lytic protein was observed between blood and bone marrow. In direct contrast, although cytomegalo-virus (CMV)–specific T cells were the largest virus-specific population within peripheral blood, they were reduced by 60% within marrow. Bone marrow T cells were found to exhibit a unique CCR5+CXCR6+CXCR3− homing phenotype which has not been observed on T cells from other secondary lymphoid organs or peripheral organs. Expression of CCR5 and CXCR6 was higher on EBV-specific T cells within peripheral blood compared with CMV-specific populations. These observations identify a novel bone marrow homing phenotype for CD8+ memory T cells, which necessitates a reevaluation of the magnitude of antigen-specific populations within the lymphoid system.
Introduction
Bone marrow (BM) is the primary organ of hematopoiesis in the adult human and generates precursor cells of the innate and adoptive immune responses. However, the important role of BM in functional immunity has been investigated only recently. Naive T cells can be activated in the BM, confirming its capacity to act as a secondary lymphoid organ.1 In addition, the preferential homing of memory T cells to the BM after adoptive transfer2 and the presence of virus-specific T cells in the BM in both animal models3,4 and humans5 suggests that it may serve as a reservoir for memory T cells. The potential utility of marrow-derived T cells for immune manipulation has been indicated by clinical studies showing that CD8+ T cells from the BM induce greater cytotoxic T lymphocyte (CTL) activity against tumors6,7 than those isolated from peripheral blood. These findings indicate that T cells from marrow may be endowed with a unique functional capacity and have highlighted the potential importance of BM-derived cells for immunotherapy.
Despite this, details of the phenotype, virus specificity, and functional capacity of human CD8+ T cells within marrow remain largely unknown. Compared with blood, there is a relative accumulation of CD8+ T cells over that of CD4+ cells such that the CD4+/CD8+ ratio is reduced in marrow. In addition, a large proportion of αβ+ T cells belong to the natural killer T (NKT) cell and regulatory lineages.8 Virus-specific T cells have been detected in BM, but it is unclear if all memory T cells are enriched in marrow or whether there is selective recruitment of antigen-specific populations.4,9 Central memory T cells show preferential homing to murine marrow after adoptive transfer, suggesting preferential enrichment based on T-cell differentiation state.10 This altered ratio between central and effector memory T cells in the BM was dependent, however, on environmental exposure to antigen and may thus not be translatable to humans.
One important aspect that will influence the composition of the lymphoid repertoire in BM is the unique vascular anatomy of this organ. T cells enter BM from blood by crossing flat-endothelium–lined vessels,8 but their exit mechanism is unclear because no lymphatics drain the marrow space. The molecular signals that govern the entry of human T cells into BM is also not fully understood and the contribution of BM to the lymphocyte recirculation paradigm that has been defined for secondary lymphoid tissues, as well as gut and skin, is uncertain.8 α4β1–VCAM-1 interactions play a crucial role in T-cell homing to the BM in mice,10,11 and VCAM-1 is expressed constitutively by both BM microvasculature and stromal cells.8 Blockade of VCAM-1 or α4 abrogates the entry of T cells into the BM.10 Some studies have also suggested a role for CXCR4-CXCL12 (SDF-1) interactions in recruitment of T cells, and CXCL-12 is produced in abundance by BM stromal cells.12 Interestingly, recent murine studies have also suggested a role for CD62L and CCR7 in T-cell recruitment to marrow. Because both of these molecules are required by naive and central memory T cells for entry into lymphoid organs,10 these data suggest that BM may more closely resemble a lymphoid rather than peripheral tissue for lymphoid homing.
In light of these findings, we decided to use paired peripheral blood and BM samples from human donors to define the homing phenotype and antigenic specificity of CD8+ T cells within human BM. We demonstrate that BM has the capacity to selectively accumulate different virus-specific CD8+ T-cell memory populations while excluding others. We also show that CD8+ T cells in the BM have a unique homing phenotype that is different from that of those seen in secondary lymphoid organs, gut, skin, or inflamed tissues and which dictates the migratory capacity of the cells in response to chemokines.
Methods
Sample collection and preparation
Paired blood and BM samples were collected from consented patients who gave at Heartlands hospital in Birmingham, United Kingdom. The BM was taken from rib samples collected during thoracotomies, where a small piece of rib is removed as a normal part of the procedure. Around 80% of the patients recruited to this study had primary lung tumor, while the others had either a secondary malignancy with lung involvement or benign pathology. Although it should be noted that these patients were not 100% healthy, the BM used in this study was not involved in the patients' diseases. The BM was flushed from the rib with RPMI, and lymphocytes were extracted by ficoll separation as shown previously.13 Cells were either used fresh or were cryopreserved in liquid nitrogen for later work. The study had local research ethical approval from the East Birmingham Local Research Ethics Committee, and all patients gave written informed consent in accordance with the Declaration of Helsinki.
Flow cytometric analysis of samples
All relevant class I tetramers were made in our laboratory, where the appropriate class I heavy chain molecule was refolded with β2 microglobulin and the peptide and complexed with streptavidin-phycoerythrin as previously described.14 The viral epitopes are identified in the text by the first 3 letters of the peptide sequence. The cytomegalovirus (CMV) epitopes used in this study were: the HLA-A*0201–restricted peptides NLVPMVATV, derived from pp65 (UL83) protein and VLEETSVML, derived from IE-1 (UL122) protein; the HLA-B*0801–restricted peptides QIKVRVDMV, ELRRKMMYM, and ELKRKMIYM, all derived from IE-1 protein; and the HLA-B*0702–restricted peptides TPRVTGGGAM and RPHERNGFTVL, derived from pp65 protein. The Epstein-Barr virus (EBV) epitopes used in this study were: HLA-A*0201–restricted GLCTLVAML derived from EBV lytic antigen BMLF-1 and CLGGLLTMV derived from EBV latent membrane protein LMP2; HLA-B*0801–restricted peptides RAKFKQLL derived from lytic antigen BZLF-1 and FLRGRAYGL derived from latent cycle nuclear protein; HLA-B*3501–restricted peptides EPLPQGQLTAY derived from lytic antigen BZLF-1; and HPVGEADYFEY derived from latent nuclear protein EBNA1. The Influenza A epitopes used in this study were: HLA-A*0201–restricted peptide GILGFVFTL derived from matrix protein and HLA-B*0801–restricted peptide ELRSRYWAI derived from nucleoprotein. In all cases the tetramer-stained cells were subsequently stained with anti-CD8 antibodies conjugated to tricolor (Invitrogen, Carlsbad, CA), phycoerythrin (PE; DAKO, Ely, United Kingdom), or Pacific Blue (BD Biosciences, Oxford, United Kingdom).
The phenotypic analysis involved using these reagents with another third marker. These included FITC-labeled CD45RO (BD Pharmingen, Oxford, United Kingdom), PC5-labeled (BD Pharmingen) or Alexa Fluor 700–labeled (BioLegend/Cambridge Bioscience, Cambridge, United Kingdom) CD45RA, FITC-labeled CCR7 (R&D Systems, Abingdon, United Kingdom), ECD-labeled CD28 (Beckman Coulter, High Wycombe, United Kingdom), APC–Alexa Fluor 750–labeled CD27 (Biolegend), PC7-labeled CCR5 (BD Pharmingen), PE-labeled CXCR6 (R&D Systems), unconjugated antibodies CXCR3 (BD Pharmingen), CXCR4 (R&D Systems), CXCR6 (R&D Systems), CCR4 (BD Pharmingen), CCR5 (BD Pharmingen), CCR7 (BD Pharmingen), CCR9 (R&D Systems), CD62L (BD Pharmingen), and LFA-1 (BD Pharmingen). The secondary reagents used in this study include FITC-labeled goat anti–mouse (Sigma, Dorset, United Kingdom) and goat anti–rat (Sigma). Mouse and rat sera (both from DAKO) were used to block nonspecific binding. In all cases, cells were stained with appropriate isotype control antibodies as negative controls. An Epics Flow Cytometer (Beckman Coulter) was used for up to 3-color immunofluorescence analysis and a Becton Dickinson LSR II was used for more than 3-color analysis. Analyses of the data were performed using either WinMDI version 2.8 software (The Scripps Research Institute, La Jolla, CA) or FlowJo software version 7/8 (TreeStar, Ashland, OR) was used for analysis.
Intracellular cytokine staining
Antigen-specific IFNγ-producing cells were detected by stimulating up to 5 × 10⁶ fresh paired peripheral blood and BM mononuclear cells with 2 to 4 μg/mL of appropriate class I MHC restricted viral peptide for 6 hours at 37°C. Brefeldin A was added after the first 2 hours. Intracellular IFN-γ levels were measured as described previously. Briefly, the cells were surface stained with FITC-conjugated anti-CD8 monoclonal antibody (mAb). After washing, cells were fixed and permeabilized using reagents from the Intraprep Permeabilization Reagent Kit (Beckman Coulter). Cells were then stained with PE-conjugated anti-IFNγ mAb, and the expression levels were examined by flow cytometry.
Migration assay
T-cell migration was performed in micro-transwells of 3 μm membrane pore size. A 2-mL aliquot of cell suspension at 5 × 10⁵ cells/mL were added to transwell inserts (Greiner Bio-One, Stonehouse, United Kingdom). The inserts were held in a 6-well plate containing 100 ng/mL of chemokine in RPMI media and incubated for 6 hours at 37°C with 5% CO2. Migration of cells through the insert membrane onto the lower culture plate was quantitated by flow cytometry. The assay was performed in duplicates and repeated at least twice.
Virus genome load analysis
Quantitative polymerase chain reaction (PCR) analysis was performed to estimate the EBV viral genome levels as described previously.15 DNA for genome quantitation was extracted from 106 mononuclear cells derived from single-cell preparations of either BM or peripheral blood mononuclear cells (PBMCs) using a DNeasy tissue kit (Qiagen, Crawley, United Kingdom).
Statistical analysis
Statistical analyses were conducted using GraphPad Prism version 4.00 for Windows (GraphPad Software, San Diego, CA). A Wilcoxon signed rank test was used to derive P values for comparing data between paired blood and BM samples. P values less than .05 were considered significant.
Results
Effector memory CD8+ T cells are increased in human BM compared with peripheral blood
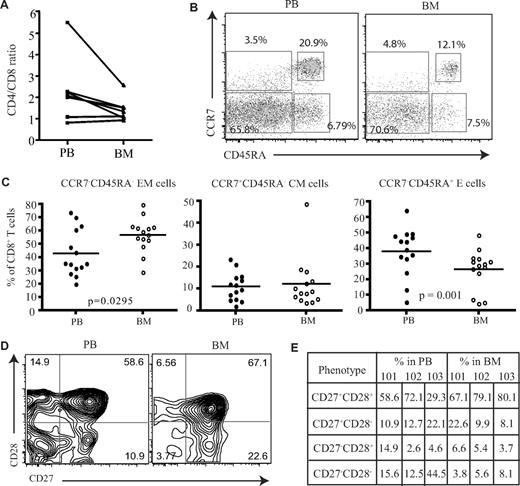
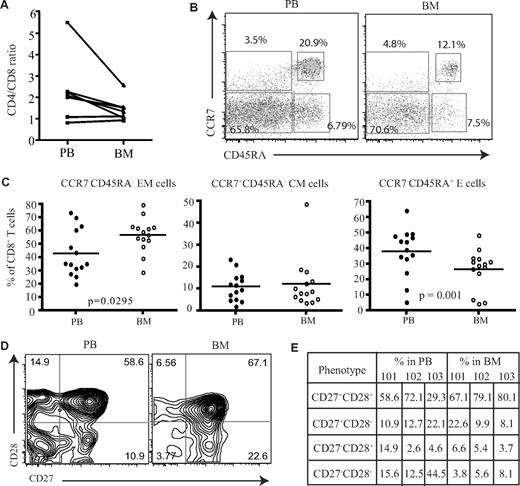
Initially, the proportion of CD4 and CD8 T cells was compared in paired samples from peripheral blood and BM. As previously reported, increased numbers of CD8+ T cells were observed in marrow compared with the blood, and the CD4/CD8 ratio was reduced, although not significantly, from an average of 2.3 in blood to 1.5 within marrow (Figure 1A). To investigate if human BM serves as a reservoir for memory T cells, we then used CCR7 and CD45RA expression to identify naive and subsets of memory CD8+ T cells. Naive cells are CCR7+CD45RA+, and memory CD8+ T cells can be classified into central memory (CCR7+CD45RA−) and effector memory (CCR7−CD45RA−) populations based on differential expression of CD45RA and CCR7 (Figure 1B).16 The proportion of CD45RA−CCR7− effector memory CD8+ T cells was increased by 1.3-fold within the BM compared with blood (Figure 1C) and represented a mean of 57% of the memory pool (P = .029). No significant differences were observed in the proportion of central memory cells. The expression of CD45RA+ on CCR7− cells identifies a third memory population of “revertant” memory CD8+ cells, which are believed to represent cells that have not recently undergone activation with cognate antigen. This population was reduced in the BM of almost all donors (P = .002; Figure 1C). An alternative way to identify memory cells is to stain for CD45RA and LFA-1.17 Naive cells are CD45RA+ and LFA-1low, while effector and memory cells become LFA-1high. Memory T cells represented 79% of the CD8+ T-cell pool within marrow and were thus 3- to 4-fold higher than the naive population (Figure S1C, available on the Blood website; see the Supplemental Materials link at the top of the online article). However, compared with peripheral blood the proportion of effector-memory cells had a small but significant reduction within the human BM (Figure S1). We then examined the differentiation status of CD8+ T cells within the human BM compared with their blood counterparts. As CD8+ T cells differentiate they lose the expression of costimulatory molecules CD27 and CD28,18 whereby less differentiated cells start off as CD27+CD28+ and highly differentiated cells become CD27−CD28−.18 When we compared the expression of these molecules on effector memory cells (Figure 1D), contrary to what has been observed in the lung,19 a higher proportion of less differentiated cells (CD27+CD28+) were present within the human BM compared with the blood (Figure 1E). This was also extended to virus-specific CD8+ T cells; similar results were obtained (data not shown).
Proportion of memory CD8+ T cells in the BM. (A) Ratio of CD4+ T cells and CD8+ T cells in paired blood and BM samples (n = 7). (B) Flow cytometric profiles showing the gating of memory CD8+ T cells. After gating on CD8+ T cells, the dual expression of CD45RA and CCR7 was used to identify memory T-cell subsets. CD8+ T cells that were CCR7+CD45RA+ were considered naive T cells, CCR7+CD45RA− were central memory cells, CCR7−CD45RA− were effector memory cells, and CCR7−CD45RA+ were effector memory cells with RA phenotype. Percentages represent proportion of each subset within CD8+ T-cell population. (C) Based on the expression of CD45RA and CCR7, the proportion of naive and memory CD8+ T cells were compared between paired blood and BM samples (n = 14). Line represents the median. (D) Dual expression of CD27 and CD28 were compared on effector memory CD8+ T cells from paired blood and BM samples. Percentages represent proportion of each subset within CD8+ T-cell population. (E) The differentiation status of effector memory CD8+ T cells from blood and BM were compared. Table shows the proportion of effector memory CD8+ T cells at various stages of differentiation in 3 paired blood and BM samples—HM101, HM102, and HM103.
Proportion of memory CD8+ T cells in the BM. (A) Ratio of CD4+ T cells and CD8+ T cells in paired blood and BM samples (n = 7). (B) Flow cytometric profiles showing the gating of memory CD8+ T cells. After gating on CD8+ T cells, the dual expression of CD45RA and CCR7 was used to identify memory T-cell subsets. CD8+ T cells that were CCR7+CD45RA+ were considered naive T cells, CCR7+CD45RA− were central memory cells, CCR7−CD45RA− were effector memory cells, and CCR7−CD45RA+ were effector memory cells with RA phenotype. Percentages represent proportion of each subset within CD8+ T-cell population. (C) Based on the expression of CD45RA and CCR7, the proportion of naive and memory CD8+ T cells were compared between paired blood and BM samples (n = 14). Line represents the median. (D) Dual expression of CD27 and CD28 were compared on effector memory CD8+ T cells from paired blood and BM samples. Percentages represent proportion of each subset within CD8+ T-cell population. (E) The differentiation status of effector memory CD8+ T cells from blood and BM were compared. Table shows the proportion of effector memory CD8+ T cells at various stages of differentiation in 3 paired blood and BM samples—HM101, HM102, and HM103.
Divergent partition of antigen-specific CD8+ T cells in human BM
We next decided to study the antigenic specificity of the CD8+ T-cell memory pool within BM. HLA-peptide tetramers containing immunodominant epitopes from 3 viruses were used to stain CD8+ cells in paired blood and marrow samples. CMV and EBV are herpes viruses that cause persistent infection and induce a strong T-cell immune response within the host. EBV infection of B cells leads to distinct lytic or latent transcriptional profiles, and virally encoded proteins can be assigned to one of other of these programs. In contrast, influenza virus is cleared from the host after infection and was used here as a model of the immune response to a nonpersistent antigen.
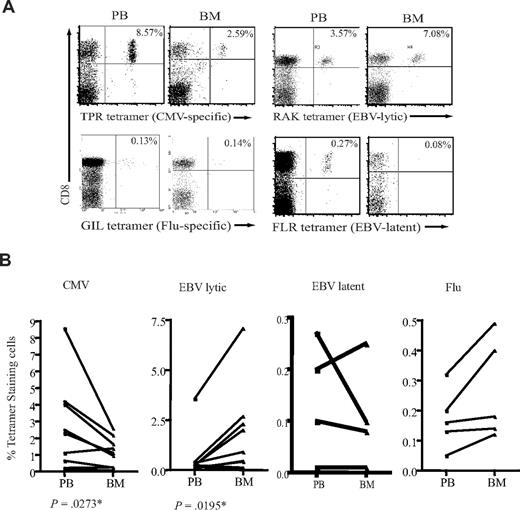
CD8+ T cells specific for all 3 viruses were detected within BM, but marked differences were seen in the relative frequency of different virus-specific populations in blood and BM (Figure 2A). The CD8+ T-cell response against peptides derived from proteins encoded in the lytic phase of EBV infection was shown to be at least 2- to 5-fold higher in the BM compared with peripheral blood (Figure 2B). The proportion of CD8+ T cells specific for EBV-latent antigens did not differ between the 2 compartments. In sharp contrast to the pattern observed for EBV-specific T cells, the proportion of CMV-specific CD8+ T cells was reduced by up to 60% in the BM compartment (Figure 2B). No significant difference was observed in the levels of influenza-specific CD8+ T cells between blood and BM (Figure 2B).
Different proportions of antigen-specific CD8+ T cells in the BM. (A) Examples of flow cytometric dual expression profiles showing tetramer-positive CD8+ T cells in paired blood and BM sample. The proportion of EBV lytic antigen–specific CD8+ T cells were analyzed by staining with HLA-B*0801 tetramer for RAKFKQLL peptide from BZLF-1 lytic protein. EBV-latent antigen-specific CD8+ T cells were stained by a HLA-B*0801 tetramer for FLRGRAYGL peptide of EBNA3A latent protein. The proportion of CMV-specific CD8+ T cells were analyzed by staining with a HLA-B*0702 tetramer for TPRVTGGGAM peptide of pp65 protein. The proportion of influenza-specific CD8+ T cells were analyzed by staining with a HLA-A*0201 tetramer for GILGFVFTL of matrix protein. Percentages represent proportion of each subset within CD8+ T-cell population. (B) The frequency of antigen-specific CD8+ T cells in paired blood and BM samples. Graphs show the proportion of CD8+ T cells specific for CMV, EBV lytic antigen, EBV latent antigen, and influenza. P values were obtained using a Wilcoxon signed rank test as described in “Statistical analysis.” *P ≤ .05.
Different proportions of antigen-specific CD8+ T cells in the BM. (A) Examples of flow cytometric dual expression profiles showing tetramer-positive CD8+ T cells in paired blood and BM sample. The proportion of EBV lytic antigen–specific CD8+ T cells were analyzed by staining with HLA-B*0801 tetramer for RAKFKQLL peptide from BZLF-1 lytic protein. EBV-latent antigen-specific CD8+ T cells were stained by a HLA-B*0801 tetramer for FLRGRAYGL peptide of EBNA3A latent protein. The proportion of CMV-specific CD8+ T cells were analyzed by staining with a HLA-B*0702 tetramer for TPRVTGGGAM peptide of pp65 protein. The proportion of influenza-specific CD8+ T cells were analyzed by staining with a HLA-A*0201 tetramer for GILGFVFTL of matrix protein. Percentages represent proportion of each subset within CD8+ T-cell population. (B) The frequency of antigen-specific CD8+ T cells in paired blood and BM samples. Graphs show the proportion of CD8+ T cells specific for CMV, EBV lytic antigen, EBV latent antigen, and influenza. P values were obtained using a Wilcoxon signed rank test as described in “Statistical analysis.” *P ≤ .05.
EBV-specific T cells in the BM produce more IFN-γ than their blood counterparts
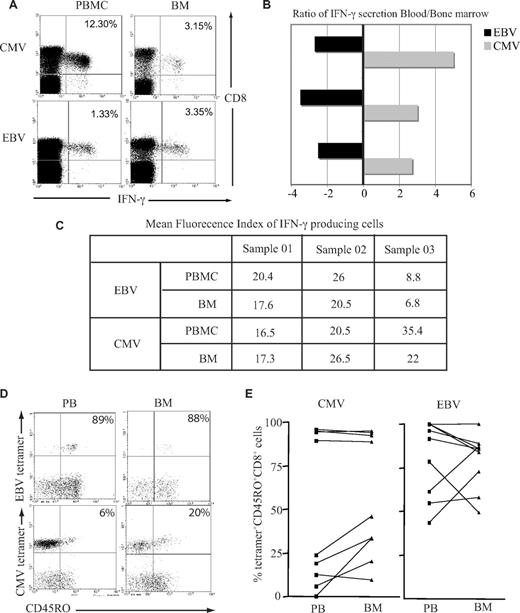
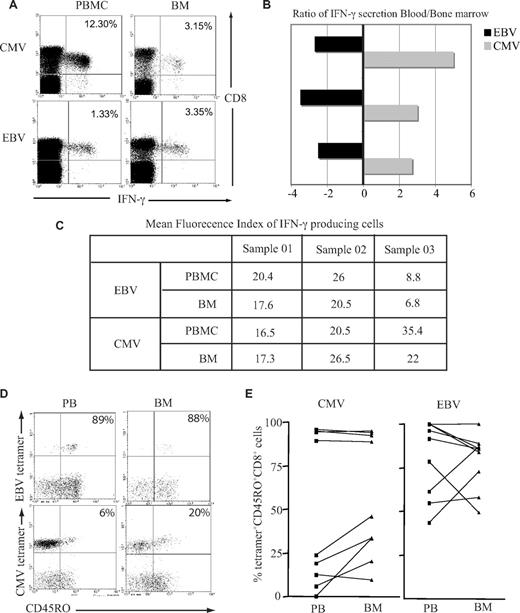
Previous data have demonstrated that T cells from murine BM are at a higher activation status than their counterparts within peripheral blood and respond more quickly to stimulation with antigen.20 We therefore examined immediate IFN-γ response after peptide stimulation in vitro by both EBV-specific and CMV-specific CD8+ T cells isolated from the BM or blood. A greater number of EBV-specific CD8+ T cells from the BM demonstrated a positive cytokine secretion response, whereas the opposite pattern was observed when CMV-specific CD8+ T cells were examined (Figure 3A,B). When we compared the mean fluorescence index of IFN-γ–producing cells, there was a small reduction in the BM for both EBV and CMV responses (Figure 3C), but there were no significant differences between the 2 virus-specific responses. It has been suggested that recently activated T cells gain preferential entry to marrow; this might be reflected in differential T-cell expression of CD45R isoforms, which indicate recent engagement with antigen.21 While EBV lytic antigen–specific CD8+ T cells were largely CD45RO+ in both compartments, a higher proportion of CMV-specific CD8+ T cells expressed the CD45RO isoform in the BM compared with blood (Figure 3C,D).
Functional capacity and activation status of virus-specific CD8+ T cells in the BM. (A) BM-derived EBV-specific CD8+ T cells but not CMV-specific CD8+ T cells have greater IFN-γ response compared with blood counterparts. Cells were stimulated with class I–restricted RAKFKQLL peptide for EBV response and QIKVRVDMV peptide for CMV response for 6 hours, followed by intracytoplasmic staining for IFN-γ. Example flow cytometry profiles show virus-specific response by CD8+ T cells. (B) Graph shows the ratio of IFN-γ response in the blood and BM in 3 different subjects. A negative value means there is more IFN-γ producing cells in the BM. (C) The table shows the mean fluorescence index of IFN-γ–producing cells. (D) A representative plot of CD45RO expression on tetramer-positive CD8+ T cells. After gating on CD8+ T cells, the dual expression of tetramer and CD45RO were analyzed. (E) Expression of CD45RO on CMV- and EBV-specific CD8+ T cells in paired blood and BM samples.
Functional capacity and activation status of virus-specific CD8+ T cells in the BM. (A) BM-derived EBV-specific CD8+ T cells but not CMV-specific CD8+ T cells have greater IFN-γ response compared with blood counterparts. Cells were stimulated with class I–restricted RAKFKQLL peptide for EBV response and QIKVRVDMV peptide for CMV response for 6 hours, followed by intracytoplasmic staining for IFN-γ. Example flow cytometry profiles show virus-specific response by CD8+ T cells. (B) Graph shows the ratio of IFN-γ response in the blood and BM in 3 different subjects. A negative value means there is more IFN-γ producing cells in the BM. (C) The table shows the mean fluorescence index of IFN-γ–producing cells. (D) A representative plot of CD45RO expression on tetramer-positive CD8+ T cells. After gating on CD8+ T cells, the dual expression of tetramer and CD45RO were analyzed. (E) Expression of CD45RO on CMV- and EBV-specific CD8+ T cells in paired blood and BM samples.
The selective enrichment of EBV-specific CD8+ T-cell numbers within BM is accompanied by a reduction in the EBV viral load at this site
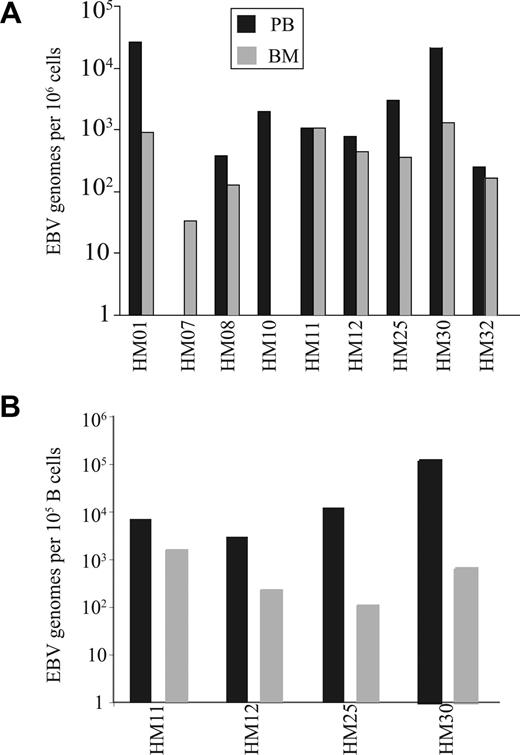
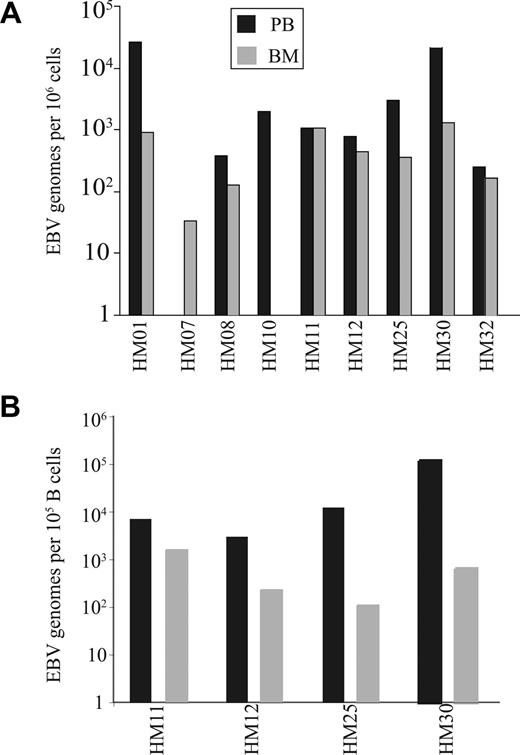
The increased number of CD8+ T cells specific for EBV lytic antigen within the BM may reflect a response to high EBV viral load within this compartment. EBV viral load was therefore determined in paired blood and BM samples from individual donors and demonstrated that EBV genome levels within marrow were generally comparable or lower than values in blood (Figure 4A). EBV is a B-cell tropic virus,22 and human BM contains approximately 15% to 20% B cells compared with 8% to 10% within peripheral blood.23 When EBV viral load was expressed in relation to absolute B-cell number the value was significantly reduced in the BM compared with blood (P < .01; Figure 4B). Because CD8+ T cells specific for EBV lytic epitopes are selectively increased within BM, we next ex-amined marrow samples for the expression of the EBV lytic antigen BZLF-1 using reverse transcription (RT)–PCR. However, no BZLF-1 expression was seen in any of the samples (data not shown).
EBV genome loads on paired blood and BM samples. (A) The EBV genome copies in 106 mononuclear cells from both blood and BM. (B) The EBV load in 100 000 B cells were estimated in paired blood and BM samples. The proportions of B cells were calculated by staining blood and BM samples with anti-CD19 antibody.
EBV genome loads on paired blood and BM samples. (A) The EBV genome copies in 106 mononuclear cells from both blood and BM. (B) The EBV load in 100 000 B cells were estimated in paired blood and BM samples. The proportions of B cells were calculated by staining blood and BM samples with anti-CD19 antibody.
BM CD8+ T cells posses a unique CXCR3−CCR5+CXCR6+ homing phenotype and show increased migration to CCL5 and CXCL16
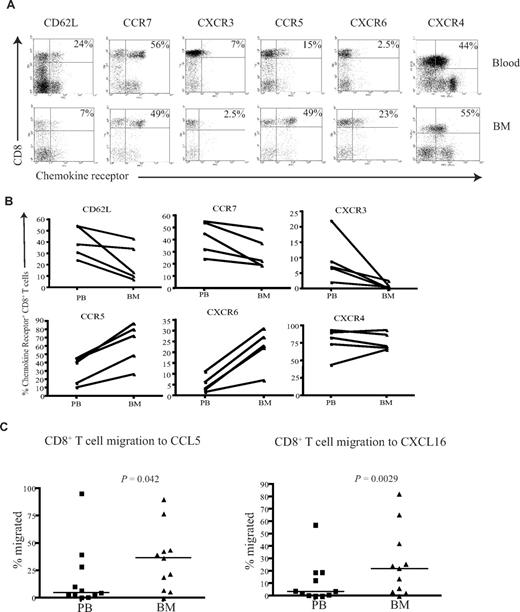
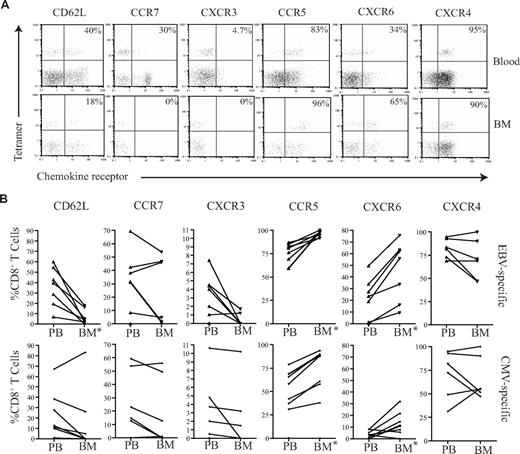
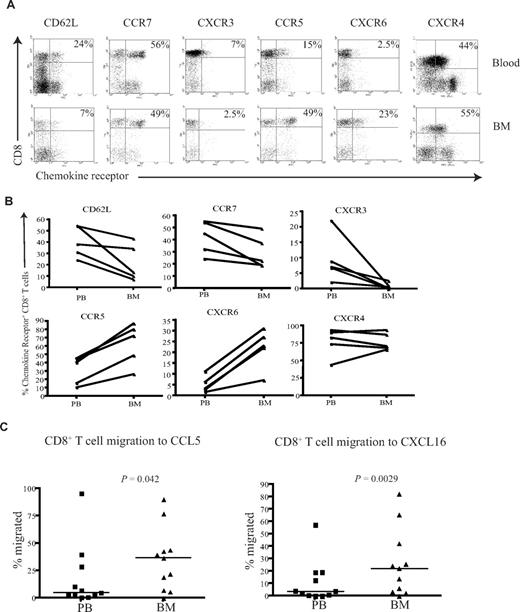
To understand the mechanisms that determine the differential accumulation of antigen-specific CD8+ T cells in human BM, we examined chemokine and adhesion receptor expression on CD8+ T cells within marrow compared with paired peripheral blood. CD62L and CCR7 are important for T-cell entry into secondary lymphoid organs, and the proportion of CD8+ T cells expressing these markers was reduced in BM compared with their blood counterparts (Figure 5A,B), a pattern in direct contrast to that reported for murine marrow.10
CD8+ T cells from the BM have a unique homing phenotype. (A) Example flow cytometry dual expression profiles showing the staining for CD62L, CCR7, CXCR3, CCR5, CXCR6, and CXCR4 on CD8+ T cells in paired blood and BM samples. Percentages represent proportion of tetramer+ CD8+ T cells expressing the chemokine receptor. (B) Frequency of CD8+ T cells expressing CD62L, CCR7, CXCR3, CCR5, CXCR6, and CXCR4 in paired blood and BM samples were analyzed in 5 different subjects. (C) In a transwell migration assay, the percentage of CD8+ T cells that migrated to CCL5 and CXCL16 were estimated. CD8+ T cells from paired blood and BM samples were added to wells, and the proportion of the CD8+ T cells that migrated to CCL5 and CXCL16 were then analyzed. Statistical values were obtained by Wilcoxon signed rank test. The y axes show percentage of CD8+ T cells that migrated in response to the chemokine.
CD8+ T cells from the BM have a unique homing phenotype. (A) Example flow cytometry dual expression profiles showing the staining for CD62L, CCR7, CXCR3, CCR5, CXCR6, and CXCR4 on CD8+ T cells in paired blood and BM samples. Percentages represent proportion of tetramer+ CD8+ T cells expressing the chemokine receptor. (B) Frequency of CD8+ T cells expressing CD62L, CCR7, CXCR3, CCR5, CXCR6, and CXCR4 in paired blood and BM samples were analyzed in 5 different subjects. (C) In a transwell migration assay, the percentage of CD8+ T cells that migrated to CCL5 and CXCL16 were estimated. CD8+ T cells from paired blood and BM samples were added to wells, and the proportion of the CD8+ T cells that migrated to CCL5 and CXCL16 were then analyzed. Statistical values were obtained by Wilcoxon signed rank test. The y axes show percentage of CD8+ T cells that migrated in response to the chemokine.
CXCR4 is the ligand for SDF-1 and has a dominant role in the homing and retention of hemopoietic progenitor cells in the marrow.24-26 CXCR4 expression was uniformly high on CD8+ T cells within marrow, but comparable levels were also seen on CD8+ T cells within blood (Figure 5A,B). CXCR3 is a chemokine receptor associated with entry of leucocytes into inflamed tissues,27,28 and the expression of CXCR3 on CD8+ T cells was markedly reduced within BM compared with blood. CCR5 and CXCR6 are often expressed in association with CXCR3; interestingly, these receptors were expressed at high levels on CD8+ T cells within marrow compared with blood (Figure 5A,B). Expression of the tissue homing markers cutaneous lymphocyte antigen (CLA) and chemokine receptor CCR4 that guide T cells to skin was reduced on CD8+ T cells within the BM (Figure S2). Similarly, the expression level of the chemokine receptor CCR9 that is involved in T-cell homing to gut was also reduced in the BM (Figure S2).
Because expression of CCR5 and CXCR6 was increased on BM-derived CD8+ T cells compared with peripheral blood, we further examined the efficiency of cell migration to their ligands. CCL5 and CXCL16 are the chemokine ligands for CCR5 and CXCR6, respectively, and were used to study the migration of CD8+ T cells in transwell migration assays. The migration of BM-derived CD8+ T cells to CCL5 and CXCL16 was 2- and 2.3-fold higher, respectively, than that seen from peripheral blood cells (Figure 5C). In contrast, there was no significant difference in the migration of cells to CXCL9, CXCL10, CXCL11, or the ligands for CXCR3 (data not shown).
EBV-specific and CMV-specific CD8+ T cells within human BM exhibit a differential pattern of chemokine receptor expression
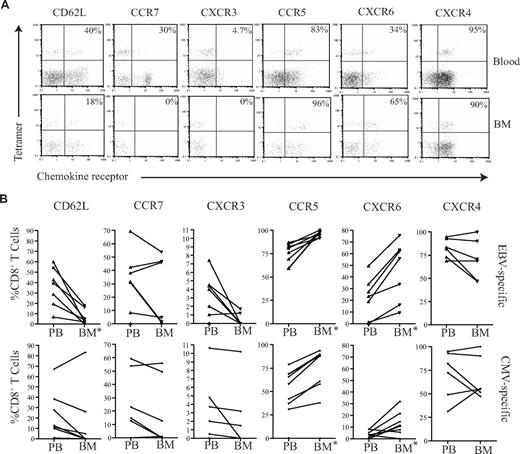
We then wished to determine whether there were any differences between the membrane phenotypes of EBV-specific and CMV-specific CD8+ T cells that might explain their differential recruitment to the marrow compartment. The expression level of CD62L and a range of chemokine receptors were determined on tetramer-positive T cells (Figure 6). CD62L and CCR7 expression was low on both CMV- and EBV-specific T cells in peripheral blood, but these were further reduced on BM derived CD8+ T cells (Figure 6). In accordance with the profile seen for the total CD8+ T-cell population, CMV- and EBV-specific T cells within marrow showed increased expression of CCR5 and CXCR6 compared with blood, while CXCR3 expression was reduced. However, comparison of the 2 antigen-specific populations revealed that EBV-specific T cells had more homogenous expression of the CCR5highCXCR6highCXCR3low marrow homing phenotype. CCR5 and CXCR6 expression was present on 96.2% (± 2.9%) and 45% (± 23.5%) of EBV-specific CD8+ T cells, respectively within marrow compared with 75.8% (± 19.2%) and 10.4% (± 9.8%) of CMV-specific populations. In contrast, CXCR3 was expressed on only 0.5% and 2.2% of EBV- and CMV-specific CD8+ T cells, respectively. The level of expression of CXCR4 remained high on all populations in both the blood and BM.
Chemokine profiles of virus-specific CD8+ T cells in paired blood and BM samples. (A) Example flow cytometry dual expression profiles showing the staining for CD62L, CCR7, CXCR3, CCR5, CXCR6, and CXCR4 in paired blood and BM samples on EBV-specific CD8+ T cells. After gating on CD8+ T cells, the expression of homing markers were identified in tetramer-positive T cells. The percentages shown refer to the percentage of tetramer-positive CD8+ T cells that express the relevant marker. (B) The summary of the frequency of antigen-specific CD8+ T cells expressing different homing markers. Graphs show the analysis of virus-specific CD8+ T cells from paired blood and BM samples for the expression of CD62L, CCR7, CXCR3, CCR5, CXCR6, and CXCR4 by flow cytometry. After gating on CD8+ T cells, the expression profiles of EBV- and CMV-specific CD8+ T cells were analyzed (n = 5-7). *Significant differences; P ≤ .05.
Chemokine profiles of virus-specific CD8+ T cells in paired blood and BM samples. (A) Example flow cytometry dual expression profiles showing the staining for CD62L, CCR7, CXCR3, CCR5, CXCR6, and CXCR4 in paired blood and BM samples on EBV-specific CD8+ T cells. After gating on CD8+ T cells, the expression of homing markers were identified in tetramer-positive T cells. The percentages shown refer to the percentage of tetramer-positive CD8+ T cells that express the relevant marker. (B) The summary of the frequency of antigen-specific CD8+ T cells expressing different homing markers. Graphs show the analysis of virus-specific CD8+ T cells from paired blood and BM samples for the expression of CD62L, CCR7, CXCR3, CCR5, CXCR6, and CXCR4 by flow cytometry. After gating on CD8+ T cells, the expression profiles of EBV- and CMV-specific CD8+ T cells were analyzed (n = 5-7). *Significant differences; P ≤ .05.
Discussion
The BM is well established as the primary organ of hematopoiesis. However, increasing attention is now being given to its role in immune function. The blood supply to marrow is unique and mediated through arterioles that flow into central sinusoids before draining through emissary veins.29 The endothelium of the sinusoids is highly permeable, and the oncotic pressure of marrow extracellular fluid is lower than that of plasma.30 The great majority of cells within marrow are situated in the BM interstitium, and the factors that regulate recruitment, retention, and exit of lymphoid cells to this compartment have been poorly studied to date.
Several studies have demonstrated that BM can act as a reservoir for memory T cells.3-5,8,9 We used CCR7 and CD45RA expression to identify different memory CD8+ T-cell populations within peripheral blood and BM. CD45RA−CCR7− effector memory cells were increased in marrow,31 and CD8+ central memory populations were comparable within both tissues. Murine studies have shown differential recruitment of memory populations depending on the history of antigen exposure.10 Interestingly, the increase in effector memory populations was accommodated by a relative reduction in the number of CD45RA+ “revertant” memory cells. Expression of CD45RA has been demonstrated to reflect lack of recent exposure to antigen, with such cells rapidly reverting to CD45RO expression after stimulation with cognate antigen. These data indicate that memory cells within marrow are enriched in populations that have undergone recent activation, which are findings that are consistent with murine models.20 The differentiation status, however, suggests that BM resident CD8+ T cells are less differentiated compared with their blood counterparts. This is in contrast to what has been reported in peripheral tissues, such as lungs, where tissue resident CD8+ T cells were more differentiated than their blood counterparts.19 The dynamics of the movement of memory T cells is interesting, and elegant mouse studies have shown that clonally expanded antigen-specific T cells selectively populate nonlymphoid organs over time.9,32
After characterization of the total CD8+ memory and naive pools within marrow and peripheral blood, we determined the relative distribution of antigen-specific populations. Individual viral infections have been shown to drive CD8+ T cells into different differentiation states,18 so we studied CD8+ T cells specific for the 3 viruses CMV, EBV, and influenza. CMV and EBV infection is associated with the development of large populations of virus-specific CD8+ T cells that can comprise more than 10% of the T-cell repertoire.22,33 The CD8+ T-cell immune response to influenza is much smaller, and HLA-peptide tetramers typically stain less than 0.2% of CD8+ T cells.34
Striking differences were observed in the relative distribution of virus-specific T cells between blood and BM. CD8+ T cells specific for peptides derived from proteins encoded during lytic replication of EBV were increased 2- to 5-fold in BM compared with blood. T cells directed toward peptides from proteins encoded during latent EBV infection did not show preferential accumulation. To determine the relationship between the magnitude of the CD8+ T-cell response and viral load we measured levels of EBV transcript using PCR and found that viral load was reduced in marrow when corrected for B-cell number.22 Similarly, there was no evidence of BZLF-1 lytic antigen expression in marrow. It is worth noting, however, that there may be limitations in detecting lytic activity in tissues. We have used RT-PCR followed by Southern blotting to detect BZLF-1 transcripts; as previously shown,35 the transcripts can be detected in as few as 10 lytic cells.
A very different profile was observed for the cellular response to CMV in the 2 compartments. The CD8+ T-cell response to CMV within peripheral blood is usually greater than the EBV-specific component; this pattern was observed in our study. However, up to 60% decrease in the magnitude of the CMV-specific T-cell response was observed in BM compared with blood. Influenza is a nonpersistent virus and thus acts as a good control for studying memory cell distribution in the absence of chronic viral infection. No difference was observed in the distribution of influenza-specific T cells between the 2 compartments.
Our data therefore indicate that the balance between EBV load and cellular immunity is modulated in the marrow compartment compared with blood. We have previously shown that both lytic and latent antigen-specific CD8+ T cells are enriched in the tonsils of healthy carriers compared with the blood.36 However, in this situation, the viral load in tonsil was higher compared with the blood and implies that cell recruitment was in response to antigen load. An opposite pattern was observed within BM, where EBV viral load is reduced compared with blood when normalized for B-cell number.
Relative to their blood-borne counterparts, BM-derived CD8+ T cells have decreased levels of CLA, CCR4, CCR6, CCR7, CCR9, CD62L, and CXCR3. CLA, CCR6, and CCR4 are associated with T-cell homing to the skin,37 and CCR9 is associated with T-cell homing to the gut.38 It is therefore perhaps not surprising that these markers were not expressed on T cells within marrow. CCR7 and CD62L are required by T cells for entry into lymphoid organs, and the expression profile we observed (CCR7−CD62L−) indicates that BM does not resemble a secondary lymphoid organ in the pattern of T-cell recruitment. Although CCR7 and CD62L have been suggested to play a role in T-cell trafficking to the BM in mice, direct comparison of these receptors between blood and BM has not been performed.10
BM-derived T cells show increased expression of CCR5, CXCR6, and CXCR4. CXCR3 and CCR5 are often classed together as proinflammatory chemokines27,28 and are often coexpressed on tissue resident T cells. However in the BM, this coordinate pattern of expression of CXCR3 and CCR5 on CD8+ T cells was lost; CXCR3 levels were reduced while CCR5 levels were increased (Figure 5). CXCR6 expression on cytotoxic T cells facilitates entry into sites of inflammation such as inflamed lung,39 liver,40 and rheumatoid joints.41 Furthermore, there have been several published studies suggesting increased levels of CTLs in the BM.20,42-44 Taken together, these functional data support the phenotype data of CD8+ T cells that we identified in the BM.
When we examined the phenotype of antigen-specific CD8+ T cells, differential pattern of chemokine expression was also observed (Figure 5). These observations indicate that CD8+ T cells within BM have a unique homing phenotype that is different from that seen on cells in secondary lymphoid tissue or in inflammatory tissues. This phenotype is characterized by increased expression of CCR5 and CXCR6 coupled with down-regulation of CXCR3, CD62L, and CCR7. EBV-specific CD8+ T cells within marrow exhibited homogeneous expression of this CCR5hiCXCR6hiCXCR3low phenotype, whereas CMV-specific CD8+ T cells had a more heterogeneous pattern. The phenotypic analyses were also supported by functional data showing that increased proportions of BM-derived CD8+ T cells migrated to CCL5 and CXCL16, but not to the ligands of CXCR3.
The factors that drive the divergent recruitment of different virus-specific T cells to marrow are unknown, but competition for physical space may be one factor. The space available within the BM is both limited and saturable, and it is intriguing that the proportion of CD8+ T cells specific for CMV or EBV was found to be comparable within the BM. CMV stimulates large numbers of virus-specific CD8+ T cells,13,33,45 and it is possible that mechanisms exist to limit cell numbers within the BM beyond a certain level. This hypothesis is supported by the observation that donors with particularly high levels of CMV-specific CD8+ T cells in the blood showed a greater difference in cell number between blood and BM. A further factor that must be considered is that CD34+ BM progenitor cells may act as reservoirs for CMV infection.46-48
Recent observations on the homing of plasma cells to marrow has indicated that recently activated plasma cells may displace resident cells due for competition for an environmental niche.49 The greater level of CD45RO expression on EBV-specific T cells indicates more recent activation, and EBV viral load is certainly present at higher levels than CMV in vivo. EBV-specific T cells might therefore displace CMV-specific T cells from BM over time. Evidence is now accumulating for differential accumulation of T cells in organs on the basis of antigenic specificity or phenotype. T cells from the lung show selective recruitment of T cells specific for respiratory viruses, whereas neither EBV- or CMV-specific CD8+ T cells were enriched.19 Similar studies from splenic tissue indicate that CD45RA+CCR7− revertant memory CD8+ T cells are relatively enriched compared with blood.50
Human BM comprises more than 2 kg of body weight; these data confirm the important and unique role of this substantial organ in T-cell immunity. Marrow is not a simple reservoir for all memory T cells but shows selective recruitment of discrete, antigen-specific populations with a defined homing phenotype. These data will assist in the development of novel immunotherapy strategies based on the unique properties of cells from this lymphoid microenvironment.51
The online version of this article contains a data supplement.
The publication costs of this article were defrayed in part by page charge payment. Therefore, and solely to indicate this fact, this article is hereby marked “advertisement” in accordance with 18 USC section 1734.
Acknowledgments
This work is supported by a program grant from the MRC, United Kingdom. U.P. is on a National Health and MRC of Australia fellowship.
Authorship
Contribution: U.P., A.B.R., C.D.B., and P.M. designed research; U.P., R.C., A.B., K.P., and W.R. performed the experiments; U.P., R.C., W.R., K.P., and L.M. analyzed the data; G.P. and R.S. provided the clinical samples; N.K. and A.D.H. provided CMV and EBV tetramers; and U.P., C.D.B., and P.M. wrote the manuscript.
Conflict-of-interest disclosure: The authors declare no competing financial interests.
Correspondence: Paul A. H. Moss, Cancer Research UK Institute for Cancer Studies, University of Birmingham, Edgbaston, B13 2TA, United Kingdom; e-mail: p.moss@bham.ac.uk.
References
Author notes
*U.P. and R.C. contributed equally to this study.

