Abstract
Insights into the role of ankyrin-1 (ANK-1) in the formation and stabilization of the red cell cytoskeleton have come from studies on the nb/nb mice, which carry hypomorphic alleles of Ank-1. Here, we revise several paradigms established in the nb/nb mice through analysis of an N-ethyl-N-nitrosourea (ENU)–induced Ank-1–null mouse. Mice homozygous for the Ank-1 mutation are profoundly anemic in utero and most die perinatally, indicating that Ank-1 plays a nonredundant role in erythroid development. The surviving pups exhibit features of severe hereditary spherocytosis (HS), with marked hemolysis, jaundice, compensatory extramedullary erythropoiesis, and tissue iron overload. Red cell membrane analysis reveals a complete loss of ANK-1 protein and a marked reduction in β-spectrin. As a consequence, the red cells exhibit total disruption of cytoskeletal architecture and severely altered hemorheologic properties. Heterozygous mutant mice, which have wild-type levels of ANK-1 and spectrin in their RBC membranes and normal red cell survival and ultrastructure, exhibit profound resistance to malaria, which is not due to impaired parasite entry into RBC. These findings provide novel insights into the role of Ank-1, and define an ideal model for the study of HS and malarial resistance.
Introduction
Defects in red blood cell (RBC) membranes are one of the commonest causes of inherited hemolytic anemia in man.1 Foremost in this group is hereditary spherocytosis (HS), which is caused by aberrant expression of 1 of 5 major erythroid cytoskeletal proteins: ankyrin (in 50% of cases), β-spectrin (in 20%), band 3 (in 20%), α-spectrin (in 5%), and protein 4.2 (in 5%).2,3 In the erythrocyte, tetramers of α-spectrin and β-spectrin heterodimers are linked to the lipid bilayer through associations with 2 multiprotein complexes: the ankyrin, band 3, and protein 4.2 complex; and the protein 4.1, p55, and glycophorin C complex.4-9 These associations are required for red cells to maintain their shape, and to withstand the physical forces imposed on them during circulation. Disruption of these interactions leads to fragmentation, accumulation of dysmorphic red cells in the spleen, and hemolytic anemia
The study of the molecular basis of HS has been facilitated by the analysis of both spontaneous and engineered mouse mutants.10 Although RBC membrane defects display predominantly autosomal dominant inheritance in humans, in mice they are usually recessive. The murine α-spectrin mutations sph/sph,11,12 sph2BC/sph2BC, and sphJ/sphJ13 all result in severe HS, although the affected mice survive into adulthood. In contrast, mice lacking β-spectrin (jaundiced, ja/ja) rarely survive beyond the fourth postnatal day, and die with severe anemia, hepatosplenomegaly, and cardiac enlargement.14,15 Band 3 knockout mice exhibit severe HS, and 80% to 90% of the animals die within 2 weeks of birth. Surprisingly, red cell membrane skeleton assembly occurs normally in these animals.16,17 Another band 3 deficient strain, the spontaneous wan/wan mutant, exhibits a more severe phenotype, with all homozygotes dying within 72 hours of birth. This line also exhibits a severe defect in utero, with reduced RBC counts apparent by fetal day 16.18 Protein 4.2 null mice exhibit the mildest phenotype, with a very small decrease in hemoglobin and mild reticulocytosis. The membrane skeletal architecture was normal in these animals.19 Although loss of protein 4.1R is associated with hereditary elliptocytosis (HE) in humans, mice lacking this gene exhibit HS, with moderate hemolysis and reticulocytosis. Interestingly, recent studies have demonstrated extensive loss of cytoskeletal lattice structure in these animals.4
Only a single mouse model of ankyrin deficiency has been described, the spontaneous normoblastosis mouse (nb/nb).20 This line carries a deletion of a guanosine residue in exon 36 that leads to a frame shift that introduces a premature stop codon after the addition of 13 residues, resulting in the production of a 157-kDa protein. The wild-type ankyrin-1 (ANK-1) protein is 210 kDa and contains 3 major functional domains, an N-terminal 89-kDa membrane-binding domain, a 62-kDa spectrin-binding domain, and a C-terminal 55-kDa regulatory domain.21,22 ANK-1 isoforms lacking this latter domain show increased binding affinity for the membrane and spectrin ligands.23,24 A fourth region of unknown function, known as the death domain in view of its homology within the intracellular portions of the proapoptotic receptors Fas and tumor necrosis factor receptor 1 (TNFR1),25 is found between the spectrin and regulatory domains. The truncated ANK-1 protein in the nb/nb mouse lacks the regulatory domain, but includes the membrane and spectrin-binding domain.20 The levels of the other critical membrane proteins are preserved in the nb/nb mice, with only spectrin levels being reduced to 50% of wild-type. The nb/nb mice display normal membrane skeletal ultrastructure, prompting the conclusion that ankyrin was not required for the formation of a stable 2-dimensional spectrin-based skeleton.26 They also appear normal at birth, which has been attributed to the presence of a fetal compensatory mechanism for Ank-1 deficiency.27 This was postulated to be provided by unique ankyrin-related proteins in fetal erythrocytes and up-regulation of fetal transcripts to compensate for Ank-1 deficiency.21 The nb/nb mice have also been shown to exhibit resistance to malaria that was thought to be mediated by their relative spectrin deficiency.28 More recently, the nb mutation has been shown to be a hypomorphic allele of Ank-1, producing a truncated protein of 157 kDa.20 The expression of this protein suggests that the functional consequences ascribed to Ank-1 deficiency in the nb/nb mice may well differ with analysis of mice carrying an Ank-1 null mutation.
In this article, we report the identification and characterization of the first mouse line with an Ank-1 null mutation, identified in an N-ethyl-N-nitrosourea (ENU) mutagenesis screen for RBC phenotypes. The mutation leads to complete loss of ANK-1 protein expression in homozygous animals, with a concomitant reduction in spectrin and protein 4.2 and severe hemolysis. The analysis of these mice provides unique insights into the role of Ank-1 in erythroid development and generates questions regarding the mechanism of malarial resistance in Ank-1 deficiency.
Methods
Gene mapping
The Ank-11674 mutation was mapped by outcrossing affected heterozygous animals to wild-type C57BL/6 mice. Genomic DNA was collected from F2 animals at 3 weeks, and a genome-wide scan was performed on each with a panel of simple sequence-length polymorphism (SSLP) markers. Candidate intervals were refined by analyzing the products of additional meioses with MIT and inhouse CA repeat markers at increasing density. For sequencing of candidate genes, total RNA was isolated from spleen tissue with TRIzol (Invitrogen, Carlsbad, CA) and reverse-transcribed with the Reverse Transcription System (Promega, Madison, WI) using random primers. Genomic DNA was amplified by PCR, purified with the QIAquick PCR purification kit (QIAGEN, Valencia, CA), and directly sequenced with a BigDye Terminator v3.1 kit (Applied Biosystems, Foster City, CA).
All animal experiments were preapproved by the Animal Ethics Committees of the Walter and Eliza Hall Institute (WEHI) for Medical Research, Melbourne Health, and the University of Melbourne.
Manual white blood cell and platelet counts
The corrected white blood cell (WBC) count in 3 RBC2/RBC2 mice was obtained by manually counting the total nucleated cells (TNC), and the nucleated red blood cells (NRBC), in 50 40× fields from standard blood films. The corrected WBC count was calculated as the measured TNC − measured TNC × %NRBC. The corrected platelet count in 3 RBC2/RBC2 mice was obtained by manually counting platelets in 50 40× fields from standard blood films and comparing this to equivalent films from 3 wild-type mice.
Quantitative polymerase chain reaction
Quantitative polymerase chain reaction (PCR) analysis of gene expression was conducted using a Rotorgene 2000 instrument (Corbett Research, Sydney, Australia). Amplification of cDNA products was followed using the fluorescent DNA-binding dye SybrGreen (Molecular Probes, Eugene, OR) at a dilution of 1:10 000. Gene expression of Ank-1 was normalized to expression of hypoxanthine phosphoribosyltransferase (HPRT), and data are expressed as a percentage of the wild-type.
Gene-specific primer sequences: Ank-1, 5′-TGGAAGGAGCACAAGAGTCGT-3′; Ank-1, 5′-CAGAGCCAGCTTCACTTTCTTG-3′; HPRT, 5′-ATGGACAGGACTGAACGTCT-3′; HPRT, 5′-CTTGCGACCTTGACCA-TCTT-3′.
Histology, bilirubin measurement, and quantitation of tissue iron
Sections of spleen from wild-type and RBC2/RBC2 mice were stained with hematoxylin and eosin. Blood films were stained with Wright-Giemsa stain. Total serum bilirubin was quantitated with an AU2700 multichannel analyzer (Olympus, Tokyo, Japan). Tissue iron was measured by digesting samples with ultrapure concentrated nitric perchloric acid followed by flame atomic absorption spectrophotometry.
Electron microscopy
For scanning electron microscopy (SEM) analysis, a drop of tail blood was suspended in 1 mL 0.1 M phosphate buffer (PB), pH 7.4, and centrifuged at 1500 rpm for 5 minutes at 4°C. After centrifugation, the pelleted cells were resuspended in 1 mL 2.5% glutaraldehyde and fixed for 1 hour at room temperature on a rotating wheel, ensuring the cells were continually spinning to allow a single-cell suspension. Once fixed, the cells were rinsed in 3 changes (15 minutes each) of PB containing 5% sucrose, and 100 μL of the final cell suspension were placed on a Thermanox coverslip (Nunc, Thermo Fisher Scientific, Rochester, NY) and incubated at 4°C until the cells had adhered (∼ 30 minutes to 1 hour). The cells attached to the coverslips were then postfixed with 2.5% osmium tetroxide (OsO4) for 1 hour at room temperature and rinsed extensively in distilled water (3 × 15-minute changes). After rinsing, the cells were dehydrated through increasing concentrations of acetone (5-minute changes in each of 70, 80, 90, 95, and 100%). Samples were then critical point dried (Polaron critical point dryer; Quorum Technologies, East Sussex, United Kingdom), mounted on stubs with carbon dag (ProSciTech, Thuringowa, Australia), and sputter-coated with gold in an Edwards Sputter Coater (Edwards, West Sussex, United Kingdom). Gold-coated samples were observed using a 515 Scanning Electron Microscope (Phillips, Amsterdam, The Netherlands) at 20 kV.
For freeze-fracture EM, washed RBCs were fixed in 1.75% glutaraldehyde in 0.1 M sodium cacodylate buffer, pH 7.4, for 1.5 hours at 0°C. The fixed cells were washed 5 × in 0.05 M sodium cacodylate, pH 7.4, glycerinated (final glycerol concentration, 22%), frozen in freon, and transferred to liquid nitrogen. Samples were then fractured in a freeze-etch unit at −110°C and rotary shadowed at a 25° angle with platinum-carbon and at a 90° angle with carbon. Replicas were viewed in a transmission electron microscope at an accelerating voltage of 80 kV.
Red cell rigidity and red cell ghost preparation
SDS-PAGE and Western blot analysis
For Coomassie staining, RBC ghosts preps were subjected to sodium dodecyl sulfate–polyacrylamide gel electrophoresis (SDS-PAGE),31 using 4% to 20% gradient gels or 5% gels as indicated. The gel loading was based on the final volume of the ghosts before resuspension in SDS loading buffer. Equivalent loading was further validated in the immunoblots with the actin loading control. For immunoblots, 4% to 20% gradient gels were run, and transferred to nitrocellulose membranes. The membranes were incubated with various specific antibodies and then washed extensively before incubation with peroxidase-conjugated secondary antibodies. After further extensive washes, the blots were visualized using enhanced chemiluminescence (ECL) reagents (Amersham Biosciences, Piscataway, NJ). ANK-1 antibodies were kindly provided by Connie Birkenmeier; β1 spectrin was purchased from Abcam (ab2808; Cambridge, MA); and actin (1-19) from Santa Cruz Biotechnology (sc-1616; Santa Cruz, CA). All other antibodies were generously provided by Xiuli An.
Red cell survival assay and immunostaining of bone marrow cytospins
Red cell survival was measured using an in vivo biotinylation method as described.32 For immunostaining, bone marrow cytospins were incubated with an Ank-1 antibody or normal rabbit immunoglobulin G (IgG) overnight at 4°C, and then rinsed with 6% hydrogen peroxide in methanol before incubation biotinylated secondary antibody (Dako, Carpinteria, CA). The reaction was amplified by applying avidin-biotin-peroxidase complex (Vectstain ABC kit; Vector Laboratories, Burlingame, CA) for 30 minutes and visualized by incubation with diaminobenzadine (Dako) in the presence of hydrogen peroxide for 8 to 10 minutes. Cytospins were counterstained with Mayer's hematoxylin and examined with an Axioplan light microscope (Carl Zeiss, Jena, Germany).
In vivo and in vitro malaria assays
For in vivo assays, a trial Plasmodium chabaudi challenge was conducted on wild-type BALB/c mice to determine the optimum infective dose. Survival curves were split by sex, as males are known to be more susceptible, showing earlier signs of infection and succumbing 2 to 3 days before their female littermates.33,34 Females were infected with 1 × 10⁴ malaria-infected RBCs (IRBCs), and the males with 2.5 × 10³ IRBCs. The age of mice at the time of infection ranged between 9 to 11 weeks.
For in vitro assays, blood was collected from BALB/c donor mice displaying between 1% to 5% parasitemia by cardiac puncture, and mature schizonts were purified as previously described.35 During the purification procedure, uninfected blood was collected from Ank-11674/+ or wild-type mice that had been pretreated 3 days earlier with 200 μL phenylhydrazine in 6 mg/mL phosphate-buffered saline (PBS). Purified schizonts containing fully developed merozoites were resuspended in 100 μL Ank-11674/+ or wild-type RBCs and mixed by pipeting to break up the schizonts and facilitate invasion. The mixture was left shaking at 37°C for 15 minutes and then added to 10 mL Plasmodium berghei culture medium. Cultures were gassed for 90 seconds with a 5% CO2, 5% O2, and 90% N2 mixture and incubated at 37°C for 6 hours. Merozoite invasion was determined by counting the number of ring-stage parasites in Giemsa-stained blood smears prepared from the short-term cultures.
Osmotic fragility test
Fresh blood was collected from 6-week-old mice into ethylenediaminetetraacetic acid (EDTA), and the test was performed within 2 hours of collection. Equal numbers of cells were mixed with NaCl solutions of various osmolarities and incubated for 20 minutes at room temperature. After gentle centrifugation, the absorbance of supernatants was determined at 540 nm. The absorbance of each sample in water was taken as 100% lysis.
Results
Severe hemolysis in an ENU-induced mutant mouse strain
We established a large-scale ENU mutagenesis screen in mice to identify dominant mutations that affected erythroid production and maturation. Male Mpl–/– mice on a BALB/c background were treated with ENU,36 then mated with untreated female Mpl−/− mice to generate G1 progeny that were screened by analysis of their full blood count at weaning (Figure S1A, available on the Blood website; see the Supplemental Materials link at the top of the online article). The line described here (RBC2) was selected on the basis of a reduced mean corpuscular volume (MCV) that was 3 standard deviations outside the normal population (MCV 41.0 ± 1.1 in mutant versus 45.5 ± 1.5 in wild-type mice). The affected G1 heterozygous mice were crossed with wild-type BALB/c animals to segregate the Mpl−/− locus out of the line. Mice with a low MCV that were wild-type at the Mpl locus were identified, and these animals were used for all subsequent experiments. Pups (50%) from affected animals crossed with wild-type BALB/c mice displayed a reduced MCV, indicating that the phenotype was fully penetrant, and displayed simple Mendelian inheritance (Figure S1B).
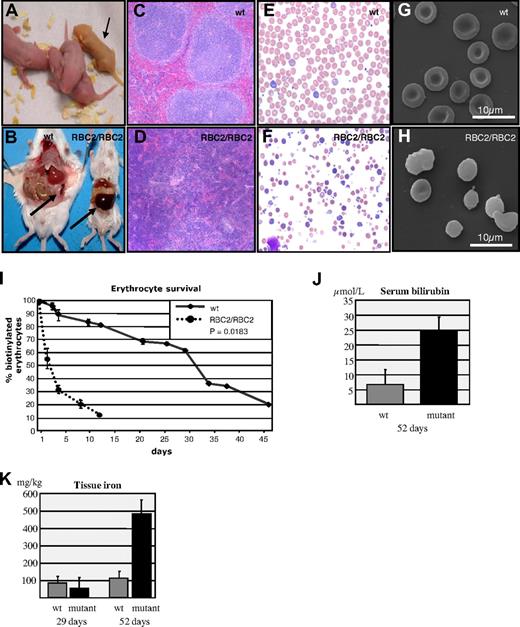
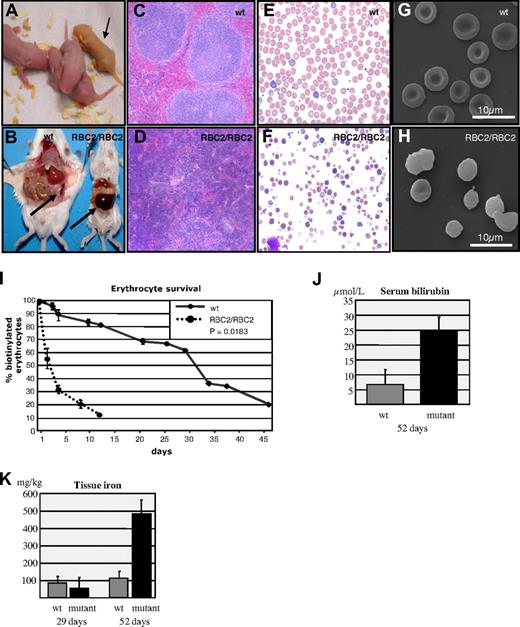
To determine whether mice homozygous for the mutation exhibited a more profound phenotype, we intercrossed affected heterozygous animals and examined the full blood counts of their progeny at weaning (Table 1). We observed 3 distinct populations. In addition to the significant difference in their MCV, the wild-type and RBC2 heterozygous (RBC2/+) mice exhibited more modest differences in their red cell distribution width (RDW) and RBC count. The absolute and differential white cell counts and platelet counts were normal in the RBC2/+ mice. The third group (RBC2 homozygotes, RBC2/RBC2) displayed severe anemia and markedly abnormal red cell indices (Table 1). Although the automated leukocyte and platelet counts appeared elevated in these mice, these counts were inaccurate due to the presence of circulating nucleated red cells and red cell fragments, respectively. Manual leukocyte and platelet counts performed on these mice (see “Manual white blood cell and platelet counts”) were within the normal range indicating that the RBC2/RBC2 mice had a disorder restricted to the erythroid lineage. As the reticulocyte count is also inaccurate using automated counters, we quantitated the percentage of these cells in the RBC2/RBC2 mice manually in new methylene blue-stained blood films. This demonstrated a reticulocyte count of 50% (Figure S1C). The severely anemic pups were observed at a frequency of 11% at weaning (predicted 25%), indicating that homozygosity for the mutation caused embryonic or neonatal lethality. To examine this, we viewed newborn litters and noted that approximately 15% of pups became jaundiced within hours of birth (Figure 1A). We also noted that a substantial number of pups from RBC2 heterozygous matings were cannibalized immediately after birth. All the homozygous mice had succumbed by 8 weeks of age. At autopsy, the spleen was enlarged almost 6-fold (0.11 g wild-type versus 0.61 g RBC2 homozygote) (Figure 1B), and histology revealed complete effacement of the normal splenic architecture with extramedullary erythropoiesis (Figure 1C,D). Peripheral blood smears from RBC2/RBC2 pups at 3 weeks reflected the abnormal RBC indices, with marked aniso- and poikilocytosis, red cell fragmentation, abundant spherocytes, marked reticulocytosis, and the presence of circulating nucleated erythroblasts, indicative of red cell destruction and severe erythropoietic stress (Figure 1E,F). SEM highlighted the morphologic changes in the erythrocytes from RBC2/RBC2 pups with prominent spherocytes, membrane blebbing, and red cell fragments, but no normal biconcave shaped cells seen (Figure 1G,H).
Identification and characterization of RBC2 mice. (A) Jaundiced postnatal day 1 RBC2/RBC2 pup (→) and littermate controls from an RBC2/+ × RBC2/+ mating. (B) Massive splenomegaly in an RBC2/RBC2 animal. (C,D) Splenic histology from wild-type (wt) and RBC2/RBC2 mice. (E,F) Peripheral blood smears from wt and RBC2/RBC2 mice. (G,H) SEM of erythrocytes from wt and RBC2/RBC2 mice. (I) In vivo red cell survival study in wt and RBC2/RBC2 mice. The P value was determined using analysis of variance (ANOVA), and less than .05 was considered significant. (J) Serum bilirubin measured at 52 days in 4 wild-type and 4 RBC2/RBC2 animals. Student t test (P = .023). (K) Liver iron measured at 29 and 52 days in 4 wild-type and 4 RBC2/RBC2 animals. Error bars represent SD in all figures. Student t tests were performed: 29 days measurement (P = .045); and for the 52 day dataset (P = 1.05 × 10⁻⁵). P values less than .05 were considered significant.
Identification and characterization of RBC2 mice. (A) Jaundiced postnatal day 1 RBC2/RBC2 pup (→) and littermate controls from an RBC2/+ × RBC2/+ mating. (B) Massive splenomegaly in an RBC2/RBC2 animal. (C,D) Splenic histology from wild-type (wt) and RBC2/RBC2 mice. (E,F) Peripheral blood smears from wt and RBC2/RBC2 mice. (G,H) SEM of erythrocytes from wt and RBC2/RBC2 mice. (I) In vivo red cell survival study in wt and RBC2/RBC2 mice. The P value was determined using analysis of variance (ANOVA), and less than .05 was considered significant. (J) Serum bilirubin measured at 52 days in 4 wild-type and 4 RBC2/RBC2 animals. Student t test (P = .023). (K) Liver iron measured at 29 and 52 days in 4 wild-type and 4 RBC2/RBC2 animals. Error bars represent SD in all figures. Student t tests were performed: 29 days measurement (P = .045); and for the 52 day dataset (P = 1.05 × 10⁻⁵). P values less than .05 were considered significant.
The severity of hemolytic states is routinely assessed by analysis of red cell survival in vivo. We injected 6-week old RBC2/RBC2 mice and wild-type littermates with biotin and measured the percentage of labeled erythrocytes by fluorescence-activated cell sorting (FACS) analysis (Figure 1I). The erythrocyte half-life in RBC2/RBC2 mice was approximately 2 days compared with 32 days in the controls. Other markers of red cell destruction, namely the levels of bilirubin in the blood, and the degree of iron overload in the liver were also markedly abnormal. At postnatal day 52, total bilirubin levels in homozygous mutant mice were nearly 4 times higher than in their control littermates (Figure 1J). Quantitation of nonheme iron levels in the liver of wild-type and homozygous mutant mice demonstrated almost equivalent levels at day 29. However, by 52 days, a greater than 4-fold increase was observed in iron deposition in the liver of the RBC2 homozygous mice compared with the controls (481 mg/kg compared with 112 mg/kg; Figure 1K). Taken together, our results were indicative of severe hemolysis with inadequate compensatory extramedullary erythropoiesis.
Identification of a novel Ank-1 mutation in RBC2 mice
To map the RBC2 mutation, we crossed heterozygous mice with wild-type C57Bl/6 mice, and the resultant affected F1 mice (as determined by a low MCV) were intercrossed to produce 70 F2 generation mice. At 7 weeks of age, these mice were bled, their MCV and hemoglobin levels determined, and severely anemic mice were excluded. Using a set of 148 simple sequence-length polymorphisms, the only region of the genome in which linkage was observed was at the centromeric end of chromosome 8 between markers D8Mit3 and D8Mit124 (Figure 2A). Within this chromosomal region, the erythroid ankyrin gene (Ank-1) represented a compelling candidate. In view of the multiple Ank-1 isoforms that have been described previously,37-39 we amplified the Ank-1 cDNA from heterozygous mutants, and sequenced individual clones. In several of these clones, we detected a 22-nucleotide (nt) deletion from nt 5376 to nt 5397 (data not shown). Analysis of the exon-intron structure of the Ank-1 genomic locus revealed that the deletion affected the 5′ end of exon 41. We therefore sequenced this region of the genomic locus from heterozygotes and identified a single point mutation in the form of a G to C transversion located at the splice acceptor site of exon 41 (Figure 2B). We confirmed that the severely anemic mice were homozygous for this mutation (Figure 2B). This finding, coupled with the structure of the deleted mRNA, indicated the presence of an alternate splice acceptor site 22 nt 3′, which induced a frame shift after amino acid 1674 resulting in the addition of a further 96 residues and a premature termination codon (Figure 2C). The open reading frame of the transcript from the mutant RBC2 allele (designated hereafter as Ank-11674) predicts for an ANK-1 protein of approximately 194 kDa (Figure 2D).
Identification of the Ank-11674 allele. (A) Haplotypes of F2 mapping offspring. Markers used and their position on mouse chromosome 8 according to the July 2007 University of California Santa Cruz genome sequence (based on the National Center for Biotechnology Information [NCBI] and Mouse Genome Sequencing Consortium Build 37) are shown. [□] indicates homozygous BALB/c genotype; [ ], homozygous C57BL/6, and [
 ], heterozygous. The candidate interval for RBC2 was refined to 11 Mb, between D8Mit124 and D8Mit3. Ank-1 lies at 24 085 316-24 260 968 Mb. (B) DNA sequence electropherograms showing the G to C transversion at the splice acceptor site of exon 41 in Ank-11674/+ and Ank-11674/1674 mice. (C) Schematic view of the predicted wild-type and Ank-11674 alleles. (D) Schematic of the wild-type and the predicted Ank-11674 proteins.
Identification of the Ank-11674 allele. (A) Haplotypes of F2 mapping offspring. Markers used and their position on mouse chromosome 8 according to the July 2007 University of California Santa Cruz genome sequence (based on the National Center for Biotechnology Information [NCBI] and Mouse Genome Sequencing Consortium Build 37) are shown. [□] indicates homozygous BALB/c genotype; [ ], homozygous C57BL/6, and [
 ], heterozygous. The candidate interval for RBC2 was refined to 11 Mb, between D8Mit124 and D8Mit3. Ank-1 lies at 24 085 316-24 260 968 Mb. (B) DNA sequence electropherograms showing the G to C transversion at the splice acceptor site of exon 41 in Ank-11674/+ and Ank-11674/1674 mice. (C) Schematic view of the predicted wild-type and Ank-11674 alleles. (D) Schematic of the wild-type and the predicted Ank-11674 proteins.
Ank-11674/1674 red cells are deficient in ANK-1 protein and exhibit defective cytoskeletal architecture
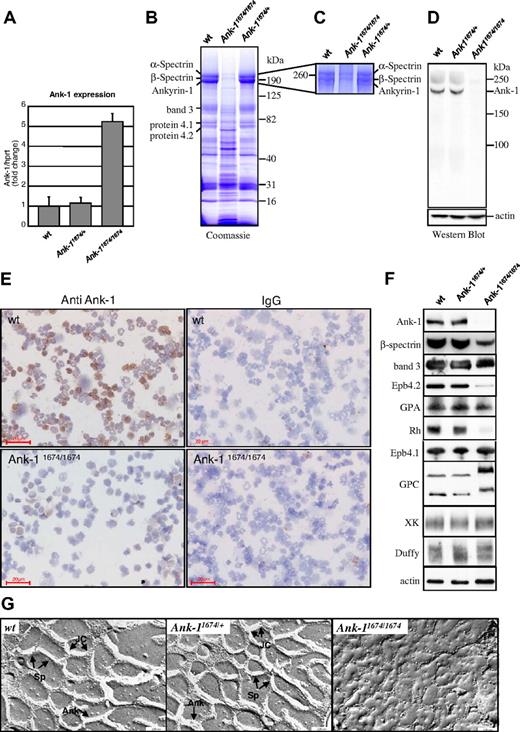
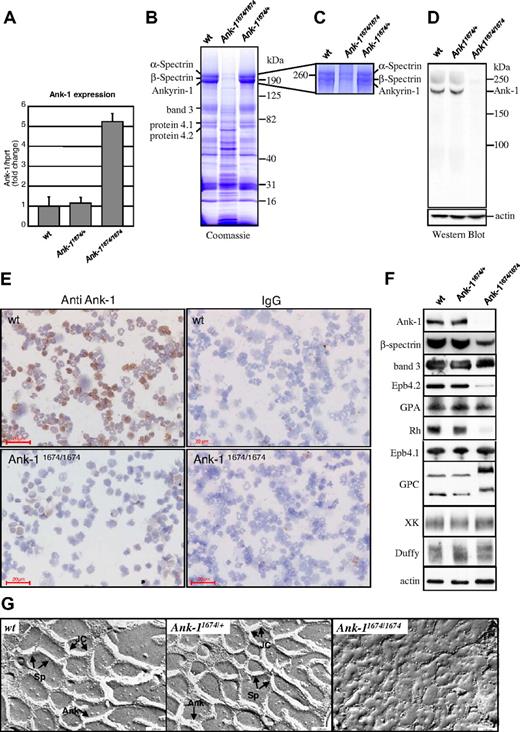
To establish whether Ank-11674/1674 transcripts would be subjected to nonsense-mediated mRNA decay, we quantitated Ank-1 mRNA levels in erythroid progenitors from adult spleen in homozygous mutant mice by quantitative RT-PCR (Figure 3A). The transcript levels in Ank-11674/1674 mice were 5-fold higher than in wild-type and heterozygous littermates, suggestive of a compensatory mechanism for the lack of a functional protein. To assess this, we examined the protein content of RBC ghost membranes from wild-type, Ank-11674/+, and Ank-11674/1674 mice on Coomassie blue-stained gradient SDS polyacrylamide gels37 (Figure 3B). The intensity of the RBC membrane proteins α-spectrin and β-spectrin, ANK-1, band 3, protein 4.1, and protein 4.2 appeared identical in both the wild-type and Ank-11674/+ heterozygous mice. In contrast, the staining pattern of the Ank-11674/1674 membranes was more complex, with the predominant feature being a marked reduction in staining in the region of ANK-1, α-spectrin, and β-spectrin. As the resolution of these bands on this gel was insufficient to allow us to determine whether there was a differential reduction in the levels of these proteins, we repeated the electrophoresis on the wild-type, heterozygous, and homozygous ghosts, maximizing the separation of the 3 proteins through an extended run on a 5% gel (Figure 3C). Three bands were readily detected in the wild-type and Ank-11674/+ membrane preparations. In the homozygous mutant, weakly staining upper bands corresponding to α-spectrin and β-spectrin were observed, but no ANK-1 band was detectable. To confirm that the Ank-11674/1674 mice lacked ANK-1 protein, we prepared RBC ghost membranes from wild-type, Ank-11674/+, and Ank-11674/1674 red cells, and performed a western blot analysis with an antibody to the 89-kDa N-terminal membrane binding domain of ANK-1 (Figure 3D). This domain would be retained in the predicted mutant protein. The 210-kDa full-length ANK-1 protein was readily detected in both the wild-type and heterozygous mice at equivalent levels. In contrast, the mutant animals exhibited no evidence of either the full-length protein or the predicted 194-kDa truncated form. To determine whether a mutant form of ankyrin was present in erythroid precursors, but was degraded upon maturation, we performed immunostaining on bone marrow cytospins from 6-week-old wild-type and Ank-11674/1674 mice (Figure 3E). Although robust staining was observed with wild-type erythroid cells, no ankyrin was detectable in the mutant.
Ank-11674/1674 are null mutants exhibiting severe RBC membrane abnormalities. (A) Quantitative RT-PCR measurement of Ank-1 mRNA levels in 6-week-old wild-type (wt), Ank-11674/+, and Ank-11674/1674 mice. Error bars represent SD. Student t test P values between wt and Ank-11674/1674 were significant (P < .05) and not significant (P > .05) between wt and Ank-11674/+. (B) Coomassie blue–stained SDS polyacrylamide gradient gel (4%-20%), and (C) 5% SDS polyacrylamide gel of membrane ghosts from wt, Ank-11674/+, and Ank-11674/1674 mice. (D) Immunoblot of transmembrane proteins in red cells of wt, Ank-11674/+, and Ank-11674/1674 mice probed with anti–Ank-1 and anti-actin antibodies. (E) Immunostaining of adult bone marrow cytospins from wt, Ank-11674/1674 mice with anti–ANK-1 antibodies, and an IgG control. (F) Immunoblot of transmembrane proteins in red cells of wt, Ank-11674/+, and Ank-11674/1674 mice probed with antibodies against the indicated proteins. (G) Freeze-fracture EM images of red cell membrane skeletons from wt, Ank-11674/+, and Ank-11674/1674 mice. JC indicates junctional complexes; Sp, spectrin tetramers; and Ank, ankyrin.
Ank-11674/1674 are null mutants exhibiting severe RBC membrane abnormalities. (A) Quantitative RT-PCR measurement of Ank-1 mRNA levels in 6-week-old wild-type (wt), Ank-11674/+, and Ank-11674/1674 mice. Error bars represent SD. Student t test P values between wt and Ank-11674/1674 were significant (P < .05) and not significant (P > .05) between wt and Ank-11674/+. (B) Coomassie blue–stained SDS polyacrylamide gradient gel (4%-20%), and (C) 5% SDS polyacrylamide gel of membrane ghosts from wt, Ank-11674/+, and Ank-11674/1674 mice. (D) Immunoblot of transmembrane proteins in red cells of wt, Ank-11674/+, and Ank-11674/1674 mice probed with anti–Ank-1 and anti-actin antibodies. (E) Immunostaining of adult bone marrow cytospins from wt, Ank-11674/1674 mice with anti–ANK-1 antibodies, and an IgG control. (F) Immunoblot of transmembrane proteins in red cells of wt, Ank-11674/+, and Ank-11674/1674 mice probed with antibodies against the indicated proteins. (G) Freeze-fracture EM images of red cell membrane skeletons from wt, Ank-11674/+, and Ank-11674/1674 mice. JC indicates junctional complexes; Sp, spectrin tetramers; and Ank, ankyrin.
Two types of multiprotein complexes have been identified in the red cell membrane.4,9 In one, ankyrin provides linkage between the spectrin-actin–based erythrocyte membrane skeleton and the plasma membrane by attaching tetramers of spectrin to the cytoplasmic domain of band 3.21,22 The membrane skeletal protein 4.2 also binds to band 3 and ankyrin in this complex, which also contains the transmembrane glycoproteins glycophorin A (GPA), Rh, and RhAG.9 The second complex centers on protein 4.1 and includes spectrin, F-actin, band 3, glycophorin C (GPC), p55, and blood group proteins Duffy, XK, and Rh.4 We quantitated the levels of representative proteins from these 2 complexes in red cells from wild-type, Ank-11674/+, and Ank-11674/1674 mice by western blot analysis (Figure 3F). In this experiment, the ANK-1 blot was performed with an antibody to the spectrin-binding domain of ankyrin, which would be retained in the predicted mutant protein. This confirmed the lack of ANK-1 protein in the mutant, with normal levels in the wild-type and Ank-11674/+controls. Consistent with this, the wild-type and heterozygous membranes contained comparable levels of β-spectrin, whereas this protein was markedly reduced in the homozygous mutant animals (to approximately 25% of control). Protein 4.2, Rh, and GPA were also markedly reduced in the Ank-11674/1674 membranes. The reduction in GPA was also confirmed by FACS analysis (data not shown). In contrast, expression of protein 4.1, band 3, GPC (which migrated slightly aberrantly, possibly reflecting altered posttranslational modifications), XK, and Duffy were maintained in the mutant red cells, as were the levels of actin, which were identical in mice of all 3 genotypes.
Spectrin deficiency in patients with severe HS is associated with significant ultrastructural disruption of the red cell cytoskeleton.40 Although previous studies in the nb/nb mice had demonstrated near normal cytoskeletal architecture, the significant reduction in membrane-associated β-spectrin in the Ank-11674/1674 mice prompted us to reevaluate this. Electron microscopy of red cell membrane skeletons from wild-type and Ank-11674/+ mice displayed the normal uniform 2-dimensional hexagonal array of junctional complexes (JC) cross-linked by spectrin tetramers. This symmetrical array was completely lost in the cytoskeletal preparations from the Ank-1 homozygous mutants, and instead, large bare areas devoid of organized structure were observed (Figure 3G). The uniform skeletal lattice accounts for the remarkable deformability of the red cell. In the native RBC membrane, spectrin undergoes considerable folding, and the distance between the individual JC is considerably shorter than in the uniformly extended membrane skeleton. To assess the effects of the disruption of the skeletal lattice, we measured red cell rigidity, an important hemorheologic parameter determining the passage of erythrocyte through narrow capillaries. Using single-cell micropipet aspiration, we found no changes in the shear elastic modulus between wild-type and Ank-11674/+ erythrocytes (Table 2). In contrast, spherical RBCs from Ank-11674/1674 mice displayed extremely high red cell rigidity. These parameters of reduced mechanical resilience would explain the severe RBC fragmentation observed in blood films from Ank-11674/1674 mice.
Lack of fetal compensation of hemolysis in Ank-11674/1674 mice
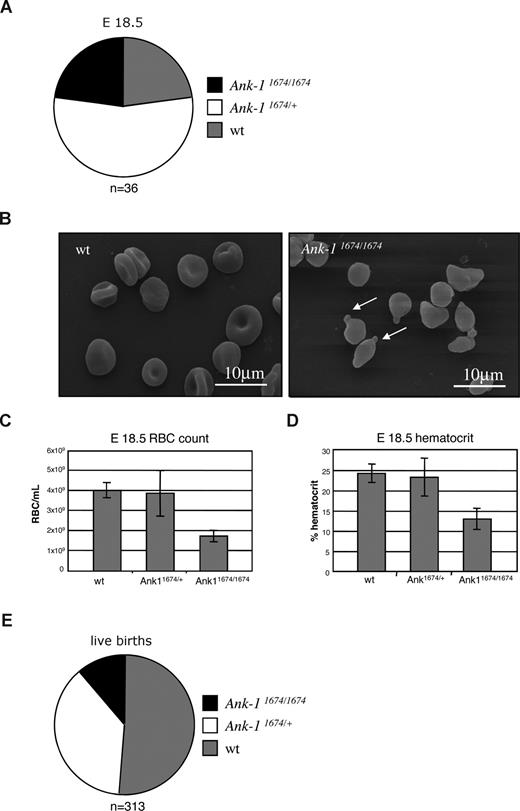
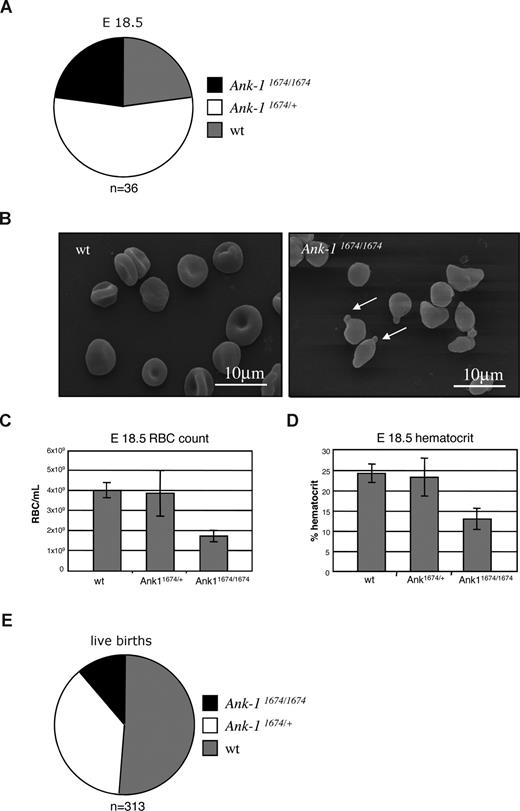
Previous studies in the nb/nb mouse line suggested that the ankyrin deficiency was compensated in utero, as newborn nb/nb mice exhibited no pallor, and at E18.5 displayed normal RBC morphology.27 In view of the obvious differences observed with the Ank-11674/1674 mice, many of which die in the immediate perinatal period, we examined litters from timed matings of Ank-11674/+ heterozygous mice at E18.5. Although we observed no fetal wastage in these litters, with homozygous pups present in a normal Mendelian ratio at E18.5 (Figure 4A), these animals displayed marked erythroid morphologic abnormalities on SEM, with spherocytes, membrane blebbing, and red cell fragmentation (Figure 4B). These appearances were identical to those observed in the samples from homozygous mutants examined after weaning (Figure 1H). In addition, the embryos exhibited a marked reduction in their RBC and hematocrit (Figure 4C,D). Consistent with an uncompensated fetal defect, we observed a significant reduction in live births of the homozygous mutant mice (Figure 4E).
Defective erythropoiesis in Ank-11674/1674 E18.5 embryos. (A) Genotype distribution of wt, Ank-11674/+, and Ank-11674/1674 mice at E18.5. (B) SEM of RBC from wt and Ank-11674/1674 embryos at E18.5. (C,D) RBC and hematocrit in wt, Ank-11674/+, and Ank-11674/1674 embryos at E18.5. Student t tests were performed: the RBC count P value between wt and Ank-11674/+ (P = .34); and between wt and Ank-11674/1674 (P = .009). P values for the hematocrit between wt and Ank-11674/+ (P = .406); and between wt and Ank-11674/1674 (P = .028). P values less than .05 were considered significant. (E) Genotype distribution of live wt, Ank-11674/+ and Ank-11674/1674 mice at birth. Error bars represent SD in all figures.
Defective erythropoiesis in Ank-11674/1674 E18.5 embryos. (A) Genotype distribution of wt, Ank-11674/+, and Ank-11674/1674 mice at E18.5. (B) SEM of RBC from wt and Ank-11674/1674 embryos at E18.5. (C,D) RBC and hematocrit in wt, Ank-11674/+, and Ank-11674/1674 embryos at E18.5. Student t tests were performed: the RBC count P value between wt and Ank-11674/+ (P = .34); and between wt and Ank-11674/1674 (P = .009). P values for the hematocrit between wt and Ank-11674/+ (P = .406); and between wt and Ank-11674/1674 (P = .028). P values less than .05 were considered significant. (E) Genotype distribution of live wt, Ank-11674/+ and Ank-11674/1674 mice at birth. Error bars represent SD in all figures.
Ank-11674 heterozygous mice are resistant to malaria infection
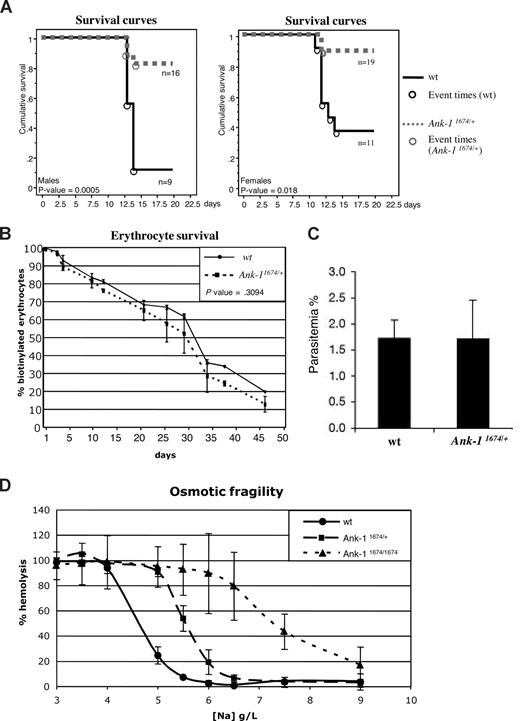
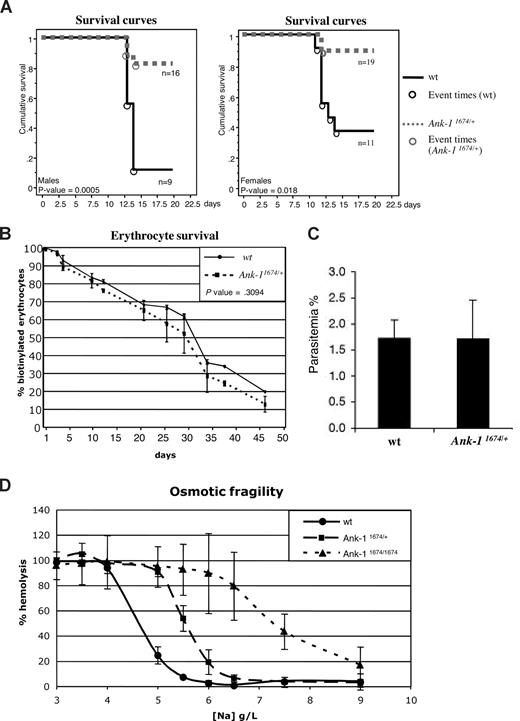
Previous studies in the nb/nb mice revealed a reduced susceptibility to the rodent malarial parasites, P chabaudi and P berghei.28 This was attributed to a reduction in the levels of spectrin in the erythrocyte membrane, as sph/sph mice, which exhibit a spectrin deficiency but express normal levels of Ank-1, are also resistant. As mice carrying a single nb allele also exhibited slightly reduced parasitemia compared with wild-type controls, we examined the susceptibility of mice carrying a single Ank-11674 allele to infection with P chabaudi compared with their wild-type littermates. Homozygous Ank-11674/1674 animals were too ill to be included in the experiment. Male mice are more susceptible than females with respect to peak parasitemia and survival and were therefore injected with a reduced dose of infected red cells.33,34 Despite the erythrocyte membranes from the Ank-11674/+ mice containing wild-type levels of Ank-1 and spectrin (Figure 3D,F), both males (Figure 5A left panel) and females (Figure 5A right panel) showed dramatically different survival curves compared with wild-type controls. No obvious differences were observed in the morphology of infected red cells from control or Ank-11674/+ mice (except the reduced MCV), and in both sets of mice, parasites matured from rings to trophozoites (data not shown).
Ank-11674/+ mice exhibit profound malarial resistance. (A) Kaplan-Meier cumulative survival plots for male and female wt and Ank-11674/+ mice after infection with P chabaudi. P values were determined by log-rank (Mantle-Cox), and less than .05 was considered significant. (B) In vivo red cell survival study in wt and Ank-11674/+ mice. The P value was determined using ANOVA and greater than .05 was considered not significant. (C) In vitro invasion of RBCs from wt and Ank-11674/+ mice with malaria parasites. (D) OF of red cells from 6-week-old wt, Ank-11674/+, and Ank-11674/1674 mice. Error bars represent SD in all figures.
Ank-11674/+ mice exhibit profound malarial resistance. (A) Kaplan-Meier cumulative survival plots for male and female wt and Ank-11674/+ mice after infection with P chabaudi. P values were determined by log-rank (Mantle-Cox), and less than .05 was considered significant. (B) In vivo red cell survival study in wt and Ank-11674/+ mice. The P value was determined using ANOVA and greater than .05 was considered not significant. (C) In vitro invasion of RBCs from wt and Ank-11674/+ mice with malaria parasites. (D) OF of red cells from 6-week-old wt, Ank-11674/+, and Ank-11674/1674 mice. Error bars represent SD in all figures.
Although the cytoskeletal ultrastructure and membrane rigidity of the Ank-11674/+ red cells were identical to the wild-type controls (Figure 3G and Table 2), we postulated that the malarial resistance might be influenced by increased red cell destruction in the Ank-11674/+ mice. To address this, we performed an in vivo red cell survival study on Ank-11674/+ mice and control littermates (Figure 5B). Animals were injected with biotin, and the percentage of labeled erythrocytes measured by FACS analysis. The erythrocyte half-life in Ank-11674/+ mice was not statistically different to the wild-type control. An alternate explanation for the malarial resistance in the Ank-11674/+ mice was that parasite entry into the mutant cells was impaired. To assess this, we performed in vitro invasion assays on red cells from mutant and control mice using purified P berghei schizonts containing fully developed merozoites.35 P berghei was used for these experiments, as P chabaudi cannot be cultured in the merozoite form needed for in vitro RBC invasion. The parasites were incubated with Ank-11674/+ or wild-type RBCs at 37°C for 6 hours, and merozoite invasion was determined by counting the number of ring-stage parasites in Giemsa-stained blood smears prepared from the cultures. No significant difference between control and Ank-11674/+ RBCs was observed (Figure 5C). Resistance to malaria has been noted in HE patients who show an increased osmotic fragility (OF) in addition to altered red cell shape. We therefore examined the OF of red cells from Ank-11674/+, Ank-11674/1674, and wild-type littermates (Figure 5D). As expected the homozygous mutants displayed a marked increase in OF compared with controls. Of interest, increased fragility was also observed with the Ank-11674/+ red cells, suggesting that this may contribute to the increased malarial resistance.
Discussion
In this study, we identify and characterize the first mutant mouse line completely lacking a functional form of the red cell membrane protein, ANK-1. We demonstrate that this protein plays an essential, nonredundant role in erythroid development, as homozygous mutant mice exhibit a reduced red cell count and hematocrit, distorted red cell morphology in utero, and frequently die in the immediate perinatal period. The surviving animals represent an excellent model of severe HS, with active hemolysis, significant extramedullary erythropoiesis, and tissue iron overload. The site of the mutation in these animals resides at the splice acceptor site of exon 41, and although the predicted peptide generated from the mutant transcript would be 194 kDa, no immunoreactive species are detected in red cell membranes on western blot analysis with 2 different ANK-1 antibodies or in bone marrow erythroid progenitors by immunostaining.
The lack of ANK-1 protein in these mice was somewhat unexpected given the position of the mutation and the 5-fold increase in mRNA levels. The nb/nb mouse line carries a mutation in exon 36, but still generates a functional 157-kDa protein,20 which is bound to the membrane in spectrin extracted nb/nb inside out vesicles,37 and contributes to the normal assembly of the spectrin-actin membrane skeletal lattice.26 The predicted peptide in the Ank-11674/1674 mice would contain both the membrane-binding and spectrin-binding domains, as well as 302 amino acids of the regulatory domain. We postulated that the marked increase in Ank-1 mRNA levels might be in response to degradation of the predicted 194-kDa protein, a hypothesis supported by the lack of any immunoreactive species in the homozygous mutant mice. It is unclear as to whether the truncated protein is targeted for degradation by sequences in the residual portion of the regulatory domain, or alternately, by the “junk” 96 residues added on to the protein after the frame shift. The observation that patients with ankyrinSaint-Etienne1 (a nonsense mutation that also truncates in the regulatory domain) have a relatively mild phenotype, and reduced levels of mutant transcript suggests that degradation may occur independently of sequences in this domain.41
Previous studies on the Ank-1 deficient nb/nb mouse suggested that the phenotypic disparity between embryos and adult mice was due to the existence of specific fetal compensatory mechanisms.27 These were postulated to be provided by 2 distinct proteins: a 165-kDa ANK-1–related protein that was only detectable in fetal and adult reticulocytes from nb/nb mice; and a 155-kDa ANK-2–related protein that was present in fetal reticulocytes from mutant and wild-type mice.21 Our data suggest that the lack of a more severe embryonic phenotype in the nb/nb mice relates more to the fact that nb is a hypomorphic allele,20 rather than the presence of fetal compensatory proteins. However, it is also conceivable that differences in the background strains of the nb/nb mice (on a hybrid WBB6F1 background) versus the Ank-11674/1674 mice (BALB/c) could contribute to this effect. Mice homozygous for the Ank-11674 allele displayed severe defects in utero and at birth, with disturbed red cell morphology, reduced red cell count and hematocrit, and high perinatal mortality. The erythrocyte morphology in the embryos was comparable to that observed in older animals, indicating that Ank-1 plays an essential nonredundant role in developmental erythropoiesis. These findings are similar to the uncompensated hemolysis in utero in other mutant mouse lines, including the targeted deletion of band 3,16,17 the neonatal anemia (Nan), and hereditary erythroblastic anemia (hea/hea) strains.42,43
Previous studies in the nb/nb mice had suggested that ankyrin deficiency did not affect the ability of spectrin and other membrane skeletal components to assemble into a highly ordered network, with near normal cytoskeletal architecture described in red cells from these animals.26 Our analysis of the red cell membrane proteins and cytoskeleton in the Ank-11674/1674 mutants again contrasts the differences between the hypomorphic and null alleles. We demonstrated that complete loss of ANK-1 resulted in a total disruption of the uniform 2-dimensional hexagonal array of junctional complexes cross-linked by spectrin tetramers. These were replaced by large bare areas, devoid of organized structure. This appearance resembles, but is more severe than, membrane skeletal preparations from patients with severe HS and spectrin levels of 40% to 50% of normal.40 We estimate the levels of spectrin in the membranes of the Ank-1 null mice to be approximately 25% of the controls. Presumably this residual spectrin relates to the conservation of the protein 4.1R complex,4 with representative components of this complex being unchanged in all 3 mouse lines. In contrast, protein 4.2 and Rh, components of the ankyrin-dependent complex, were markedly decreased in the null mutants. Surprisingly, this was not reflected in the levels of band 3, which were unchanged between the wild-type, heterozygotes and null mutants.
One feature shared by the nb/nb and the Ank-11674 mice is a resistance to infection with the malarial parasite P chabaudi. This is particularly striking in the Ank-11674 line, as the mortality at 15 days of infected male and female mice heterozygous for the mutant allele is 8% compared with 75% for wild-type controls. At this stage, it is unclear as to the mechanism underpinning this profound survival advantage. The initial studies with nb/nb and sph/sph mice suggested that resistance was related to spectrin deficiency. This seems unlikely, as the Ank-11674/+ mice have normal levels of spectrin, and humans with HS have not been shown to display malarial resistance.44-46 We have examined some of the potential mechanisms in the Ank-11674/+ mice that could contribute to the resistance, including altered red cell survival, ultrastructural abnormalities, and impaired parasite entry, using P berghei, to which the nb/nb mice are also resistant. However, the Ank-11674 mice do not differ from wild-type controls in any of these assays. The only differences we have observed relates to a slight increase in the OF of red cells from the Ank-11674 mice. At this time, it is unclear as to whether this is central to the mechanism underpinning the malarial resistance, and further studies may provide important insights into the role of the red cell structural proteins in the parasite life cycle.
The online version of this article contains a data supplement.
The publication costs of this article were defrayed in part by page charge payment. Therefore, and solely to indicate this fact, this article is hereby marked “advertisement” in accordance with 18 USC section 1734.
Acknowledgments
The authors thank Xiuli An and Connie Birkenmeier for the kind gift of reagents; Alana Auden, Sarah King, Loretta Cerruti, and Jason Corbin for excellent technical assistance; and Lan Ta and WEHI Bioservices staff for outstanding animal husbandry.
This work was supported by grants from the National Health and Medical Research Council of Australia (NHMRC; no. 382900); fellowships from the NHMRC to D.J.H., S.M.J.; a fellowship of the Australian Research Council to B.T.K.; and a Program Grant from the National Institutes of Health (Bethesda, MD; PO1 HL53749-03).
National Institutes of Health
Authorship
Contribution: G.R., R.S., V.M., R.J.L., J.C., T.R., K.F., M.M., performed experiments; G.R., B.C., S.J.F., T.R., B.S.C., D.J.C., D.J.H., B.T.K., and S.M.J. devised and supervised experiments and analyzed data; and G.R. and S.M.J. wrote the paper.
Conflict-of-interest disclosure: The authors declare no competing financial interests.
Correspondence: Stephen M. Jane, Rotary Bone Marrow Research Laboratory, c/o Royal Melbourne Hospital Post Office, Grattan St, Parkville 3050, Australia; e-mail: jane@wehi.edu.au.

![Figure 2. Identification of the Ank-11674 allele. (A) Haplotypes of F2 mapping offspring. Markers used and their position on mouse chromosome 8 according to the July 2007 University of California Santa Cruz genome sequence (based on the National Center for Biotechnology Information [NCBI] and Mouse Genome Sequencing Consortium Build 37) are shown. [□] indicates homozygous BALB/c genotype; [], homozygous C57BL/6, and [], heterozygous. The candidate interval for RBC2 was refined to 11 Mb, between D8Mit124 and D8Mit3. Ank-1 lies at 24 085 316-24 260 968 Mb. (B) DNA sequence electropherograms showing the G to C transversion at the splice acceptor site of exon 41 in Ank-11674/+ and Ank-11674/1674 mice. (C) Schematic view of the predicted wild-type and Ank-11674 alleles. (D) Schematic of the wild-type and the predicted Ank-11674 proteins.](https://ash.silverchair-cdn.com/ash/content_public/journal/blood/113/14/10.1182_blood-2008-08-172841/4/m_zh80160933650002.jpeg?Expires=1768008918&Signature=XeL66x0SHRn-FE9XtoCSz7DGAJP6tATVBDzv4egiAUszrLIy1r~ET1nRaoUrokFw7A~vbGhplZMNGdhF8xAfB0KR3eq1-XbesHZ6Qnv0Y2NlRdyMFLegHPCtvB5j4a1j7Pcitb4HVJt5rXDDSTDal4vuUxac1V8F~bIitNLhKBk059Xao5t7sIeDIFP~wMH3YLa6i6vFqt1yGcLb2GWZjZXNvvBAirthqnPGUFVIyYF8QWa997c1mtx6O0QokIDg-u-GXOHVAvzQJ8fyOVAxywX4gX3CPVnADo7uSpFi574mm4qI729d3cobJrAUzng5kXo20dfruU9nqOrQl~Rk-g__&Key-Pair-Id=APKAIE5G5CRDK6RD3PGA)

![Figure 2. Identification of the Ank-11674 allele. (A) Haplotypes of F2 mapping offspring. Markers used and their position on mouse chromosome 8 according to the July 2007 University of California Santa Cruz genome sequence (based on the National Center for Biotechnology Information [NCBI] and Mouse Genome Sequencing Consortium Build 37) are shown. [□] indicates homozygous BALB/c genotype; [], homozygous C57BL/6, and [], heterozygous. The candidate interval for RBC2 was refined to 11 Mb, between D8Mit124 and D8Mit3. Ank-1 lies at 24 085 316-24 260 968 Mb. (B) DNA sequence electropherograms showing the G to C transversion at the splice acceptor site of exon 41 in Ank-11674/+ and Ank-11674/1674 mice. (C) Schematic view of the predicted wild-type and Ank-11674 alleles. (D) Schematic of the wild-type and the predicted Ank-11674 proteins.](https://ash.silverchair-cdn.com/ash/content_public/journal/blood/113/14/10.1182_blood-2008-08-172841/4/m_zh80160933650002.jpeg?Expires=1768008922&Signature=bzqGUrf2Sw7H5INcOhYtUyS2oPduEUzyGVaQ6aEGTZ0kOow1ghRaABwSCCQ6LDi4KbttT8wMK1rYTq4zC5FMEgloTqLSGSsnT5jvnm3wpZVW15rSqo42hsDZTaitAYM4zZDQNbsk2rjxp0j9LS2cR5vQkTRs5DJ92f5a3Pu7z73uWKqLmgdgnud6vmTvXFL~g~KrxbeWohrMnGF4xrLVxOZvi4QdNVeNBc1jyEz6SqlwSMell2cMvsaLFVIaqvNDT~3jfT7twBxEhtlVmY9-3FAuskYaPkMGPtw7HAGjJp00wMAsYWjTUmysMARSOYrc4svHW4y7qSyHjfUt9IQaPw__&Key-Pair-Id=APKAIE5G5CRDK6RD3PGA)
 ], homozygous C57BL/6, and [
 ], heterozygous. The candidate interval for RBC2 was refined to 11 Mb, between D8Mit124 and D8Mit3. Ank-1 lies at 24 085 316-24 260 968 Mb. (B) DNA sequence electropherograms showing the G to C transversion at the splice acceptor site of exon 41 in Ank-11674/+ and Ank-11674/1674 mice. (C) Schematic view of the predicted wild-type and Ank-11674 alleles. (D) Schematic of the wild-type and the predicted Ank-11674 proteins.