Abstract
Sequential administration of DNA methyltransferase (DNMT) inhibitors and histone deacetylase (HDAC) inhibitors has demonstrated clinical efficacy in patients with hematologic malignancies. However, the mechanism behind their clinical efficacy remains controversial. In this study, the methylation dynamics of 4 TSGs (p15INK4B, CDH-1, DAPK-1, and SOCS-1) were studied in sequential bone marrow samples from 30 patients with myelodysplastic syndrome (MDS) or acute myeloid leukemia (AML) who completed a minimum of 4 cycles of therapy with 5-azacytidine and entinostat. Reversal of promoter methylation after therapy was observed in both clinical responders and nonresponders across all genes. There was no association between clinical response and either baseline methylation or methylation reversal in the bone marrow or purified CD34+ population, nor was there an association with change in gene expression. Transient global hypomethylation was observed in samples after treatment but was not associated with clinical response. Induction of histone H3/H4 acetylation and the DNA damage–associated variant histone γ-H2AX was observed in peripheral blood samples across all dose cohorts. In conclusion, methylation reversal of candidate TSGs during cycle 1 of therapy was not predictive of clinical response to combination “epigenetic” therapy. This trial is registered with http://www.clinicaltrials.gov under NCT00101179.
Introduction
The profile of DNA methylation in hematologic malignancies includes genomic global hypomethylation and simultaneous promoter hypermethylation of TSGs.1-6 Aberrant methylation of gene promoters is associated with transcriptional gene silencing and may be relevant to the process of leukemogenesis.2 Reversal of DNA methylation by DNMT inhibitors may constitute rational treatment for hematologic neoplasms.7-10
The azacytosine nucleosides 5-azacytidine (5AC) and 5-aza-2′-deoxycytidine (DAC) are highly active for the treatment of myelodysplastic syndrome.11,12 However, complete responses develop in only 10% to 20% of patients treated with azacytosine nucleoside monotherapy. The mechanism underpinning clinical activity remains uncertain; in vitro, both agents lead to reversal of TSG promoter methylation and in some cases, subsequent re-expression of previously silenced genes.13
HDAC inhibitors also impact expression of epigenetically silenced genes.14,15 Administration of single-agent HDAC inhibitor does not appear to induce the re-expression of densely hypermethylated genes; pretreatment with a DNMT inhibitor followed by administration of an HDAC inhibitor is required for the optimal re-expression of epigenetically silenced genes.16 A phase 1 study tested the sequential administration of 5AC and the first-generation HDAC inhibitor sodium phenylbutyrate (NaPB) in patients with myelodysplastic syndrome (MDS) and acute myeloid leukemia (AML).17 Major clinical responses associated with cytogenetic complete response were seen. Treatment was associated with reversal of CDH-1 or p15INK4B promoter hypermethylation in 6 of 6 clinical responders and 0 of 6 nonresponders during cycle 1 of therapy, suggesting an association between reversal of aberrant gene silencing and clinical response.
Entinostat (MS-275) is a potent, orally available HDAC inhibitor with a long half-life and established antitumor activity in preclinical models. Its administration is characterized by prolonged acetylation of H418 ; however, entinostat demonstrated limited single-agent activity in advanced acute leukemias.18 In an effort to improve the clinical response rate to 5AC, we conducted a phase 1 trial of 5AC plus entinostat. The clinical outcomes of the trial will be reported separately. To determine whether clinical response is associated with reversal of TSGs methylation, we monitored DNA methylation and gene expression changes in the bone marrow and in enriched CD34+ cells during the first cycle of treatment and compared the findings with clinical outcome in 30 patients with MDS/AML. The 4 genes studied have been reported to be frequently methylated in MDS and/or AML and are of potential biologic significance: p15INK4B (CDK inhibitor),17,19 CDH-1 (adhesion molecule),17 SOCS-1 (cytokine signaling),20 and DAPK-1 (apoptosis).20,21 Histone acetylation and expression of the DNA damage marker γ-H2AX in peripheral blood mononuclear cells were also evaluated to examine whether these agents induced DNA damage and chromatin remodeling in vivo.
Methods
Patient samples and treatment plan
Bone marrow and peripheral blood samples were obtained from 30 of a possible 38 patients with MDS, chronic myelomonocytic leukemia, and high-risk AML who were enrolled in a phase 1 study conducted at The Sidney Kimmel Comprehensive Cancer Center at Johns Hopkins Hospital and The Mount Sinai School of Medicine and who were evaluable for response (ie, had completed a minimum of 4 cycles of therapy). The protocol was sponsored by the Cancer Therapy Evaluation Program of the National Cancer Institute. Eligible MDS patients had international prognostic scores (IPSS) of Int-1, Int-2, or higher; lower risk patients were eligible if they had an untransfused hemoglobin less than 8 g/dL (80 g/L); absolute neutrophil count less than 109/L (1000/μL), or platelet count less than 20 × 109/L (20000/μL). Patients with AML were eligible if they had primary refractory disease or relapsed disease, or if they had untreated AML and were older than 60 years of age, had AML arising from an antecedent hematologic disorder (AML with trilineage dysplasia [AML-TLD]), or were unable to receive or refused conventional induction chemotherapy. AML patients were not eligible if their white blood cell count was not stably less than 30 × 109/L (30000/μL) for 2 weeks before registration in absence of cytotoxic drugs including hydroxyurea.
Enrolled patients were treated with sequential administration of 5AC and entinostat. The study was approved by the Institutional Review Boards (IRBs) for each participating institution, and all patients signed informed consent according to Health and Human Services guidelines and the Declaration of Helsinki. Specific IRB-approved informed consent was obtained for the laboratory research use of patient specimens. 5AC was administered subcutaneously for 10 consecutive days in doses of 30, 40, or 50 mg/m2 per day. Entinostat (2, 4, 6, or 8 mg/m2) was administered orally on days 3 and 10 of the 5AC treatment schedule in the course of a 28- to 29-day treatment cycle. Bone marrow aspirates were obtained before treatment (day 0) and on days 15 to 16 and 28 to 29 of the first treatment cycle. Peripheral blood samples were obtained on days 0, 3, 4, 10, 11, 12, 15, and 29 of the first cycle for monitoring of histone acetylation and γ-H2AX expression. Laboratory investigators were blinded to the response of patients to therapy. Clinical responses were assessed using International Working Group 2000 criteria,22 and included complete response (CR), partial response (PR), and hematologic improvement (HI). Patients not completing 4 cycles of therapy were not considered evaluable for clinical response and are not included in this analysis.23
Peripheral blood and bone marrow mononuclear cells were isolated using Ficoll-Hypaque. Mononuclear cells were divided into aliquots for protein, histone extraction, and DNA extraction using standard techniques. Mononuclear cells used for DNA extraction were magnetically labeled with CD34 MicroBeads for the isolation of CD34+ progenitor cells as per the manufacturer's instruction (Miltenyi Biotec Inc). The enrichment of the isolated progenitor cells was quantified by direct fluorescence immunostaining and flow cytometry.
DNA extraction and methylation-specific PCR
DNA was extracted from mononuclear bone marrow cells using the standard phenol-chloroform extraction method. Methylation-specific polymerase chain reaction (MSP) was done as previously described with slight modifications.24 EZ DNA methylation kit (ZymoResearch) was used for the bisulfite treatment of DNA (1 μg) as per the manufacturer's instructions. Polymerase chain reaction (PCR) was performed in 25 μL reaction volume using 3 μL of the bisulfite-treated DNA. Primer sets, product size, annealing temperature, and cycle number are in supplemental Table 1 (available on the Blood website; see the Supplemental Materials link at the top of the online article). The amplicons were resolved on a 6% nondenaturing polyacrylamide gel and poststained with ethidium bromide. Sequential samples from the designated time points from the same patient were run simultaneously on the same gel to assure similar staining conditions.
Genomic DNA bisulfite sequencing of p15INK4B
Genomic bisulfite sequencing (BSS) for the p15INK4b promoter was performed in selected patient samples as previously described without using nested PCR.17 Primer sets, product size, annealing temperature, and cycle number are in supplemental Table 1. The PCR product was cloned in TOPO TA cloning Kit (Invitrogen) followed by DNA sequencing.
Quantification of LINE-1 methylation by DNA pyrosequencing
Long interspersed nuclear elements (LINE-1), noncoding DNA repetitive elements, have been used as a surrogate marker for global DNA methylation. Methylation analysis of LINE-1 was performed by bisulfite-PCR pyrosequencing assay as previously described.25 Briefly, bisulfite-treated DNA PCR was performed using the HotMaster Mix (Eppendorf) consisting of HotMaster DNA polymerase and HotMaster Taq Buffer (45 mM KCl, 2.5 mM Mg2+, 200 μM dNTP) in the presence of the forward primer: 5′-TTTTGAGTTAGGTGTGGGATATA-3′ and the biotinylated reverse primer: biotin-AAAATCAAAAAATTC CCT TTC-3′. The PCR product was bound to streptavidin sepharose HP (Amersham Biosciences) and the sepharose beads containing the immobilized PCR product were purified, washed, denatured using 0.2 M NaOH solution, and washed again. Pyrosequencing was performed using the PSQ HS 96 pyrosequencing system (Biotage AB) and the pyrosequencing primer 5′-AGTTAGGTGTGG GATATAGT-3′. Methylation quantification was performed using the provided software.
Microarray analysis
Microarray analysis was performed on RNA isolated from CD34+ cells from the first 18 patients who had sequential samples available. Cells were lysed in chaotropic buffer (RLT buffer; QIAGEN) and snap-frozen at −80°C. RNA was extracted using a modification of the RNeasy protocol (QIAGEN). RNA was extracted as described, with the addition that all incubations were carried out for 5 minutes, and RNA was eluted with 56°C RNase-free H2O. Concentration and purity were determined by Nanodrop spectroscopy. mRNA was subjected to 2 rounds of linear amplification before hybridization to Affymetrix HGU133A gene chips. Twelve pairs of day-0 and day-15 specimens passed quality control for hybridization and RNA integrity and were analyzed using ArrayAssist software (Stratagene). A list of differentially regulated genes was created after GC-RMA normalization by t test paired using a 1.5-fold cutoff with P value less than .005. Hierarchic clustering was performed by the Pearson centered algorithm. All microarray data have been deposited with Gene Expression Omnibus (GEO) under accession number GSE16625.26
Histone acetylation
Histone proteins H3 and H4 were extracted and quantified as previously described.17 Fifty micrograms of protein was separated by 15% sodium dodecyl sulfate–polyacrylamide gel electrophoresis before Western blot analysis. Primary rabbit polyclonal antibodies to human acetylated histone H3 and H4 and nonacetylated H2A (Upstate Biotechnology) were used, followed by horseradish peroxidase–conjugated secondary antibodies and visualization using enhanced chemiluminescence (GE Healthcare). The nonacetylated H2A band served as a control for protein loading. Gels were scanned and band density was quantified (UN-Scan-It; Silk Scientific).
Protein extraction and γ-H2Ax quantification
Cells were lysed in radioimmunoprecipitation assay lysis buffer containing EDTA-free protease inhibitor cocktail for 30 minutes. Lysates were collected by centrifugation at 3000g for 15 minutes. Protein concentration was determined using a bicinchoninic acid assay kit (Pierce). Proteins were separated by 15% sodium dodecyl sulfate–polyacrylamide gel electrophoresis and immunoblotted using monoclonal mouse antibody for γ-H2AX (1:500; Upstate Biotechnology). The immunoreactive proteins were detected using ECL Western blotting analysis system (GE Healthcare). Signals were quantified by UN-Scan-it software (Silk Scientific).
Statistical analysis
Binary variables, such as the presence of methylation, were summarized with counts and percentages. Comparisons of binary outcomes between responders and nonresponders were made using Fisher exact test. Continuous variables, such as global DNA hypomethylation, were summarized with means and standard deviations. Comparisons between time points (LINE-1 assay) were done using the Wilcoxon signed rank test. The analysis of methylation reversal at days 15 and 29 was done separately due to the existence of missing samples. For each time point, the number and percentage of individuals with baseline methylation who showed a reversal were calculated for each candidate TSG. Contour plots were used to show the interaction between H4 and γ-H2AX in peripheral blood and dose combination. Quadratic models were used to determine whether there is a significant interaction between the 2 drugs and these outcomes.
Results
Patients
Table 1 enumerates clinical characteristics of the 30 patients included in this analysis. Diagnoses included MDS (14 patients), chronic myelomonocytic leukemia (4 patients), relapsed AML (1 patient), refractory AML (2 patients), and AML-fTLD (9 patients). Median age was 64 years (range, 35-84 years). The majority of patients were male (70%) and did not have previous chemotherapy (83%). Adverse cytogenetic abnormalities were detected in 16 patients. Clinical responses were observed in 14 patients (46%; 3 CR, 4 PR, and 7 HI). The time to best response for 2 CR patients was seen at 4 cycles, and at 9 cycles for 1 patient reaching a CR.
Reversal of methylation of candidate TSGs in CD34− cells during cycle 1 of therapy is not associated with clinical response
During the first cycle of treatment with 5AC and entinostat, DNA from bone marrow CD34+ and CD34− cells from the 30 patients who received at least 4 cycles of therapy was analyzed by MSP for reversal of methylation of 4 candidate TSGs: p15INK4B, CDH-1, DAPK-1, and SOCS-1. MSP analysis was performed on DNA isolated before treatment (day 0) and on days 15 to 16 and 28 to 29 after therapy. Samples from one patient were lost in preparation after purifying CD34+ cells. Therefore, MSP analysis was performed on the CD34− bone marrow cells of 29 patients.
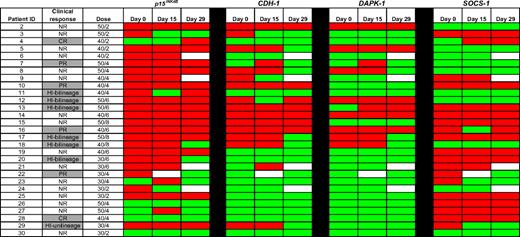
TSGs were frequently methylated at baseline (day 0): p15INK4B (23/29; 79%), CDH-1 (14/29; 48%), DAPK-1 (8/29; 28%), and SOCS-1 (18/29; 62%; Figure 1). Methylation of one or more genes was observed in 27 (93%) patients, 2 or more genes in 19 (66%) patients, 3 or more genes in 14 (48%) patients, and 4 genes in 3 (10%) patients. Baseline methylation of any of the 4 genes was not associated with clinical response to 5AC plus entinostat. Methylation reversal at 1 of the 4 genes was represented in every dose cohort by at least one patient. For each of the genes studied, however, reversal of methylation on either day 15 or 29 was not associated with clinical hematologic response.
Methylation status of candidate TSGs in CD34− cells from bone marrow DNA. Promoter methylation of p15INK4B, CDH-1, DAPK-1, and SOCS-1 was monitored by MSP in 29 patients before treatment (day 0), on days 15 to 16, and on days 28 to 29 of the first cycle of therapy. Red color indicates methylated status, green color indicates unmethylated status, and white color indicates sample was unavailable. No statistically significant association between reversal of candidate TSG methylation status and clinical response to combination therapy with 5AC and entinostat was detected. CR indicates complete response; PR, partial response; HI, hematologic improvement; and NR, no response.
Methylation status of candidate TSGs in CD34− cells from bone marrow DNA. Promoter methylation of p15INK4B, CDH-1, DAPK-1, and SOCS-1 was monitored by MSP in 29 patients before treatment (day 0), on days 15 to 16, and on days 28 to 29 of the first cycle of therapy. Red color indicates methylated status, green color indicates unmethylated status, and white color indicates sample was unavailable. No statistically significant association between reversal of candidate TSG methylation status and clinical response to combination therapy with 5AC and entinostat was detected. CR indicates complete response; PR, partial response; HI, hematologic improvement; and NR, no response.
A total of 23 individuals had methylation of p15INK4B before treatment. Of these, day-15 methylation data were available in 22 patients: 1 of 10 responders and 2 of 12 nonresponders showed methylation reversal. Of the 19 patients in whom methylation data were available at day 29, 3 of 11 responders and 1 of 8 nonresponders showed reversal of p15INK4B methylation (Figure 1). Two clinical responders did not have p15INK4B methylated at baseline (patients 4, 28) and therefore were not informative for methylation reversal.
Fourteen individuals had CDH-1 methylation before treatment; 1 of 7 responders and 2 of 7 of the clinical nonresponders developed reversal of methylation reversal at day 15. Of the 13 patients in whom methylation data were available at day 29, 3 of 7 responders and 3 of 6 nonresponders showed reversal of CDH-1 methylation. Six clinical responders were not methylated at baseline for CDH-1.
DAPK-1 was methylated in 8 patients before treatment; 0 of 4 responders and 0 of 4 nonresponders showed methylation reversal at day 15. At 29 days, 2 of 4 responders and 1 of 4 nonresponders demonstrated reversal of DAPK-1 methylation. Eight clinical responders were not methylated for DAPK-1 at baseline.
SOCS-1 was methylated in 18 patients. Of the 17 patients with methylation data on day 15, 2 of 7 responders and 1 of 10 nonresponders demonstrated methylation reversal. Of the 16 patients with methylation data on day 29, 2 of 8 responders and 1 of 8 nonresponders demonstrated methylation reversal. Five clinical responders were not methylated for SOCS-1 at baseline (patients 4, 7,11,12, and 18), and 1 clinical responder (patient 22) was not evaluable on day 15 (lost sample).
Genomic DNA BSS of p15INK4B during cycle 1 confirms lack of association of DNA methylation reversal and clinical response
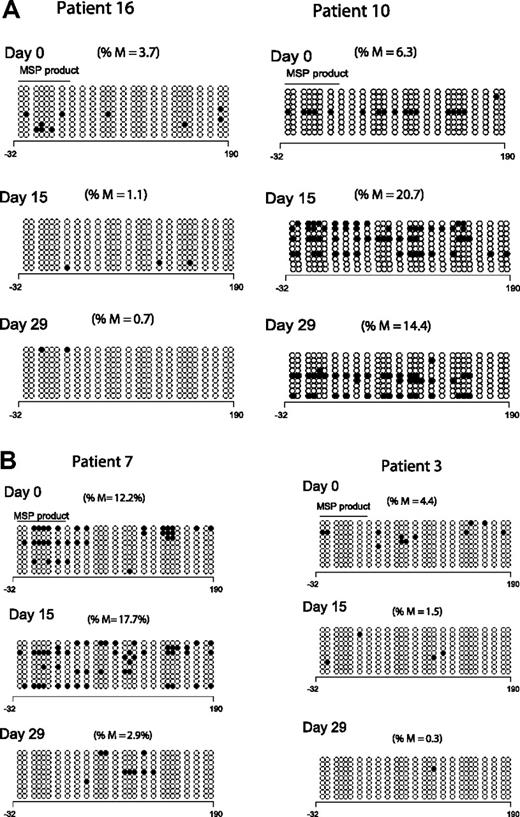
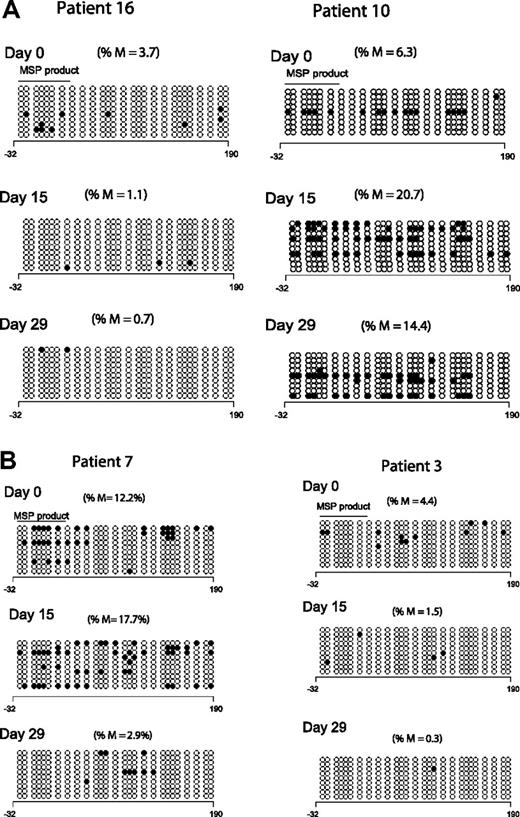
To validate the results of the MSP analysis, we reanalyzed p15INK4B methylation by DNA BSS in 9 patients at 3 time points; 8 of these patients demonstrated p15INK4B methylation by MSP. Low-level and heterogeneous promoter methylation of p15INK4B was detected in only 5 patients by BSS (cutoff limit 3% based on p15INK4B methylation in mononuclear normal lymphocytes27 ). Of these 5 patients, 4 had day-15 samples available: 1 of 3 responders and 1 of 1 clinical nonresponders demonstrated reversal of methylation by DNA BSS. At day 29, 2 of 4 responders and 1 of 1 nonresponders demonstrated reversal of p15INK4B methylation. Figure 2A depicts the BSS methylation profile of 2 clinical responders; one patient reversed methylation on both days 15 and 29 (left panel) and the other did not (right panel). Figure 2B depicts the BSS methylation profile of a clinical responder and a nonresponder; both patients reversed methylation at day 29 but only patient 3 (clinical nonresponder) demonstrated methylation reversal at day 15 (right panel).
Clinical response is not uniformly associated with p15INK4B methylation reversal. (A) Methylation reversal in clinical responders. DNA BSS of 27 CpG sites in the promoter region of p15INK4B in 2 clinical responders (patients 10 and 16). Patient 16 showed reversal of methylation at days 15 and 29 (left panel), whereas patient 10 (right panel) did not show methylation reversal by BSS. (B) Reversal of methylation of p15INK4B in clinical nonresponders. DNA BSS of 27 CpG sites in the promoter region of p15INK4B on days 0, 15, and 29 of therapy showed methylation reversal in both clinical responder and nonresponder (patients 7 and 3, respectively). Patient 7 showed methylation reversal at day 29 only. ∘ indicates unmethylated CpGs and • indicates methylated CpGs. The solid line labeled MSP product marks the start and end position of the CG sites of the MSP amplicon. The numbers below the horizontal bar describe the position of the CpGs relative to the transcription start site (+1). %M indicates percentage methylation calculated by dividing the number of • by the number of ∘ (270) and multiplied by 100.
Clinical response is not uniformly associated with p15INK4B methylation reversal. (A) Methylation reversal in clinical responders. DNA BSS of 27 CpG sites in the promoter region of p15INK4B in 2 clinical responders (patients 10 and 16). Patient 16 showed reversal of methylation at days 15 and 29 (left panel), whereas patient 10 (right panel) did not show methylation reversal by BSS. (B) Reversal of methylation of p15INK4B in clinical nonresponders. DNA BSS of 27 CpG sites in the promoter region of p15INK4B on days 0, 15, and 29 of therapy showed methylation reversal in both clinical responder and nonresponder (patients 7 and 3, respectively). Patient 7 showed methylation reversal at day 29 only. ∘ indicates unmethylated CpGs and • indicates methylated CpGs. The solid line labeled MSP product marks the start and end position of the CG sites of the MSP amplicon. The numbers below the horizontal bar describe the position of the CpGs relative to the transcription start site (+1). %M indicates percentage methylation calculated by dividing the number of • by the number of ∘ (270) and multiplied by 100.
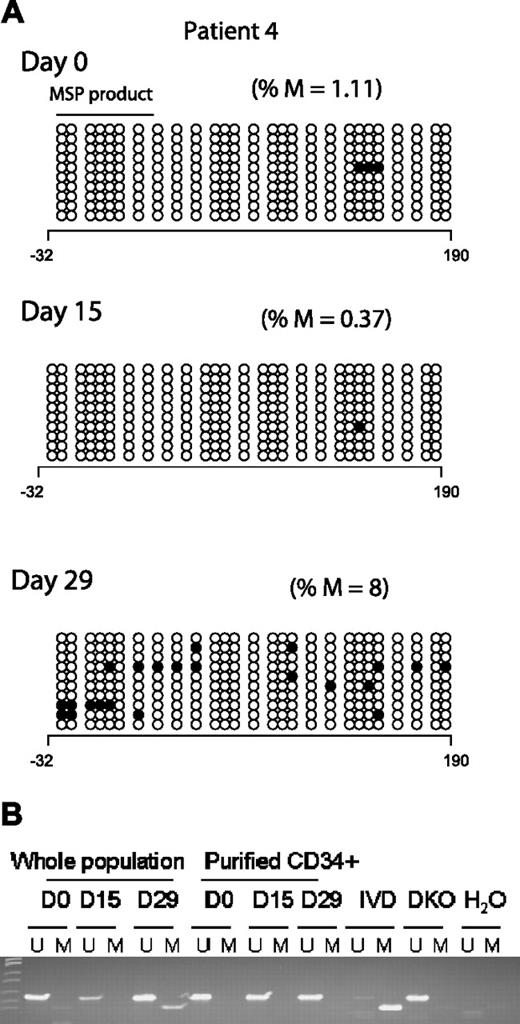
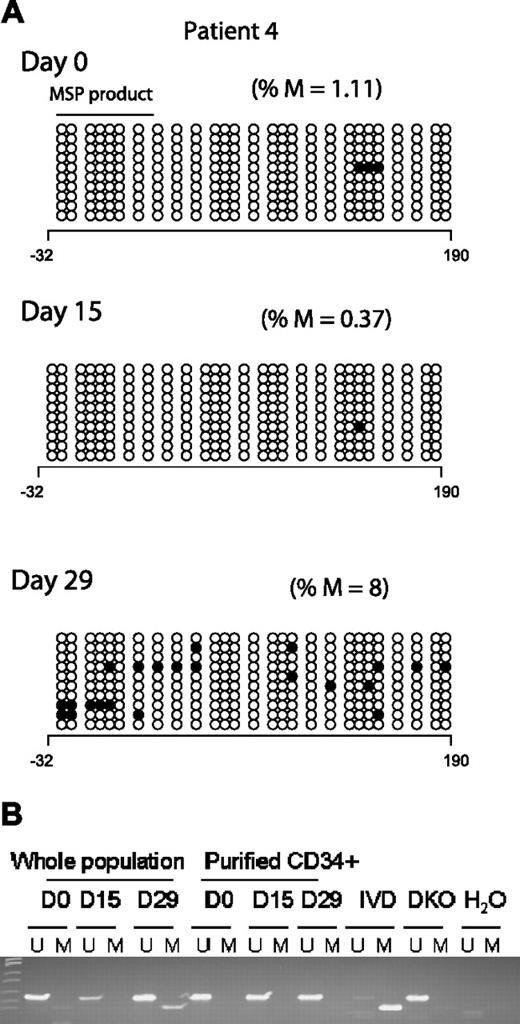
Two clinical responders (Figures 3A and 2A; patients 4 and 10, respectively) demonstrated an increase in p15INK4B promoter methylation by BSS analysis after treatment. Concordantly, MSP detected methylated epialleles for both p15INK4B (Figure 3B) and SOCS-1 at day 15 or 29 in patient 4 (Figure 1), who was unmethylated for both genes at baseline.
p15INK4B promoter methylation in a complete responder (patient 4). (A) Genomic DNA BSS of 10 clones at 3 different time points (days 0, 15, and 29) during the first cycle of treatment for patient 4. The numbers below the horizontal bar describe the position of the CpGs relative to the transcription start site (+1). Notations as per Figure 2. (B) MSP gel for the DNA from CD34− and enriched CD34+ cells at 3 different time points day 0 (d0), days 15 to 16 (d15), and days 28 to 29 (d29) of therapy. U indicates unmethylated lane; and M, methylated lane. In vitro methylated (IVD) DNA was used as a positive control for methylated status, HCT 116 double knockout (DKO) for DNMT1 and DNMT3b was used as a positive control for unmethylated status, and water (H2O) was used as a negative control for the PCR reaction.
p15INK4B promoter methylation in a complete responder (patient 4). (A) Genomic DNA BSS of 10 clones at 3 different time points (days 0, 15, and 29) during the first cycle of treatment for patient 4. The numbers below the horizontal bar describe the position of the CpGs relative to the transcription start site (+1). Notations as per Figure 2. (B) MSP gel for the DNA from CD34− and enriched CD34+ cells at 3 different time points day 0 (d0), days 15 to 16 (d15), and days 28 to 29 (d29) of therapy. U indicates unmethylated lane; and M, methylated lane. In vitro methylated (IVD) DNA was used as a positive control for methylated status, HCT 116 double knockout (DKO) for DNMT1 and DNMT3b was used as a positive control for unmethylated status, and water (H2O) was used as a negative control for the PCR reaction.
Reversal of DNA methylation of candidate TSGs in CD34+ cells during cycle 1 is not associated with clinical response
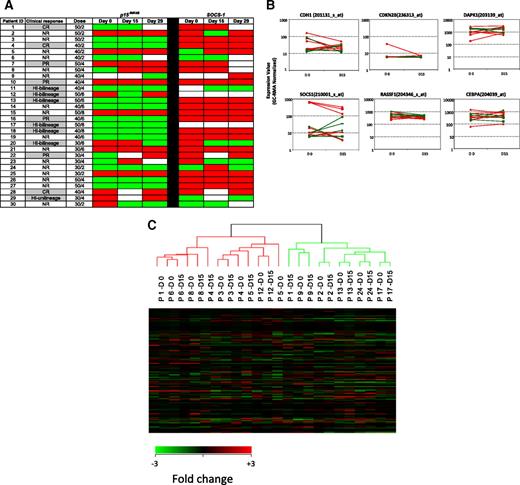
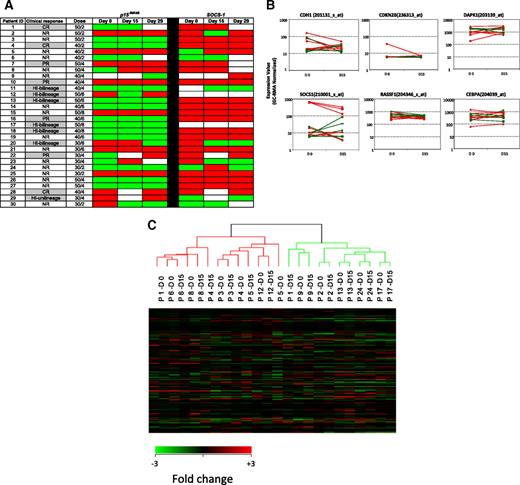
Maintenance of epigenetic signatures during differentiation has not been extensively evaluated. Because MDS bone marrows contain a mixture of primitive and differentiated cells, we further monitored changes in methylation of p15INK4B and SOCS-1 in enriched CD34+ cells using MSP (Figure 4A). Before treatment, p15INK4B was methylated in 12 (41%) of 29 patients and SOCS-1, in 21 (81%) of 26 patients (day-0 samples were not available for p15INK4B analysis in 1 patient [patient 9] and not available for SOCS-1 analysis in 4 patients [patients 9, 11, 12, and 17]). Among clinical responders with baseline methylation of p15INK4B, 1 of 4 reversed methylation at day 15 and 1 of 6 reversed methylation at day 29 (patients 12 and 20, respectively). One of 6 clinical nonresponders reversed p15INK4B methylation with treatment at days 15 and 29 (patient 30).
Methylation status and gene expression of candidate TSGs in purified CD34+ hematopoietic progenitors. (A) Promoter methylation of p15INK4B and SOCS-1 was monitored by MSP in CD34+ cells from 30 patients before treatment (day 0) and on days 15 and 29 of the first cycle of therapy. There is no association of reversal of candidate TSG methylation status with clinical response to combination therapy with 5AC and entinostat. Red color indicates methylated status, green color indicates unmethylated status, and white color indicates sample was unavailable. Notations as per Figure 1. (B) Plots (log scale) of normalized gene expression in evaluable patients before and after 1 cycle of 5AC/entinostat therapy in TSG genes tested for methylation status as well as 2 other genes (RASSF1 and CEBPA) frequently hypermethylated in MDS. Green indicates clinical responder; and red, clinical nonresponder. (C) Hierarchical clustering of individual patients (n = 12) at day 0 and day 15.
Methylation status and gene expression of candidate TSGs in purified CD34+ hematopoietic progenitors. (A) Promoter methylation of p15INK4B and SOCS-1 was monitored by MSP in CD34+ cells from 30 patients before treatment (day 0) and on days 15 and 29 of the first cycle of therapy. There is no association of reversal of candidate TSG methylation status with clinical response to combination therapy with 5AC and entinostat. Red color indicates methylated status, green color indicates unmethylated status, and white color indicates sample was unavailable. Notations as per Figure 1. (B) Plots (log scale) of normalized gene expression in evaluable patients before and after 1 cycle of 5AC/entinostat therapy in TSG genes tested for methylation status as well as 2 other genes (RASSF1 and CEBPA) frequently hypermethylated in MDS. Green indicates clinical responder; and red, clinical nonresponder. (C) Hierarchical clustering of individual patients (n = 12) at day 0 and day 15.
Among the 10 clinical responders with SOCS-1 methylation at baseline, only 1 (12.5%) of 8 reversed methylation at day 15 and 1 of 8 reversed at day 29 of therapy (day-15 and day-29 samples were not available for 2 patients). In addition, 2 of 11 clinical nonresponders reversed SOCS-1 methylation at day 15 and 1 (10%) of 10 at day 29 of therapy (Figure 4A).
5AC and entinostat administration induces minimal changes in overall gene expression during cycle 1 of therapy in CD34+ cells
The impact of overlapping schedule of 5AC and entinostat on gene expression in MDS/AML patients is not clear. Gene expression microarrays were used to investigate the effect of the combined therapy on gene expression and to seek associations with the methylation data of the studied genes. Expression profiling was performed at days 0 and 15 for 18 patients. Twelve pairs of specimens met highest quality control standards (good ratio of 5′ to 3′ probe set calls). There was no difference in the basal expression of the 4 candidate TSGs between the clinical responders and nonresponders as determined by expression microarray at the start of therapy. Furthermore, no consistent changes in expression of these genes was seen after therapy (days 15 and 29) in clinical responders or nonresponders during cycle 1 (Figure 4B). In addition, the direction of gene expression change was not predictive of clinical response in this subset of patients.
In a supervised analysis, 59 probe sets (representing 56 genes) were differentially expressed in the patients before and after treatment using a 1.5-fold change cutoff with P value less than .005. These genes could be clustered into several functional groups; these included changes in genes involved in ubiquitylation, protein phosphorylation, and transcriptional regulation (supplemental Table 2). Expression of p21WAF1/CIP1, a gene induced in vivo by HDAC inhibitors, was not affected. The number of genes up- and down-regulated after treatment with 5AC and entinostat was similar. Expression of the 4 candidate TSGs as well as 2 other genes frequently methylated and suppressed in MDS, RASSF1 and CEBPα, was examined in evaluable samples, which included 5 responders. Expression of CDKN2B (p15INK4B) was very low in all samples tested and without significant change after 2 weeks of therapy. SOCS-1 levels were somewhat higher and tended to be lower at day 15 compared with day 0. CDH-1 levels were readily detected in 3 patients and low in the remaining 9. There was no association between baseline level or posttherapy levels and response. DAPK-1 was readily detected in all specimens tested and there was no consistent change in expression after therapy. CEBPα levels also did not significantly or consistently change after one cycle of therapy. In addition, unsupervised hierarchic clustering showed that pretreatment and posttreatment specimens at days 0 and 15 for individualized patients clustered with themselves and did not separate into groups based upon pretreatment or posttreatment status (Figure 4C).
5AC and entinostat administration induces transient and reversible global DNA hypomethylation
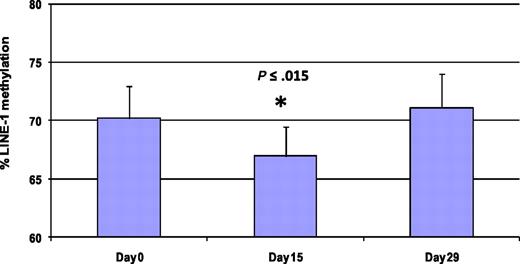
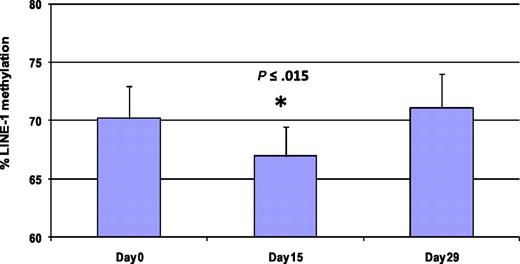
Methylation of LINE-1 noncoding elements has been used as a surrogate for global DNA methylation.28 Five patients were analyzed by LINE-1 pyrosequencing at 3 different time points (days 0, 15, and 29) to monitor global DNA methylation during therapy (Figure 5 and supplemental Figure 1). Average LINE-1 methylation decreased by 3.3% plus or minus 1.8% on day 15 compared with baseline (P < .015). LINE-1 methylation was restored to baseline in all patient samples on day 29.
Treatment with 5AC and entinostat induces transient and reversible global DNA hypomethylation. LINE-1 methylation reversal was monitored by DNA pyrosequencing in 5 patients from different 5AC dose cohorts on days 0, 15, and 29 during the first cycle of treatment. The bar graph demonstrates the average of LINE-1 methylation from the 5 patients at the designated time points. The values represent the mean of duplicate runs ± SD. * indicates significant difference from day 0 at P ≤ .015.
Treatment with 5AC and entinostat induces transient and reversible global DNA hypomethylation. LINE-1 methylation reversal was monitored by DNA pyrosequencing in 5 patients from different 5AC dose cohorts on days 0, 15, and 29 during the first cycle of treatment. The bar graph demonstrates the average of LINE-1 methylation from the 5 patients at the designated time points. The values represent the mean of duplicate runs ± SD. * indicates significant difference from day 0 at P ≤ .015.
Sequential 5AC and entinostat administration in MDS/AML patients induces global histone acetylation and DNA damage
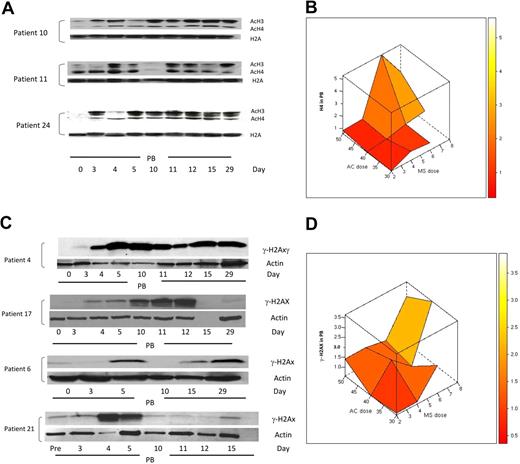
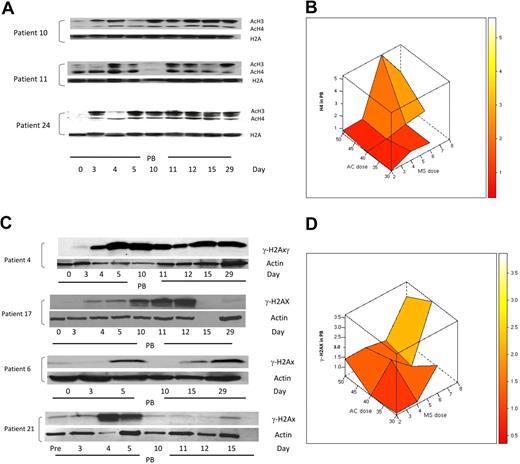
Based on previous reports of increased histone acetylation after treatment with 5AC and NaPB,17 H3 and H4 acetylation was monitored in peripheral blood mononuclear cells in 25 clinically evaluable patients by Western blotting on days 0, 3, 4, 5, 10, 11, 12, 15, and 29 of the first treatment cycle. H3/H4 acetylation increased 1.5-fold or more in 23 (92%) of 25 patients at different time points in both clinical responders and nonresponders. Consistent with previous findings,17 9 (39%) of 23 patients demonstrated an increase in H3 or H4 acetylation on day 3 after 2 days of 5AC treatment, before the administration of the HDAC inhibitor. These 9 patients (5 clinical responders and 4 nonresponders) represented all three 5AC dose cohorts in the study (1 patient in the 50-mg/m2 cohort, 5 patients in the 40-mg/m2 cohort, and 3 patients in the 30-mg/m2 cohort). Increase in histone acetylation was detected on day 29 of the first cycle of therapy in 5 (22%) of 23 patients, consistent with a previous report.18 Figure 6A shows 3 representative patient samples demonstrating sustained increase in H3 or H4 acetylation (day 29) and increase in H3 or H4 acetylation on day 3 after 5AC (patients 10 and 24). The maximal increase in H4 acetylation was observed with the sequential administration of 5AC (40 mg/m2) and entinostat (6 mg; Figure 6B), suggesting pharmacodynamic interaction of these 2 agents in induction of H4 acetylation. Although the power to detect an interaction term with a small sample size is low, there does appear to be evidence of a possible interaction between the 2 agents to induce H4 acetylation (P = .085).
Changes in H3/H4 acetylation and the DNA damage marker γ-H2AX in peripheral blood (PB) during therapy with 5AC and entinostat. (A) Western blotting of H3/H4 acetylation results from 3 representative patient samples (patients 10, 11, and 24) during the first cycle of treatment. H2A was used as a loading control. AcH3 and AcH4 indicate acetylated H3 and acetylated H4, respectively. Note that day-3 samples were procured before any administration of the HDAC inhibitor. (B) Three-dimensional representation of interaction between doses of 5AC and entinostat (denoted MS) administered and median maximal H4 acetylation in peripheral blood mononuclear cells. The median values of the intensity index of acetylated H4 after normalization with nonacetylated H2A (loading control) are shown. The maximal increase in H4 acetylation was observed with the sequential administration of 5AC (40 and 50 mg/m2) and entinostat (6 and 8 mg). (C) DNA damage induction in both clinical responders and nonresponders during the first cycle of treatment. Western blotting showing up-regulation of γ-H2AX in 2 clinical responders (patients 4 and 17) and 2 clinical nonresponders (patients 6 and 21). Actin was used as a loading control. Day-15 (empty lane) and day-29 samples were not available for patients 17 and 21, respectively. Day-4, -11, and -12 samples were not available for patient 6. (D) Three-dimensional representation of relationship between doses of 5AC and entinostat (denoted MS) administered and median maximal γ-H2AX induction in peripheral blood mononuclear cells. The median values of the intensity index of γ-H2AX after normalization with actin (loading control) are shown.
Changes in H3/H4 acetylation and the DNA damage marker γ-H2AX in peripheral blood (PB) during therapy with 5AC and entinostat. (A) Western blotting of H3/H4 acetylation results from 3 representative patient samples (patients 10, 11, and 24) during the first cycle of treatment. H2A was used as a loading control. AcH3 and AcH4 indicate acetylated H3 and acetylated H4, respectively. Note that day-3 samples were procured before any administration of the HDAC inhibitor. (B) Three-dimensional representation of interaction between doses of 5AC and entinostat (denoted MS) administered and median maximal H4 acetylation in peripheral blood mononuclear cells. The median values of the intensity index of acetylated H4 after normalization with nonacetylated H2A (loading control) are shown. The maximal increase in H4 acetylation was observed with the sequential administration of 5AC (40 and 50 mg/m2) and entinostat (6 and 8 mg). (C) DNA damage induction in both clinical responders and nonresponders during the first cycle of treatment. Western blotting showing up-regulation of γ-H2AX in 2 clinical responders (patients 4 and 17) and 2 clinical nonresponders (patients 6 and 21). Actin was used as a loading control. Day-15 (empty lane) and day-29 samples were not available for patients 17 and 21, respectively. Day-4, -11, and -12 samples were not available for patient 6. (D) Three-dimensional representation of relationship between doses of 5AC and entinostat (denoted MS) administered and median maximal γ-H2AX induction in peripheral blood mononuclear cells. The median values of the intensity index of γ-H2AX after normalization with actin (loading control) are shown.
Administration of 5AC and DAC in vitro has recently been shown to induce DNA damage.29,30 To assess the effect of sequential 5AC and entinostat on DNA damage induction in vivo, we monitored the expression of γ-H2AX in peripheral blood mononuclear cells in 23 clinically evaluable patients by Western blot on days 0, 3, 4, 5, 10, 11, 12, 15, and 29 of the first treatment cycle. A 1.5-fold or more increase in γ-H2AX was observed in 13 (57%) of 23 patients across the designated time points. Increased γ-H2AX expression was observed across all dose cohorts, even with the lowest doses of 5AC (30 mg/m2) and entinostat (2 mg/m2). This increase in γ-H2AX was seen in clinical responders (5/13; 38%) as well as nonresponders (8/13; 62%). Figure 6C shows DNA damage induction in 2 clinical responders and 2 nonresponders as measured by γ-H2AX up-regulation at designated time points. γ-H2AX up-regulation was observed in 3 (23%) of 13 patients on day 3 before entinostat administration (Figure 6C, patient 4) and was up-regulated in all 13 patients after entinostat administration either on days 4 to 5 or days 10 to 12. Figure 6D depicts the interactive effect of coadministering 5AC and entinostat on γ-H2AX up-regulation. Although up-regulation of γ-H2AX was observed after coadministering low doses of entinostat (2 mg), the maximum increase in γ-H2AX expression appears to increase with administering higher doses of 5AC (40 and 50 mg/m2) and entinostat (6-8 mg/m2), consistent with previous in vitro findings. There was no evidence of an interaction (P = .742).
Discussion
Despite the clinical efficacy of azacytosine nucleoside analogues, the molecular mechanism underlying their clinical activity is unknown. The relationship between reversal of methylation of p15INK4B in response to epigenetic modifiers in myeloid leukemias and clinical response has been controversial. A previous study showed that methylation reversal during cycle 1 predicted clinical response in MDS/AML patients treated with 5AC and NaPB.17 Daskalakis et al19 showed that DAC administration was associated with decrease in bone marrow p15INK4B methylation; this was not required for clinical response but appeared to be associated with complete response. Other reports suggest that clinical response to DAC therapy in a variety of hematologic malignancies was not associated with either baseline p15INK4B methylation or methylation reversal.31,32 Responders to DAC appeared to have a higher increment in p15INK4B expression after therapy compared with nonresponders; however the biologic significance of the small amount of mRNA detected remains unclear.33 In addition, reversal of p15INK4B methylation did not correlate with clinical response in 5AC-treated MDS/AML patients.34 Furthermore, Garcia-Manero et al35 demonstrated that the percentage of change of p15INK4B methylation and gene reactivation was similar for clinical responders and nonresponders in a phase 1/2 study combining DAC and the HDAC inhibitor valproic acid in leukemia patients.
In the present study, early changes in local promoter methylation of 4 candidate TSGs (p15INK4B, CDH-1, SOCS-1, and DAPK-1) in bone marrow DNA of 30 MDS/AML patients did not predict clinical response after 5AC and entinostat combination therapy. Furthermore, no consistent change in expression was found in these genes after therapy. The sequence of administration of DNMT and HDAC inhibitors may affect the kinetics of reversal of methylation. In our previous study of 5AC and NaPB, the HDAC inhibitor was administered after completion of up to 14 days of 5AC administration. In contrast, in the current study, entinostat was administered on the third and tenth days of 5AC, overlapping the DNMT inhibitor. A potent HDAC inhibitor, entinostat induces cell cycle arrest.36 In theory, concomitant administration of the HDAC inhibitor with 5AC could inhibit incorporation of the nucleoside into DNA, impairing its ability to inactivate DNMT and reverse methylation. However, LINE-1 pyrosequencing confirmed that a global decrease in methylation occurred after the 5AC entinostat combination to an extent similar to that observed in a combination study of 5AC and valproic acid.37 In addition, it is possible that the number of clinical responders without baseline methylation masked potential associations between reversal of methylation and clinical response.
Although 5AC/entinostat led to global decrease in methylation, this did not lead to significant shifts of gene expression after 2 weeks of therapy. This is not surprising since previous reports showed that changes in genes expressed at low levels may be below the sensitivity of microarray detection.38 However, a limited set of genes was consistently regulated after 5AC/entinostat. These genes were found in several functional categories such as protein phosphorylation and protein modification/degradation. Whether these changes are due primarily to the action of the drugs on gene promoters or represent a reaction to cellular stress induced by the agents is uncertain. It remains possible that repeated cycles of DNMT and HDAC inhibitor therapy could lead to more consistent changes in gene expression due to action on specific promoters. Analysis of specific gene methylation and expression associations using more sensitive platforms such as long-oligonucleotide microarrays and whole genomic assay of promoters for methylation would be needed to confirm or refute the notion that combined DNMT/HDAC inhibitor therapy functions through demethylation and derepression of specific sets of genes. Furthermore, clinical responses with demethylating therapy most often occurs after 4 to 6 cycles of therapy (4 to 6 months), and thus early gene expression changes may be subtle or occur only in a subset of early progenitors within the CD34+ cells. It is possible that these changes may not have been detected in the first cycle because of the sensitivity of the assay and the mixed cell population.
This is the third report noting the in vivo induction of histone acetylation in response to 5AC or DAC alone.17,39 In the current study, several patients demonstrated induction of histone acetylation after 2 doses of 5AC at doses as low as 30 mg/m2. 5AC does not inhibit HDAC1 in vitro (A.J. and S.G., unpublished data, July 2005). However, chromatin modifications have been noted to be an early response to irradiation-induced DNA damage after ATM phosphorylation.40 We and others have demonstrated induction of the double-stranded DNA break–associated variant histone γ-H2AX in vitro in response to DAC.29,30 We therefore monitored induction of this DNA damage marker in patients receiving sequential 5AC and entinostat. γ-H2AX expression was induced in peripheral blood mononuclear cells after treatment with 5AC both alone and combined with entinostat. Evaluation of pharmacodynamic response according to dosing of the 2 drugs revealed an interaction with histone acetylation. However, as with methylation reversal, it is not clear whether DNA damage and repair is an underlying mechanism of clinical response since it was observed in only 38% of clinical responders and in an even higher fraction of nonresponders. A potential cytotoxic effect of these drugs on chemosensitive cells with unmethylated alleles could lead to enrichment of the methylated, apoptosis-resistant clones. This could explain the apparently paradoxical emergence of methylated epialleles of p15INK4B and SOCS-1 in 2 patients after sequential 5AC/entinostat epigenetic therapy, which was also reported previously.19,34
The working model for the development of combination epigenetic therapies has been that the agents synergize to reactivate expression of TSGs leading to the induction of a clinical response. Although we could not detect an association between methylation reversal in the 4 studied genes and clinical response, this does not eliminate the possibility of association of clinical response with methylation reversal of other MDS/leukemia relevant TSGs. The DNA from the 3 best responders (CR) in this study were either unavailable for assay (n = 1) or were not methylated at baseline (day 0) in 3 of the 4 studied genes (n = 2). Thus, a correlation between best clinical response and methylation reversal as suggested by Daskalakis et al19 may have been missed.
Unlike conventional cytotoxic drugs for the treatment of AML, clinical response to DNMT inhibitors in MDS requires multiple cycles of therapy.23 The slow clinical response makes analysis of molecular mechanism especially challenging: cellular samples obtained after several cycles of therapy may contain normal cells or a significantly different mixture of cells compared with the pretreatment population. We have focused on molecular changes during cycle 1 to ensure the study of proximal changes in diseased cells. However, it is possible that mechanistically important epigenetic alterations may occur in later cycles.
Given the lack of evidence for a specific transcriptional response to DNMT and HDAC inhibitor combination therapy, it is important to consider other mechanisms to explain the response of a fraction of patients to these drugs such as cytotoxicity through activation of DNA damage response or other apoptotic pathways, activation of immune response,41,42 or induction of cellular senescence in the neoplastic clone.43 The clinical administration of these drugs leads to clear evidence of double-stranded breaks in DNA, suggesting one potential mode of cytotoxicity. Although DNMT inhibitors represent a major advance in the treatment of MDS and related disorders, the mechanism by which these agents induce responses remains complex. Our study indicates that the transcriptional effects of 5AC and entinostat, at least in the short term, are modest, and cannot explain the efficacy of these agents. Further consideration of alternative modes of action is required to understand how to capitalize on the utility of these agents in hematologic malignancy.
An Inside Blood analysis of this article appears at the front of this issue.
The online version of this article contains a data supplement.
Presented in part at the 2007 Annual Meeting of the American Association of Cancer Research (AACR), Los Angeles, CA, April 17, 2007.
The publication costs of this article were defrayed in part by page charge payment. Therefore, and solely to indicate this fact, this article is hereby marked “advertisement” in accordance with 18 USC section 1734.
Acknowledgments
This work was supported in part by grants R21 CA110507 (S.D.G. and J.L.) and K24 CA111717 (S.D.G.), a Translational Research Award 6040-05 from the Leukemia & Lymphoma Society of America (S.D.G.), U01CA70095 from the National Cancer Institute, The Burrough Welcome Clinical Scientist Award (J.L.), The Flight Attendant Medical Research Institute (FAMRI; H.E.C.), and a Postdoctoral Fellowship (PF-05-252-01-MGO) from the American Cancer Society (M.K.H.K.).
National Institutes of Health
Authorship
Contribution: T.E.F. and H.E.C. designed and performed research, analyzed data, and wrote the paper; J.G.H., S.D.G., and J.L. designed research, analyzed data, and wrote the paper; A.M., I.E.-D., and L.R.S. designed research and edited the paper; P.K., A.J., K.O., S.-H.C., T.A., A.S.Y., R.O.-R., T.D., I.O., M.J.M., C.N., M.K.H.K., W.Z., and Y.S. performed research and analyzed data; and E.A.S. performed statistical analysis and wrote the paper.
Conflict-of-interest disclosure: S.D.G. is a consultant to and receives research support from Celgene and Syndax, and owns stock in Celgene. H.E.C. and L.R.S. receive research support from Celgene. J.G.H. is a consultant for and receives research support from OncoMethylome Sciences and Celgene. A.S.Y. is on the Speakers Bureau for Celgene and Eisai. The remaining authors declare no competing financial interests.
Correspondence: Steven D. Gore, 1650 Orleans St, Cancer Research Bldg 1, Rm 288, Baltimore, MD 21231; e-mail: gorest@jhmi.edu.

