Abstract
Diabetes mellitus and cardiomyopathy are common in chronically transfused thalassemia major patients, occurring in the second and third decades of life. We postulated that pancreatic iron deposition would precede cardiac iron loading, representing an environment favorable for extrahepatic iron deposition. To test this hypothesis, we examined pancreatic and cardiac iron in 131 thalassemia major patients over a 4-year period. Cardiac iron (R2* > 50 Hz) was detected in 37.7% of patients and pancreatic iron (R2* > 28 Hz) in 80.4% of patients. Pancreatic and cardiac R2* were correlated (r2 = 0.52), with significant pancreatic iron occurring nearly a decade earlier than cardiac iron. A pancreatic R2* less than 100 Hz was a powerful negative predictor of cardiac iron, and pancreatic R2* more than 100 Hz had a positive predictive value of more than 60%. In serial analysis, changes in cardiac iron were correlated with changes in pancreatic iron (r2 = 0.33, P < .001), but not liver iron (r2 = 0.025, P = .25). As a result, pancreatic R2* measurements offer important early recognition of physiologic conditions suitable for future cardiac iron deposition and complementary information to liver and cardiac iron during chelation therapy. Staging abdominal and cardiac magnetic resonance imaging examinations could significantly reduce costs, magnet time, and need for sedation in young patients.
Introduction
Iron overload is common in chronically transfused thalassemia major (TM) patients. Liver iron is a surrogate for total body iron burden1 and has been used for years to monitor chelation therapy in thalassemia patients.2 Liver iron quantification by magnetic resonance imaging (MRI) is well validated and becoming increasingly routine at major thalassemia centers.3 It is also now possible to directly image preclinical iron deposition in heart tissue and endocrine glands.4,5 Extrahepatic tissues have different kinetics of iron uptake and clearance than the liver6,7 because they selectively, or near selectively, load circulating non–transferrin-bound iron (NTBI).8 As a result, cardiac iron accumulation exhibits threshold behavior with respect to liver iron concentration9 and is quite sensitive to the duration of iron chelation therapy.10 In contrast, the liver is the dominant storage depot for transferrin-mediated iron uptake and fluctuates proportionally to global iron balance.11 As a result, cross-sectional correlations between heart and liver iron loading are poor5,12 and longitudinal relationships exhibit complicated, highly nonlinear behaviors.7 More importantly, dangerous heart iron accumulation and cardiac dysfunction can occur despite apparently superb control of liver iron during prospective longitudinal evaluation.7,13 These observations demonstrate that iron chelation therapy sufficient for neutral or negative liver iron balance may be inadequate to protect the heart in some patients.
Because the heart and pancreas predominantly load NTBI, iron burdens in these organs should be more closely correlated to one another than between the heart and the liver.8 Recent work by Au et al4 and by our laboratory14 supports this hypothesis. Because glucose intolerance/diabetes are common comorbidities with cardiac dysfunction,11,15 we postulated that pancreatic iron uptake might predict cardiac iron deposition in a clinically useful manner. To test this hypothesis, we compared pancreatic, hepatic, and cardiac iron loading in 131 patients with TM. Our objective was to determine whether pancreatic iron estimates could serve as an early warning system for cardiac iron loading, offering complementary information to the cardiac and liver iron estimates routinely obtained in these studies.
Methods
A convenience sample was collected from TM patients who had undergone clinically indicated MRI examinations between 2004 and 2007; waiver of informed consent was granted by the Committee of Clinical Investigation at Childrens Hospital Los Angeles (CCI 07-00141). Prospective pancreatic MRI data were obtained from 17 control subjects. Informed consent was obtained for these patients (CCI 2000-076). Approval was obtained from the Childrens Hospital Los Angeles Institutional Review Board for these studies. Informed consent was provided according to the Declaration of Helsinki. A total of 260 MRI studies suitable for analysis were identified from 131 patients (2.0 ± 1.3 examinations per patient; range, 1-6 examinations). A study was deemed usable if it had pancreas, heart, and liver iron measurements reported on the same visit; patients or examinations with missing data were excluded. Because more than 70% of patients represented referrals from outside institutions and were often studied on weekends and evenings, it was not possible to obtain consistent clinical data beyond the patient age, sex, diagnosis, and type of chelation therapy.
All MRI studies were performed in a 1.5T General Electric CVi scanner running system, Version 9.1. MRI methods for the liver and heart have been previously described.16,17 Briefly, liver R2 was measured using single-echo spin-echo techniques with echo times of 3, 3.5, 5, 8, 12, 18, and 30 ms. Liver R2* was measured using an automated single-spin echo acquisitions with 15 echo times logarithmically spaced between 0.95 ms and 16 ms. Cardiac R2* was measured using a gated, multiecho gradient echo sequence with 8 echos evenly spaced between 2 and 17.6 ms. Pancreatic R2* was measured using a multiple-echo, gradient echo sequence having the following parameters: field of view 32 to 48 cm, phase field of view ratio of 0.75, 18 slices with thickness 6 mm and zero gap, matrix 128 × 128, flip 20 degrees, repetition time 100 ms, bandwidth 125 kHz, and 8 echoes equally spaced between 1.1 and 15.1 ms. Slice coverage was from the diaphragmatic angle to the renal-collecting systems in 3 breath-holds. This ensured complete pancreatic coverage in every subject, regardless of prior abdominal surgical history.
All MRI images were processed using custom MATLAB routines. Signal decay was fit, pixel-wise, to an exponential decay plus a constant. By tracing the pancreas boundaries on either the anatomic images or the reconstructed map, histograms of pancreatic R2* were measured and combined among the relevant slices. Fatty replacement of the pancreas could be identified in older patients by phase oscillation in the images; these regions were excluded from the region of interest. Interobserver error was analyzed independently in a blinded fashion by 2 trained observers. Twenty-five cases were selected for dual review by an independent data analyst to represent a broad range of pancreatic R2* values. The pixel-weighted mean was used to represent the overall pancreatic R2* value. Liver R2 and R2* values were converted to predicted hepatic iron concentration (HIC) using validated calibrations curves.16 Cardiac R2*, equal to 1000/T2*, was used for all statistical comparisons because R2* is proportional to cardiac iron.18,19
Because some subjects had undergone multiple examinations, all MRI values were inversely weighted by the number of examinations such that each patient contributed equally to correlation and group-wise analyses. Weighted least-squares linear regression was used to assess the linear associations between HIC, pancreatic R2*, and cardiac R2*. Weighted logistic regression with respect to age was performed to determine the time-varying prevalence of cardiac and pancreatic iron loading. Weighted receiver operator characteristic (ROC) analysis was performed between pancreatic R2* and cardiac R2* to determine how well pancreatic iron served as a surrogate for cardiac iron deposition. The longitudinal relationship between cardiac and pancreatic R2* was determined by calculating the 2-point differential between the first and last study visits (delta R2* divide by delta time). Serial data were available in 43 patients with an observation interval of 2.1 plus or minus 0.9 years (range, 0.4-3.7 years). Scatterplots and linear regression were calculated between the heart differential and pancreatic or liver differentials; no weighting was necessary because all patients contributed equally to this comparison. All statistics were performed in JMP 5.1 (SAS Institute).
Results
Demographics of the study populations are summarized in Table 1. Deferasirox and deferoxamine monotherapy predominated, although a few subjects received combined therapy. Control subjects were slightly older and not ethnically matched to the patient population. HIC was not elevated in any control subject. Cardiac R2* was not measured in these subjects but was 30 plus or minus 5 Hz in a previous cohort.20 The pancreas R2* 95% confidence interval derived from normal controls was 28.1 Hz; 80.4% of patients had values exceeding this cutoff. Using the literature-accepted R2* cutoff of 50 Hz (T2* < 20 ms), elevated cardiac iron was observed in 37.7% of patients. Interobserver variability for pancreas R2* was 15.6% with no interobserver bias.
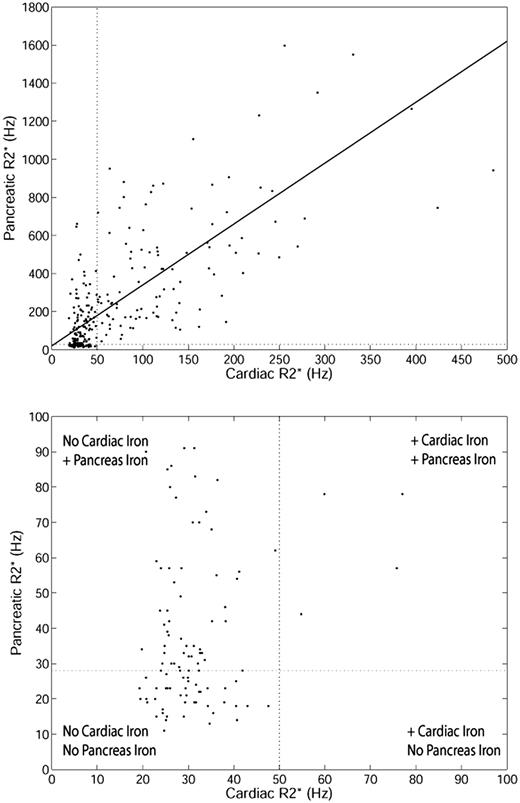
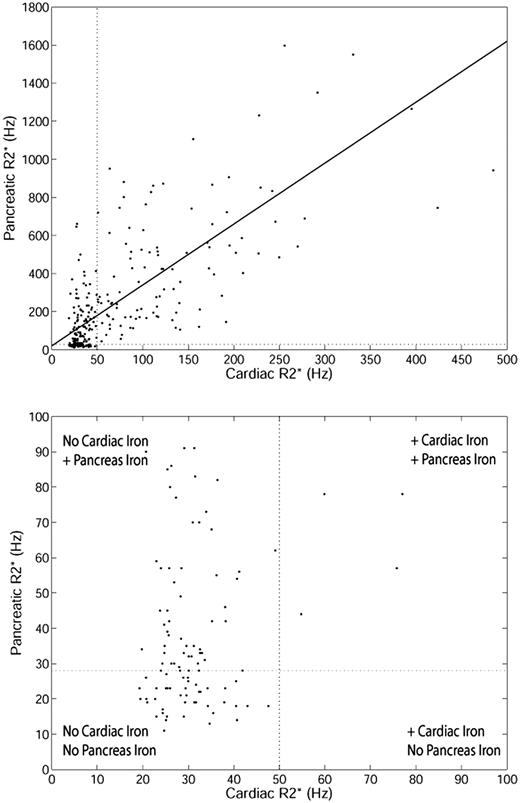
Pancreas R2* was weakly associated with HIC (r2 = 0.13, P < .001; results not shown). The poor correlation results from the difference in iron uptake between the liver and endocrine glands, compared with the relationship between the liver and the heart.7 However, a stronger association was observed between pancreas R2* and cardiac R2*. Figure 1 (top) shows the relationship between cardiac R2* and pancreatic R2* (r2 = 0.52, P < .001). Although the linear relationship is strong, a “threshold” is apparent (Figure 1 bottom zoomed image). Many patients have normal cardiac iron despite increased pancreas iron. However, the converse is not true; nearly every patient with increased cardiac iron had significantly elevated pancreatic R2*.
Relationship between cardiac R2* and pancreatic R2* for TM patients. (Top) Linear fit is shown (r2 = 0.52, P < .001) over the whole range. Upper limit of normal pancreatic R2* (28.1 Hz) and cardiac R2* (50 Hz) is shown for reference. (Bottom) Zoomed view of patients with cardiac R2* and pancreatic R2* less than 100 Hz.
Relationship between cardiac R2* and pancreatic R2* for TM patients. (Top) Linear fit is shown (r2 = 0.52, P < .001) over the whole range. Upper limit of normal pancreatic R2* (28.1 Hz) and cardiac R2* (50 Hz) is shown for reference. (Bottom) Zoomed view of patients with cardiac R2* and pancreatic R2* less than 100 Hz.
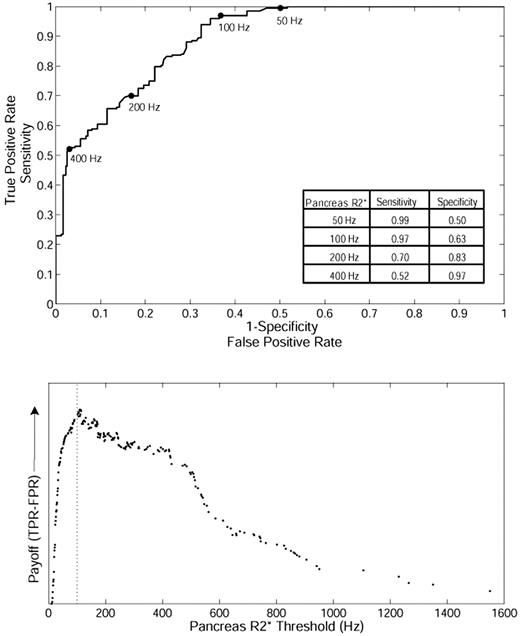
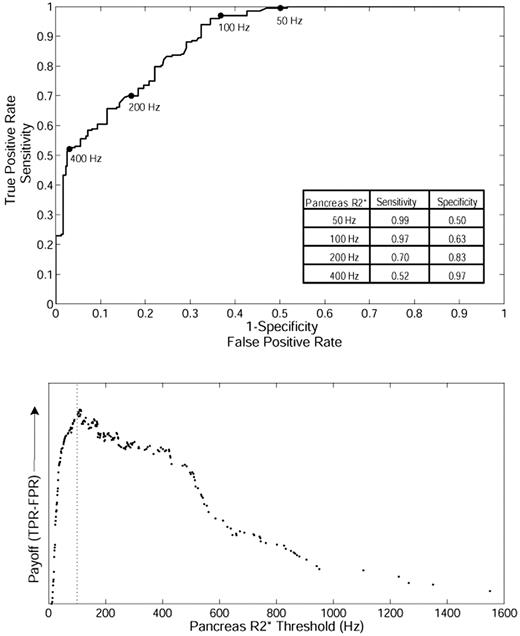
Based on this relationship, we postulated that pancreatic R2* could predict the loading of cardiac iron, potentially even serving as a screening tool. To test this hypothesis, we formulated a ROC curve between pancreatic R2* and the presence or absence of cardiac iron (cardiac R2* > 50 Hz; Figure 2 top). The area under the ROC curve is 0.89, which indicates good overall accuracy. The ROC curve has been marked for pancreas R2* values of 50, 100, 200, and 400 Hz for reference, and sensitivity/specificity values are shown in the inset table. The “payoff” of a diagnostic test represents the true-positive rate minus the false-positive rate.21 Figure 2 (bottom) demonstrates that the maximum payoff occurs around a pancreas R2* of 100 Hz. A pancreas R2* cutoff of 100 Hz has a positive predictive value of 61.5% and a false-negative rate of only 3.0%, making it suitable for screening.
ROC analysis between pancreatic R2* and the presence or absence of cardiac iron in TM. (Top) The ability of pancreatic R2* to predict the presence or absence of MRI-detectable cardiac iron (cardiac R2* > 50 Hz). (Bottom) The diagnostic payoff is maximized near 100 Hz.
ROC analysis between pancreatic R2* and the presence or absence of cardiac iron in TM. (Top) The ability of pancreatic R2* to predict the presence or absence of MRI-detectable cardiac iron (cardiac R2* > 50 Hz). (Bottom) The diagnostic payoff is maximized near 100 Hz.
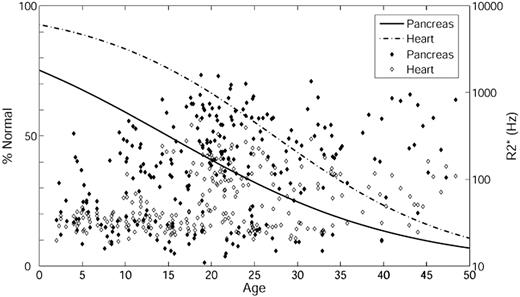
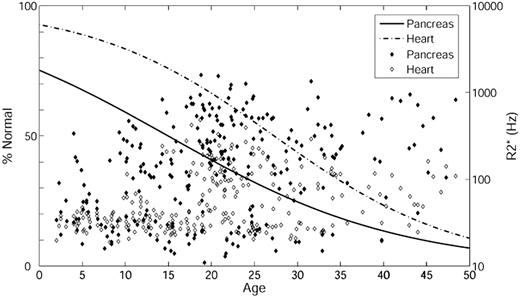
To investigate at what age significant pancreatic and cardiac iron loading develop, we performed logistic regression with respect to age (Figure 3) using pancreas R2* of 100 Hz and cardiac R2* of 50 Hz as cutoffs. Based on the ROC results, pancreas R2* of 100 Hz was used as an indicator of significant iron instead of 28.1 Hz (the 95% confidence interval from controls). The percentage normal for pancreas iron (solid line) and heart iron (dashed line) are on the left axis and the actual pancreas R2* (filled symbol) and cardiac R2* (open symbol) on the right axis. The percentage of patients with significant cardiac and pancreatic iron increases with age. In addition, iron loading occurs earlier in the pancreas than in the heart (leftward shift of the solid line relative to the dashed line). Using 50% prevalence as a reference, the time between detection of pancreas iron and cardiac iron was approximately 12 years.
Logistic regression with respect to age. The percentage of patients having pancreas R2* less than 100 Hz (solid line) and heart R2* less than 50 Hz (dashed line) is on the left axis; the actual pancreas R2* (filled symbol) and cardiac R2* (open symbol) are on the right axis. Age is on the x-axis.
Logistic regression with respect to age. The percentage of patients having pancreas R2* less than 100 Hz (solid line) and heart R2* less than 50 Hz (dashed line) is on the left axis; the actual pancreas R2* (filled symbol) and cardiac R2* (open symbol) are on the right axis. Age is on the x-axis.
ROC analysis was also performed between cardiac iron and liver iron. The area under the ROC curve was 0.51, which is statistically identical to random chance. No threshold was associated with increased probability of cardiac iron. Liver iron concentration demonstrated no statistically significant trend with age using either linear or logistic regression.
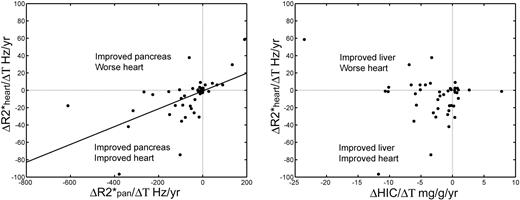
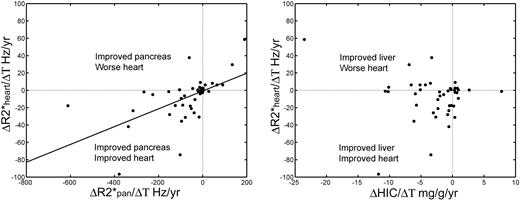
To determine how closely changes in cardiac iron follow changes in pancreatic iron, we plotted the differential of heart R2* against the differentials of pancreatic R2* and HIC, respectively (Figure 4). Changes in cardiac R2* correlated with changes in pancreatic R2* (r2 = 0.33, P < .001) but were uncorrelated with changes in HIC (r2 = 0.025, P = .25). Whereas the longitudinal linear correlation was slightly weaker than the cross-sectional analysis, the direction of pancreatic and cardiac changes was generally matched, with most points lying in the lower left and upper right quadrants (only one major outlier). In contrast, negative liver iron balance was not consistently associated with improvements in cardiac iron, with 8 of 43 patient values residing in the upper left quadrant. Changes in liver iron also failed to predict changes in pancreatic iron (not shown).
Longitudinal changes in cardiac R2*. (Left panel) Changes in cardiac R2* mirror changes in pancreatic R2*. Differences have been normalized to the time difference between the observations (ΔR2*/ΔT) and have units of Hertz per year. (Right panel) Changes in cardiac R2* were not predicted by changes in HIC. In particular, negative liver iron balance did not predict a favorable cardiac response, unlike for the pancreas.
Longitudinal changes in cardiac R2*. (Left panel) Changes in cardiac R2* mirror changes in pancreatic R2*. Differences have been normalized to the time difference between the observations (ΔR2*/ΔT) and have units of Hertz per year. (Right panel) Changes in cardiac R2* were not predicted by changes in HIC. In particular, negative liver iron balance did not predict a favorable cardiac response, unlike for the pancreas.
Discussion
The primary goal of this study was to determine whether monitoring pancreatic R2* offered additional information to our routine practice of measuring HIC and cardiac R2*. A relationship between pancreatic and cardiac R2* was predictable given that both organs take up NTBI.8 The relatively high linear correlation in TM patients suggests a graded response in both tissues and has been reported by us14 and by others.4 In the present study, the relationship was maintained across multiple time points (an average of 2 studies per patient). Proportionality was also preserved in the differential changes of heart and pancreatic iron in 43 patients, suggesting that the kinetics of loading and unloading iron are more similar than for the liver and the heart.7 More importantly, the pancreas appears to load iron earlier than the heart, providing an early marker of inadequate chelation regimens and a greater time window for intervention.
Based on these observations, pancreatic iron measurements provide important feedback, even when both cardiac T2* and liver iron results are available. It is a notoriously slow and difficult process to remove cardiac iron.6,22 If a patient with a normal cardiac T2* demonstrates a rising pancreatic R2*, it would be prudent to modify iron chelation to prospectively prevent cardiac iron accumulation rather than wait for cardiac iron to appear. Similarly, a declining pancreatic R2* consistently predicted neutral or declining cardiac R2* (Figure 4). In contrast, 7 of 16 patients with hepatic iron clearance exceeding 3 mg/g per year remained in positive cardiac iron balance. Thus when cardiac R2* is relatively unchanged on serial examination, declining pancreatic R2* suggests a more cardiac-favorable chelation regimen than a downward trend in liver iron.
This predictive relationship between pancreatic and cardiac iron also has practical and economic implications for monitoring. Some centers bill separately for the abdominal and cardiac components of the MRI iron examination. At our institution, each examination has an approximate list price of $2700; even with governmental or insurance discounts, this represents an important cost difference. MRI time is also an important and limited resource. The cardiac component takes an additional 5 minutes of patient preparation (beyond that for the abdominal examination) because of the need for cardiorespiratory gating, which requires cleaning and sometimes shaving portions of the chest by a gender-matched MRI attendant. Accurate cardiac localization, acquisition of R2*, and short-axis function images takes a minimum of 20 minutes, significantly longer if the patient is uncooperative or the gating signal is poor.
In contrast, acquisition of liver and pancreas R2* can be obtained in 4 breath-holds and does not require special localization or gating; liver acquisition alone can be achieved in one breath-hold. In patients who are unable to hold their breath, high-quality imaging can still be collected in less than 5 minutes, making it potentially possible to collect data in elementary school-age children without anesthesia. This would make iron surveillance imaging safer and more palatable to parents of children in this age group. Cardiac iron deposition is rare before the age of 10 years of age in well-transfused, well-chelated TM patients.23 The present data suggest that a quick, nonsedated abdominal examination might be able to detect children at highest risk of premature cardiac iron accumulation. In addition, staging the abdominal and cardiac components of the examination might be particularly important in countries where scanner availability and healthcare resources are critically limiting. High throughput abdominal scanning might represent an attractive alternative to comprehensive examination in these environments.
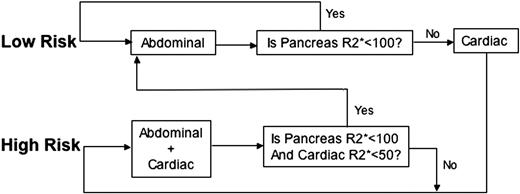
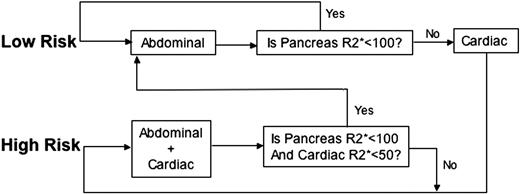
The algorithm used at our institution is shown in Figure 5. Before the first examination, patients are classified into low and high risk based on clinical assessment of their anemia type, years of transfusion therapy, estimated chelation compliance, and ferritin level. Low-risk patients only receive an abdominal MRI. If pancreas R2* is less than 100 Hz, chelator management would be based completely on trends in the hepatic and pancreatic iron levels, and the patient remains in the low-risk track. Detection of pancreatic R2* values more than 100 Hz prompts a complete cardiac MRI evaluation and transition to the high-risk track. A patient in the high-risk track receives both liver and heart MRI as standard of care; transition to the low-risk track occurs only if both cardiac iron is undetectable and pancreas R2* is less than 100 Hz. Based on the logistic regression relationships shown in Figure 3, it is clear that TM patients inexorably trend to the high-risk track. Nonetheless, this staged algorithm significantly decreases magnet use and imaging charges in our relatively young population. Savings are much higher in chronically transfused SCD patients where cardiac iron accumulation is less frequent.20 Prospective, multicenter studies are warranted to explore the staged algorithm further.
Staged algorithm for MRI examinations. The algorithm shown is used to stage MRI examinations when appropriate. Patients are first classified into either low or high risk. Low-risk patients will only receive an abdominal MRI (continue in the low-risk track) until their pancreas R2* is greater than 100 Hz. If a pancreatic R2* more than 100 Hz is measured on abdominal examination, the patient will have a complete cardiac MRI evaluation and will transition to the high-risk track. A patient in the high-risk track receives both liver and heart MRI routinely until cardiac R2* is less than 50 Hz and pancreas R2* is less than 100 Hz, when the patient will be moved into the low-risk track.
Staged algorithm for MRI examinations. The algorithm shown is used to stage MRI examinations when appropriate. Patients are first classified into either low or high risk. Low-risk patients will only receive an abdominal MRI (continue in the low-risk track) until their pancreas R2* is greater than 100 Hz. If a pancreatic R2* more than 100 Hz is measured on abdominal examination, the patient will have a complete cardiac MRI evaluation and will transition to the high-risk track. A patient in the high-risk track receives both liver and heart MRI routinely until cardiac R2* is less than 50 Hz and pancreas R2* is less than 100 Hz, when the patient will be moved into the low-risk track.
Iron overload in the pancreas may also have a direct impact on pancreatic function. Because this was a retrospective trial with limited clinical data, we did not know pancreas functional status of all of the patients. However, there were 9 patients with known diabetes, all of whom had moderate to severe pancreatic iron (> 150 Hz) as well as cardiac iron (140.2 ± 77.6 Hz). Recent work by Au et al suggests that cardiac R2* is a better predictor of pancreatic dysfunction than pancreatic R2*.4 Pancreatic iron deposition is an early event, and many patients initially have normal glucose metrics.24 Over time, iron-mediated oxidative stress triggers apoptosis, volume loss, and fatty replacement, leading to pancreatic dysfunction.4,24,25 Prospective, longitudinal studies are necessary to fully characterize the links between pancreatic R2* and pancreatic function; we are currently enrolling patients in a prospective trial to assess this question.
This retrospective study had several important limitations. Because the patients were referred for MRI from multiple centers and because the study was retrospective, clinical data regarding duration and intensity of transfusions were unavailable. Iron chelation therapy varied among patients and over time but was generally limited to deferoxamine and deferasirox therapy. The longitudinal relationships among liver, pancreas, and cardiac iron may depend on the dose, route, and type of iron chelation therapy. The pancreatic R2* measurements are more difficult than for liver or cardiac R2*. The pancreas is an irregularly structured gland and has a variable course. The splenic artery can be a useful landmark but unavailable in splenectomized patients. Bowel gas can artificially raise R2* values in the pancreas but never to greater than 100 Hz; this is one reason why 100 Hz is a better threshold for “significant” pancreatic iron overload. In older patients and those with high iron concentrations, gland involution over time makes it harder to define gland boundaries. A few older patients also had significant fatty replacement, producing severe oscillations in the signal decay that precluded R2* quantitation over the entire gland. Techniques that separate fat and water signals could be helpful in resolving this issue and are being developed for other body composition studies, but accurate pancreas R2* measurements cannot be performed in all patients. Interobserver variability was higher than described for either liver or heart and reflects the heterogeneity of pancreas shape, fatty infiltration, and susceptibility artifacts from bowel gas. Despite this measurement variability, pancreas R2* retained a high correlation with cardiac R2* and good predictive power for cardiac iron loading.
The logistic regression performed in this study strongly suggests that the pancreas “leads” the heart in iron loading. However, it was primarily a cross-sectional comparison, spanning only a few years of observation. To fully garner the temporal association between pancreatic and cardiac iron in individual patients would require decades of observation. Nonetheless, the cross-sectional relationship is far too powerful to represent random chance. Random fluctuations and differences in iron loading/unloading rates tend to disrupt cross-sectional relationships, not reinforce them.7 Despite all of the present limitations, pancreas R2* measurements in children and young adults are relatively straightforward to incorporate in clinical practice as prospective markers of cardiac iron risk. The proposed staged algorithm may allow earlier MRI screening for centers unable or unwilling to sedate small children. Staging would reduce costs and magnet demand. Further work is necessary to determine the functional significance of pancreatic iron loading to glucose and insulin regulation.
The publication costs of this article were defrayed in part by page charge payment. Therefore, and solely to indicate this fact, this article is hereby marked “advertisement” in accordance with 18 USC section 1734.
Acknowledgments
The authors thank Susan Carson, Anne Nord, Debbie Harris, Trish Peterson, Paola Pederzoli, Colleen McCarthy, Janelle Miller, Thomas Hofstra, and Susan Claster for their support of the MRI program.
This work was supported by the Cooley's Anemia Foundation (Adult Translational Research Award), General Clinical Research Center at Childrens Hospital Los Angeles/University of Southern California (National Institutes of Health RR00043-43), National Heart, Lung, and Blood Institute (1 RO1 HL075592-01A1), Centers for Disease Control (Thalassemia Center Grant U27/CCU922106), Novartis Pharma, and the Department of Pediatrics, Childrens Hospital Los Angeles.
National Institutes of Health
Authorship
Contribution: L.J.N. performed research, analyzed data, and wrote the paper; J.P. and T.D.C. collected data and assisted in writing; and J.C.W. designed and performed research, analyzed data, and wrote the paper.
Conflict-of-interest disclosure: T.D.C. and J.C.W receive research funding from Novartis. The other authors declare no competing financial interests.
Correspondence: John C. Wood, Division of Cardiology, Childrens Hospital Los Angeles, 4650 Sunset Blvd, Los Angeles, CA 90027; e-mail: jwood@chla.usc.edu.

