Abstract
Tumors depend upon angiogenesis for growth and metastasis. It is therefore critical to understand the inhibitory signaling mechanisms in endothelial cells that control angiogenesis. Epac is a cyclic adenosine 5′-monophosphate–activated guanine nucleotide exchange factor for Rap1. In this study, we show that activation of Epac or Rap1 leads to potent inhibition of angiogenesis in vivo. Epac/Rap1 activation down-regulates inhibitor of differentiation 1 (Id1), which negatively regulates thrombospondin-1 (TSP1), an inhibitor of angiogenesis. Consistent with this mechanism, activation of Epac/Rap 1 induces expression of TSP1; conversely, depletion of Epac reduces TSP1 levels in endothelial cells. Blockade of TSP1 binding to its receptor, CD36, rescues inhibition of chemotaxis or angiogenesis by activated Epac/Rap1. Mitogen-activated protein kinase kinase 5, a downstream mediator of vascular endothelial growth factor, antagonizes the effects of Epac/Rap1 by inducing Id1 and suppressing TSP1 expression. Finally, TSP1 is also secreted by fibroblasts in response to Epac/Rap1 activation. These results identify Epac and Rap1 as inhibitory regulators of the angiogenic process, implicate Id1 and TSP1 as downstream mediators of Epac/Rap1, and highlight a novel interplay between pro- and antiangiogenic signaling cascades involving multiple cell types within the angiogenic microenvironment.
Introduction
Angiogenesis, classically defined as the generation of new blood vessels from a pre-existing vasculature, is a tightly regulated process important in development as well as pathologic disease states such as cancer.1 Successful angiogenesis requires endothelial cell proliferation, migration, and tube formation, but is also influenced by other cell types in the microenvironment, such as fibroblasts and vascular smooth muscle cells.2 Elucidation of the signaling pathways in endothelial cells, as well as other cell types, is crucial for our understanding of angiogenesis.
Inhibitor of differentiation 1 (Id1) is a basic-helix-loop-helix (bHLH) protein that lacks a DNA binding domain and heterodimerizes with bHLH transcription factors to inhibit transcription.3 Id1 is expressed in endothelial cells and progenitor endothelial cells and plays an important role in tumor angiogenesis and metastasis.4,5 Among its activities, Id1 suppresses expression of thrombospondin-1 (TSP1) in fibroblasts.6 TSP1 is a large, extracellular homotrimeric protein that mediates antiangiogenic effects in endothelial cells by triggering signaling cascades via the cell surface receptors CD36 and CD47.7,8 TSP1 also promotes blood vessel maturation by recruiting vascular smooth muscle cells to growing capillaries.9
Extracellular signal-regulated kinase 5 (ERK5, BMK1), a member of the conserved mitogen-activated protein kinase (MAPK) family, is activated by vascular endothelial growth factor (VEGF) as well as other growth factor signals, and is critical for vascular development.10,11 Mitogen-activated protein kinase kinase 5 (MEK5) phosphorylates ERK5 and can be regulated by the cyclic adenosine 5′-monophosphate (cAMP)/Epac/Rap1 pathway.12
Rap1 is a small Ras-related guanine triphosphatase (GTPase) that plays a role in several cell processes, including cell adhesion, cell-cell junctions, and vascular permeability (for reviews, see Bos13 and Kooistra et al14 ). Rap1 is positively regulated by several Rap guanine nucleotide exchange factors that include cAMP-activated Epac1 and Epac2.15 Rap guanine triphosphatase–activating proteins such as Rap1GAP inhibit Rap1 activity.16 Recently, lack of Rap1a or Rap1b has been shown to inhibit angiogenesis in mice.17,18
We have previously demonstrated that the Epac/Rap1 pathway mediated cAMP-induced morphologic changes in endothelial cells as well as inhibition of VEGF-induced chemotaxis.19 In this study, we demonstrate that TSP1 and Id1 are regulated by Rap1 activity, and their interaction reflects a novel interplay between the Epac/Rap1 and MEK5/ERK5 signaling cascades. Furthermore, this pathway enables regulation of angiogenesis via crosstalk between multiple cell types within the angiogenic microenvironment.
Methods
Reagents
Epac activator 8-(4-chlorophenylthio)-2′-O-methyl-cAMP (8CPT) was purchased from BIOLOG Life Sciences Institute. Mitogen-activated MEK inhibitor U0126 was from Promega. MEK inhibitor PD98059 was from Calbiochem. VEGF A (165-kd isoform) was obtained from R&D Systems. TSP1 mouse monoclonal antibody mixture (Ab-11) and antibody A4.1 were obtained from Thermo Scientific. The CD36 mouse monoclonal antibody (FA6-152) was purchased from Abcam. Id1 rabbit antisera was purchased from Biocheck. Rabbit polyclonal antibody against phosphorylated ERK (p42/44) and mouse monoclonal antibody against total ERK (p42/44) were from Cell Signaling Technology. Rabbit antisera against ERK5 and the mouse monoclonal antibody against β-actin were from Sigma-Aldrich. Rabbit polyclonal antibody against Rap1 and a mouse monoclonal antibody against α-tubulin were from Santa Cruz Biotechnology. Mouse monoclonal antibody against MEK5 was from BD Transduction Laboratories. Goat monoclonal antibody against the hemagglutinin tag (3F10) was from Roche Applied Science. Mouse anti–human CD31 was from DakoCytomation. IgG and IgM isotype control antibodies were purchased from eBioscience.
Cell culture
Human dermal microvascular endothelial cells (HMVECs) from Cell Systems were cultured, as previously described.19 Human fibroblasts were also obtained from Cell Systems and grown in Dulbecco modified Eagle medium plus 10% fetal bovine serum.
Expression constructs
Cloning of constitutively active (CA) Rap1A-63E (CA Rap1) or Rap1GAP into pCDH-MCS1-EF1-copGFP from Systems Biosciences has been previously described.19 pCMV-Id1 was a kind gift of Judith Campisi (Buck Institute, Novato, CA) and has been described elsewhere.20 pWPI-MEK5AA and pWPI-MEK5DD were constructed by inserting a multicloning site linker (BamHI, NdeI, XmaI, and SpeI) downstream of the EF-1α promoter in pWPI (kind gift of Didier Trono, Ecole Polytechnique, Fédérale de Lausanne, Lausanne, Switzerland; http://tronolab.epfl.ch/). Dominant-negative (DN) MEK5 (MEK5AA) and CA MEK5 (MEK5DD) were subcloned from the previously described vectors, pCEFL-MEK5AA and pCEFL-MEK5DD (kind gift of Silvio Gutkind, National Institutes of Health/National Institute of Dental and Craniofacial Research, Bethesda, MD), into pWPI using the restriction endonucleases BamHI and SpeI.21 DNA sequencing of the MEK5AA and MEK5DD constructs was performed to confirm the presence of the appropriate mutations at Ser311 and Thr315 (data not shown).
Transfection and lentiviral transduction
HMVECs were transfected with vector or small interfering RNA (siRNA) using Amaxa with nucleofactor (HMVEC-L), according to manufacturer instructions. Transfection efficiency was monitored by fluorescence microscopy using either siGlo fluorescent-labeled siRNA from Dharmacon or green fluorescent protein expression for plasmid transfection efficiency using fluorescence microscopy to determine the percentage of transfected cells. Transfection efficiency using siRNA or plasmids was approximately 50% (data not shown). Lentiviral transduction of HMVECs was carried out as described previously.19 Lentiviral transduction efficiency was greater than 80%, as assessed by flow cytometry (data not shown), and therefore, cell sorting or selection was not necessary.
Western blotting
Cells were lysed in radioimmunoprecipitation assay lysis buffer supplemented with 25mM β-glycerophosphate, 5mM sodium fluoride, 1mM sodium orthovanadate, and 1/200 dilution of protease inhibitor mixture from EMD Chemicals, and separated using sodium dodecyl sulfate–polyacrylamide gel electrophoresis using 10% polyacrylamide or 4% to 20% gradient gels from Bio-Rad. Gels were transferred to nitrocellulose membrane and probed with antibodies. Detection was achieved using Infrared dye–conjugated antibodies from LI-COR or Rockland Immunochemicals, followed by scanning on an Odyssey imager with analysis and quantitation using Odyssey Version 2.1 image analysis software (LI-COR Biosciences). Alternatively, standard enhanced chemiluminescence detection was used as previously described.22
Rap1 pull-down assay
Rap1 activity was assayed using a pull-down assay in which isolation of Rap1-GTP was performed using Ral-GDS-GST, followed by Western blotting and probing with an anti-Rap1 antibody, as described previously.19
Quantitative real-time polymerase chain reaction
RNA was isolated using Qiashredder and the RNAeasy kit from QIAGEN. Quantitative real-time polymerase chain reaction (PCR) was carried out, according to the manufacturer's protocol, using Gene Expression Assays from Applied Biosystems and 2× master mix from Applied Biosystems or ABGene on an Applied Biosystems 7300 or a StepOne Plus Real-Time PCR system.
Endothelial cell migration assay
HMVECs were assayed for their ability to migrate toward VEGF using a Boyden chamber assay, as previously described.19 For antibody-blocking experiments, antibodies were added with cells to the upper chamber at the specified concentrations.
Animals
The care and treatment of mice were in accordance with institutional guidelines. All animals used in the present study were housed in a pathogen-free environment, and animal experiments were approved by the institutional review board of the University of Chicago.
Matrigel plug assay
Athymic female nu/nu mice, 4 to 6 weeks of age, were purchased from Harlan. Matrigel experiments were carried out as previously described.23 Briefly, mice were injected subcutaneously in the median abdominal area with 500 μL of Matrigel Basement Membrane Matrix (BD Biosciences). To induce angiogenesis, Matrigel was supplemented with VEGF (200 pg/mL) and heparin (60 U/mL; positive control), or an equal volume of PBS as a negative control. Human microvascular endothelial cells (104 cells/mL) were added to the plugs. Mice were euthanized at day 10 postimplantation. The plugs were extracted, sectioned, frozen, and fixed. Slides were incubated overnight with rat anti–mouse CD31 (1:125; BD Pharmingen) at 4°C, washed, and then incubated with secondary donkey anti–rat RhodamineX antibodies (1:200; Jackson ImmunoResearch Laboratories). Slides were washed and mounted in Fluoromount (Southern Biotechnology Associates). The number of CD31-positive structures (blood vessels) was determined using MetaMorph software package (Molecular Devices). Fluorescent images were obtained using Nikon fluorescent microscope (Diaphot 200) at room temperature and converted to digital files using MetaMorph software. The same software was used to measure fluorescence intensity and compare the values to DAPI (4,6 diamidino-2-phenylindole) counterstain used as background. CD31-positive structures were counted in low magnification (×40) fields using MetaMorph software. Regions of highest vessel density (hot spots) were captured and counted. At least 4 fields were counted in a representative Matrigel section, and at least 3 Matrigel plugs were examined per condition. Values are represented as means plus or minus SD. Vessels were identified, as previously described and plotted as microvessel density (MVD).24 Mean and standard error values were calculated and compared using paired Student t test and analysis of variance. P values less than .05 were considered significant.
Severe combined immunodeficient mouse model of human angiogenesis
Functional human microvessels were induced in severe combined immunodeficient (SCID) mice (CB-17 SCID; Taconic Farms), as described.25 Briefly, 106 HMVECs were seeded in poly(l-lactic acid; Medsorb) biodegradable scaffolds, and 2 scaffolds were implanted subcutaneously into the dorsum of each SCID mouse. Beginning 5 days after implantation, the animals received a daily local injection of 8CPT or control vehicle (20mM Tris HCl, pH 8.0, and 150mM NaCl) in a volume of 50 μL/scaffold. The injections continued for 5 days, and mice were euthanized 24 hours after the last injection. The implants were retrieved, fixed in 10% neutral buffered formalin for 30 minutes at 40°C, and processed for histology. Formalin-fixed, paraffin-embedded implants were generated to quantify differences in vessel densities in the tumors of the treated and untreated animals. Serial sections of 5 μm in thickness were processed and deparaffinized for standard immunohistochemistry. Antigen epitopes were unmasked by microwaving the specimens in ET buffer (1M EDTA [ethylenediaminetetraacetic acid], pH 9.0, 1mM Tris, pH 7.0). Nonspecific blocking was achieved by using 5% milk peroxidase for 20 minutes. Tissue sections were incubated with a 1/100 dilution of primary antibody mouse anti–human CD31 (DakoCytomation) for 30 minutes at 37° and the secondary antibody Envision+ Mouse for 30 minutes at 37°C. Liquid diaminobenzidine+ substrate chromagen system (DakoCytomation) was applied to visualize the bound antibody. The number of CD31+ blood vessels was counted in 10 random fields per sponge at room temperature using an Olympus BX31 microscope (400×) with a Carl Zeiss Axio Cam camera.
Results
Rap1 inhibits in vivo angiogenesis
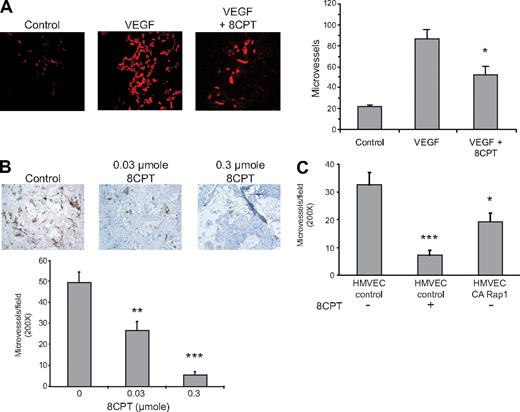
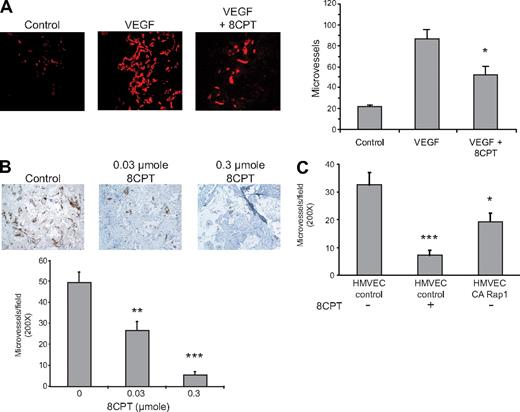
Activation of Rap1 has previously been shown to interfere with VEGF-mediated chemotaxis of HMVECs in culture.19 We therefore determined whether Rap1 activation also inhibited VEGF-mediated angiogenesis in a Matrigel mouse model. We have previously shown that the compound, 8CPT, specifically activates Epac/Rap1, but does not activate protein kinase A (PKA) in endothelial cells.19 Treatment with the Epac-specific agonist, 8CPT, inhibited VEGF-induced angiogenesis (Figure 1A). We also tested the ability of 8CPT to suppress angiogenesis in a SCID mouse model25 devoid of exogenous angiogenic factors. Treatment with 8CPT yielded almost complete inhibition of angiogenesis in the SCID mouse model of angiogenesis (Figure 1B). To determine whether Rap1 activation in endothelial cells was sufficient for suppression of angiogenesis, we tested HMVECs expressing CA Rap1 in the SCID mouse model (Figure 1C). CA Rap1 inhibited angiogenesis, although not to the same degree as treatment with 8CPT. To address whether Rap1 was necessary for 8CPT-mediated suppression of angiogenesis, we used an inhibitor of Rap1 activation, Rap1GAP. However, poor cell adherence, the opposite phenotype of Rap1-expressing cells, prevented implantation of HMVECs that express Rap1GAP into SCID mice (data not shown). These results demonstrate that both a drug that activates Epac as well as HMVEC cells that directly express CA Rap1 are sufficient to inhibit angiogenesis in mice.
Epac/Rap1 activation suppresses angiogenesis in vivo. (A) Matrigel plugs were implanted into 3 groups, as follows: negative control group received Matrigel with no supplements (left panel), and the remaining 2 received Matrigel supplemented with VEGF (200 pg/mL) and heparin (60 U/mL), with (right) or without (center) 2.5 μmol 8CPT. No further addition of 8CPT was performed during the experiment. Blood vessels were stained with anti-CD31 and rhodamine-conjugated secondary antibodies. Microvessel density was plotted for each group. Bars show ± SE. *P < .05 (n = 4). (B) Biodegradable scaffolds containing HMVECs were implanted in SCID mice, as described in “Methods.” Daily subcutaneous injections of buffer alone (control vehicle, left panel), 0.03 μmol (center), or 0.3 μmol (right) of 8CPT were performed for 5 days. Sections of implants were stained with an anti–human CD31 antibody to detect blood vessels. Secondary antibodies were peroxidase conjugated, and the chromagen was diaminobenzidine. Pictures shown are a representative field from each treatment group. The number of CD31-positive microvessels was counted in 10 random fields per scaffold using optical microscopy and plotted. Bars show ± SE. **P < .01; ***P < .001 (n = 6). (C) SCID angiogenesis assay was performed as in (B), except HMVECs expressed either CA Rap1 or control vector. Bars show ± SE. *P < .05; ***P < .001 (n = 6).
Epac/Rap1 activation suppresses angiogenesis in vivo. (A) Matrigel plugs were implanted into 3 groups, as follows: negative control group received Matrigel with no supplements (left panel), and the remaining 2 received Matrigel supplemented with VEGF (200 pg/mL) and heparin (60 U/mL), with (right) or without (center) 2.5 μmol 8CPT. No further addition of 8CPT was performed during the experiment. Blood vessels were stained with anti-CD31 and rhodamine-conjugated secondary antibodies. Microvessel density was plotted for each group. Bars show ± SE. *P < .05 (n = 4). (B) Biodegradable scaffolds containing HMVECs were implanted in SCID mice, as described in “Methods.” Daily subcutaneous injections of buffer alone (control vehicle, left panel), 0.03 μmol (center), or 0.3 μmol (right) of 8CPT were performed for 5 days. Sections of implants were stained with an anti–human CD31 antibody to detect blood vessels. Secondary antibodies were peroxidase conjugated, and the chromagen was diaminobenzidine. Pictures shown are a representative field from each treatment group. The number of CD31-positive microvessels was counted in 10 random fields per scaffold using optical microscopy and plotted. Bars show ± SE. **P < .01; ***P < .001 (n = 6). (C) SCID angiogenesis assay was performed as in (B), except HMVECs expressed either CA Rap1 or control vector. Bars show ± SE. *P < .05; ***P < .001 (n = 6).
Rap1 regulates Id1 and TSP1
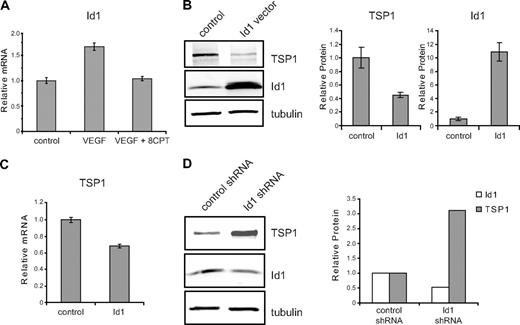
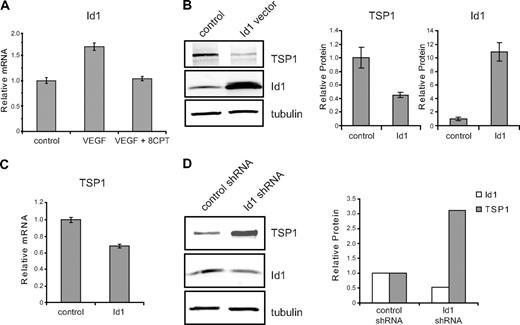
To identify potential targets of activated Rap1 that regulate angiogenesis in HMVECs, we performed microarray analysis. Id1, a bHLH negative regulator of transcription that plays a crucial role in tumor angiogenesis,5,26,27 was identified through microarray analysis as a gene whose expression was differentially regulated by VEGF and 8CPT (data not shown). All microarray data have been deposited into the Gene Expression Omnibus (GEO) public database under accession number GSE17777. These results were validated by quantitative real-time PCR, demonstrating that VEGF up-regulated expression of Id1, whereas cotreatment with 8CPT and VEGF blocked this increase (Figure 2A). Id1 has previously been shown to regulate TSP1 expression in fibroblasts via transcriptional suppression.6 To determine whether this mechanism also exists in endothelial cells, we transiently transfected Id1 into HMVECs. An increase in Id1 expression resulted in decreased TSP1 protein (Figure 2B) and mRNA levels (Figure 2C). Reduction of TSP1 protein expression correlated with the amount of Id1 transfected, was detected as early as 8 hours after transfection of Id1, and persisted for at least 24 hours (supplemental Figure 1, available on the Blood website; see the Supplemental Materials link at the top of the online article). Conversely, short hairpin RNA (shRNA) knockdown of Id1 yielded an increase in TSP1 protein levels (Figure 2D).
Id1 regulation of TSP1 in endothelial cells. (A) Relative expression of Id1 mRNA. HMVECs were treated with VEGF (100 pg/mL), VEGF, and 8CPT (100μM), or left untreated (control). Id1 mRNA expression was assessed by quantitative real-time PCR (qPCR). GADPH served as an internal control for each assay (data not shown). Relative expression was normalized to the untreated control and plotted as fold change. Bars represent mean ± SD (n = 3). (B) Down-regulation of TSP1 protein expression by Id1. HMVECs were transfected with vector or Id1 expression constructs and assayed 6 hours posttransfection. After Western blot analysis (left), quantitation of protein expression of TSP1 and Id1 relative to α-tubulin was performed using LI-COR Odyssey software (right). Bars represent means ± SD (n = 3). (C) mRNA expression of TSP1 in HMVECs after Id1 transfection. Samples were transfected and analyzed by qPCR, as in (B). Bars represent means ± SD (n = 3). (D) Up-regulation of TSP1 protein after depletion of Id1. HMVECs were transduced with lentivirus expressing Id1 shRNA or control lentivirus. After Western blot analysis (left), quantitation of protein expression of TSP1 and Id1 relative to α-tubulin was performed using LI-COR Odyssey software (right). Data shown are plotted as means ± SE (n = 3). An independent Id1 shRNA sequence gave similar results (data not shown).
Id1 regulation of TSP1 in endothelial cells. (A) Relative expression of Id1 mRNA. HMVECs were treated with VEGF (100 pg/mL), VEGF, and 8CPT (100μM), or left untreated (control). Id1 mRNA expression was assessed by quantitative real-time PCR (qPCR). GADPH served as an internal control for each assay (data not shown). Relative expression was normalized to the untreated control and plotted as fold change. Bars represent mean ± SD (n = 3). (B) Down-regulation of TSP1 protein expression by Id1. HMVECs were transfected with vector or Id1 expression constructs and assayed 6 hours posttransfection. After Western blot analysis (left), quantitation of protein expression of TSP1 and Id1 relative to α-tubulin was performed using LI-COR Odyssey software (right). Bars represent means ± SD (n = 3). (C) mRNA expression of TSP1 in HMVECs after Id1 transfection. Samples were transfected and analyzed by qPCR, as in (B). Bars represent means ± SD (n = 3). (D) Up-regulation of TSP1 protein after depletion of Id1. HMVECs were transduced with lentivirus expressing Id1 shRNA or control lentivirus. After Western blot analysis (left), quantitation of protein expression of TSP1 and Id1 relative to α-tubulin was performed using LI-COR Odyssey software (right). Data shown are plotted as means ± SE (n = 3). An independent Id1 shRNA sequence gave similar results (data not shown).
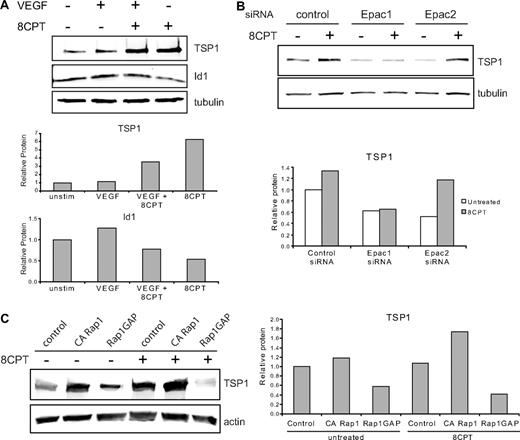
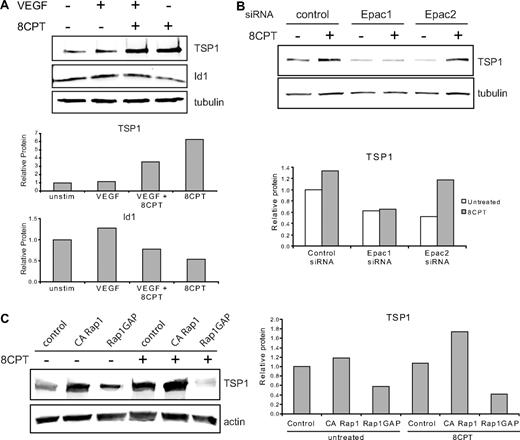
We investigated the effects of treatment with VEGF and 8CPT on protein expression of TSP1 and Id1 (Figure 3A). Previously, it has been shown that VEGF treatment increases Id1 mRNA in endothelial cells.28 Treatment of HMVECs with VEGF modestly increased Id1 protein expression, but did not significantly alter TSP1 expression compared with control. By contrast, pretreatment with 8CPT suppressed VEGF induction of Id1 and increased TSP1 expression. Stimulation with 8CPT alone caused a small decrease in Id1 expression and an increase in TSP1. These results indicate that Epac activation promotes TSP1 and antagonizes Id1 expression.
Epac/Rap1 regulation of TSP1. (A) Regulation of TSP1 and Id1 protein expression. HMVECs were treated with VEGF (10 ng/mL), 8CPT (100μM), VEGF, and 8CPT, or mock treated. After Western blot analysis (top), quantitation was performed using LI-COR software analysis (bottom). (B) Regulation of TSP1 protein expression after depletion of Epac1 and 2. HMVECs depleted of Epac1 or Epac2 by siRNA transfection (supplemental Figure 2) were treated with 8CPT (100μM) or mock treated. After Western blot analysis (top), quantitation was performed as above (bottom). (C) TSP1 protein expression after expression of CA Rap1 or Rap1GAP in HMVECs using lentiviral transduction. Cells were treated with 8CPT (100μM) or mock treated. After Western blot analysis (left), quantitation was performed as above (right). Representative experiments are shown.
Epac/Rap1 regulation of TSP1. (A) Regulation of TSP1 and Id1 protein expression. HMVECs were treated with VEGF (10 ng/mL), 8CPT (100μM), VEGF, and 8CPT, or mock treated. After Western blot analysis (top), quantitation was performed using LI-COR software analysis (bottom). (B) Regulation of TSP1 protein expression after depletion of Epac1 and 2. HMVECs depleted of Epac1 or Epac2 by siRNA transfection (supplemental Figure 2) were treated with 8CPT (100μM) or mock treated. After Western blot analysis (top), quantitation was performed as above (bottom). (C) TSP1 protein expression after expression of CA Rap1 or Rap1GAP in HMVECs using lentiviral transduction. Cells were treated with 8CPT (100μM) or mock treated. After Western blot analysis (left), quantitation was performed as above (right). Representative experiments are shown.
Epac and Rap1 mediate effects of 8CPT
8CPT is a specific agonist of Epac, which can activate Rap1.29 To determine whether Epac 1 and 2 were necessary for induction of TSP1 by 8CPT, we used siRNA transfection to deplete either Epac1 or Epac2 in HMVECs. Depletion was efficient and specific, with an approximate 80% reduction in mRNA for either Epac1 or Epac2, as assessed by quantitative real-time PCR (supplemental Figure 2). Epac1 depletion completely blocked induction of TSP1 by treatment with 8CPT (Figure 3B), whereas Epac 2 did not suppress TSP1 induction by 8CPT. Interestingly, depletion of either Epac1 or Epac2 led to decreased levels of TSP1 in untreated cells compared with control cells. Furthermore, knockdown of Epac1 increased Id1 mRNA (supplemental Figure 2). These results indicate that Epac1 mediates 8CPT induction of TSP1 and a decrease in Id1.
To determine whether active Rap1 is sufficient to up-regulate TSP1, HMVECs expressing CA Rap1 were probed for TSP1 levels (Figure 3C). CA Rap1 increased TSP1 levels to a similar level as treatment with 8CPT. Stimulation of these cells with 8CPT led to an even higher level of TSP1 consistent with activation of endogenous Rap1 (supplemental Figure 3). To determine whether active Rap1 is necessary for TSP1 production, we analyzed HMVECs expressing Rap1GAP. Upon inactivation of Rap1, a decrease in TSP1 was observed (Figure 3C). Furthermore, no increase in TSP1 was observed after 8CPT stimulation of Rap1GAP-expressing cells, suggesting that Rap1 activation is not only sufficient, but also necessary for induction of TSP1 expression by 8CPT.
Role of MAPK in Rap1 regulation of thrombospondin
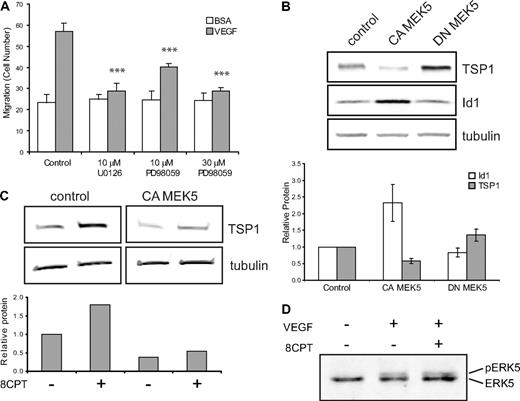
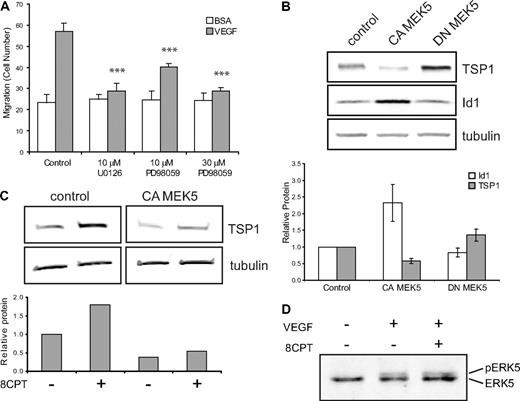
One possible mechanism by which Rap1 might exert its effects in endothelial cells is via regulation of the MAPK pathway. Activation of Rap1 has been shown to activate or inhibit ERK1,2 signaling, depending on the cell type.29,30 To test whether MAPK might play a role in Rap1's inhibition of endothelial cell function, we first asked whether MEK inhibitors could suppress VEGF-mediated chemotaxis. Addition of the MEK inhibitor, U0126, completely suppressed VEGF-mediated endothelial cell chemotaxis (Figure 4A). In addition to suppression of MEK1/2 activity, U0126 inhibits MEK5 function.31 To try to distinguish between MEK1/2 and MEK5 effects, we used the MEK inhibitor, PD08059. Low doses of PD08059, which completely inhibit MEK1/2, but only partially inhibit MEK5, led to only partial suppression of VEGF-mediated chemotaxis, whereas high-dose PD08059 completely suppressed endothelial cell chemotaxis.
Regulation of TSP1 and Id1 by MEK/ERK5. (A) Endothelial cell chemotaxis to VEGF (100 pg/mL) or control (bovine serum albumin) using a Boyden chamber assay after treatment with U0126 (10μM) or PD98059 (10μM or 30μM). Bars represent mean ± SD (n = 4). ***P < .001. (B) TSP1 and Id1 protein expression after expression of CA or DN MEK5 in HMVECs via lentiviral transduction. After Western blot analysis (top), quantitation was performed using LI-COR software analysis for TSP1 (□) and Id1 ( ) normalized to α-tubulin expression (bottom). Data plotted are averages of 3 independent experiments ± SE. (C) Analysis of TSP1 protein expression in HMVECs expressing CA MEK5 or control after treatment with 8CPT. After Western blot analysis (top), quantitation was performed, as above (bottom). Data shown are representative of 2 independent experiments. (D) Detection of pERK5 in HMVECs treated with VEGF (10 ng/mL) for 5 minutes or pretreated with 8CPT (100μM) for 10 minutes, followed by VEGF treatment. Samples were analyzed by Western blotting. Data shown are representative of 2 independent experiments.
Regulation of TSP1 and Id1 by MEK/ERK5. (A) Endothelial cell chemotaxis to VEGF (100 pg/mL) or control (bovine serum albumin) using a Boyden chamber assay after treatment with U0126 (10μM) or PD98059 (10μM or 30μM). Bars represent mean ± SD (n = 4). ***P < .001. (B) TSP1 and Id1 protein expression after expression of CA or DN MEK5 in HMVECs via lentiviral transduction. After Western blot analysis (top), quantitation was performed using LI-COR software analysis for TSP1 (□) and Id1 ( ) normalized to α-tubulin expression (bottom). Data plotted are averages of 3 independent experiments ± SE. (C) Analysis of TSP1 protein expression in HMVECs expressing CA MEK5 or control after treatment with 8CPT. After Western blot analysis (top), quantitation was performed, as above (bottom). Data shown are representative of 2 independent experiments. (D) Detection of pERK5 in HMVECs treated with VEGF (10 ng/mL) for 5 minutes or pretreated with 8CPT (100μM) for 10 minutes, followed by VEGF treatment. Samples were analyzed by Western blotting. Data shown are representative of 2 independent experiments.
These results are consistent with a role for MEK5, but not MEK1/2 in VEGF-mediated chemotaxis. To examine directly the role of MEK1/2 involvement in the Rap1-mediated effects on endothelial cells, we examined ERK1/2 activation after treatment with VEGF and 8CPT. VEGF stimulation of HMVECs led to rapid and pronounced phosphorylation of ERK1,2 as has been demonstrated previously (supplemental Figure 4; Yu and Sato32 ). As expected, pretreatment with U0126 prevented phosphorylation of ERK1,2. However, consistent with previously published results in HUVECs,33 activation of Rap1 by 8CPT led to a modest increase in phosphorylation of ERK1,2 and did not suppress VEGF-mediated phosphorylation of ERK1,2. These results suggest that ERK1,2 do not mediate inhibition of chemotaxis in response to Rap1 activation.
ERK5 has previously been implicated in angiogenesis. ERK5 knockout mice have an embryonic lethal phenotype and display abnormal vascular formation.10 Furthermore, mice lacking ERK5 demonstrate reduced tumor-associated angiogenesis.11 Consistent with these data, we found that expression of CA MEK5 in HMVECs significantly increased angiogenesis in Matrigel plug assay compared with control HMVECs (data not shown). Rap1 can either positively or negatively regulate ERK5 activity, depending on the cell type.12,34 We therefore wanted to ask whether regulation of the MEK5/ERK5 pathway could account for TSP1 regulation by Rap1. HMVEC-expressing CA MEK5 or DN MEK5 were produced using lentiviral transduction (supplemental Figure 5A). Initially, we determined whether MEK5/ERK could regulate Id1 and/or TSP1. Indeed, in contrast to Epac/Rap1, expression of CA MEK5 up-regulated Id1 and down-regulated TSP1 protein levels. Conversely, DN MEK5 up-regulated TSP1, although it had little effect on Id1 expression (Figure 4B). Similar results were observed when mRNA levels of Id1 and TSP1 were examined in these cells (supplemental Figure 5B).
The observations that Epac/Rap1 and MEK5/ERK5 oppositely regulate TSP1 raise the possibility that these 2 signaling pathways interact. If MEK5 is a downstream target of Rap1, then expression of CA MEK5 should rescue the increase in TSP1 observed with 8CPT treatment. Indeed, in cells expressing CA MEK5, 8CPT treatment did not induce TSP1 (Figure 4C). To determine whether Rap1 can directly inhibit MEK5/ERK5 activation, we examined the effect of 8CPT on VEGF-stimulated ERK5 phosphorylation (Figure 4D). However, no change in VEGF-mediated phosphorylation of ERK5 was observed (Figure 4D), suggesting that Rap1 does not block MEK5 or ERK5 activation in HMVECs.
Blockade of TSP1-CD36 interaction reverses Rap1 inhibition of endothelial cell function
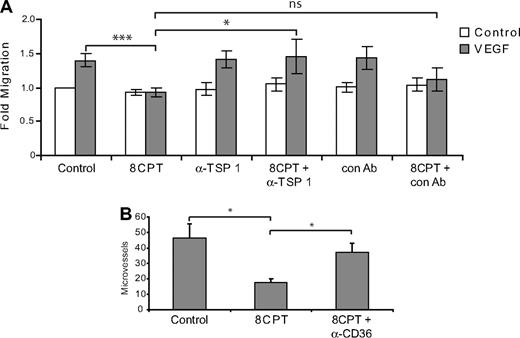
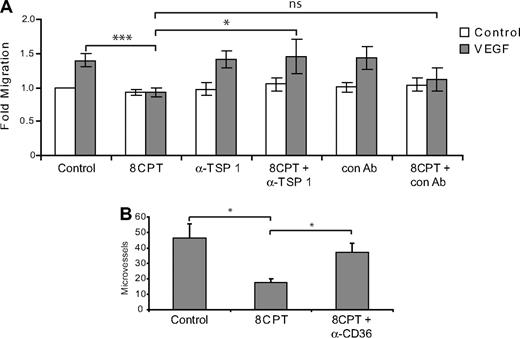
The above results are consistent with a role for TSP1 in Rap1 regulation of chemotaxis. Indeed, addition of a blocking antibody that recognizes the CD36 binding site on TSP1 reversed the inhibition of chemotaxis mediated by 8CPT treatment, whereas a control antibody had no effect (Figure 5A). Similarly, addition of blocking antibodies to CD36, a cell surface receptor for TSP1, rescued the inhibition of angiogenesis mediated by 8CPT in a Matrigel assay. These results suggest that TSP1 induction is responsible, at least in part, for the inhibition of chemotaxis and angiogenesis mediated by Rap1.
Blockade of TSP1/CD36 rescues inhibition of endothelial cell chemotaxis and angiogenesis by 8CPT. (A) HMVEC chemotaxis assay. Analysis of cells migrating to VEGF (200 pg/mL) after treatment with 8CPT (2.5μM), anti-TSP1 antibody (A4.1), 8CPT and anti-TSP1 (2 μg/mL), isotype control antibody (IgM, 2 μg/mL), or 8CPT and isotype control. Bars represent normalized means ± SD (n = 4 experiments, each with 4 replicates). ns, not significant; *P < .05; ***P < .001. (B) In vivo Matrigel plug angiogenesis assay. Mice were injected with Matrigel supplemented with VEGF (200 pg/mL); VEGF, 8CPT (2.5μM), and isotype control antibody; or VEGF, 8CPT, and anti-CD36 (FA-152) antibody. Microvessel density was counted, as described in “Methods.” Bars show mean ± SE (n = 5). *P < .05.
Blockade of TSP1/CD36 rescues inhibition of endothelial cell chemotaxis and angiogenesis by 8CPT. (A) HMVEC chemotaxis assay. Analysis of cells migrating to VEGF (200 pg/mL) after treatment with 8CPT (2.5μM), anti-TSP1 antibody (A4.1), 8CPT and anti-TSP1 (2 μg/mL), isotype control antibody (IgM, 2 μg/mL), or 8CPT and isotype control. Bars represent normalized means ± SD (n = 4 experiments, each with 4 replicates). ns, not significant; *P < .05; ***P < .001. (B) In vivo Matrigel plug angiogenesis assay. Mice were injected with Matrigel supplemented with VEGF (200 pg/mL); VEGF, 8CPT (2.5μM), and isotype control antibody; or VEGF, 8CPT, and anti-CD36 (FA-152) antibody. Microvessel density was counted, as described in “Methods.” Bars show mean ± SE (n = 5). *P < .05.
Treatment of fibroblasts with 8CPT increases TSP1 production
Suppression of angiogenesis by 8CPT in the SCID mouse model was much more effective than expression of CA Rap1 in endothelial cells. Although this could be due to modest expression of CA-Rap1 in these cells (supplemental Figure 3), we wondered whether other cell types within the microenvironment might be affected by stimulation with 8CPT and therefore contribute to suppression of angiogenesis. In fibroblasts, Id1 is a negative regulator of TSP1 transcription.6 We therefore asked whether the same mechanism of Rap1-induced thrombospondin expression might also be present in fibroblasts. Indeed, treatment of human primary fibroblasts with 8CPT led to rapid and sustained activation of Rap1 (Figure 6A). Furthermore, treatment of fibroblasts with 8CPT led to a significant increase in TSP1 expression (Figure 6B). These results indicate that both endothelial cells and fibroblasts secrete TSP1 in response to Rap1 activation and therefore contribute to the inhibition of angiogenesis.
Regulation of TSP1 expression by Epac/Rap1 in fibroblasts. (A) Activation of Rap1 by 8CPT in human fibroblasts after treatment with 8CPT (100μM). Cells were treated with 100μM 8CPT, followed by cell lysis and pull-down of Rap-GTP using RalGDS-Sepharose at the indicated times (top). Quantitation was performed using LI-COR software analysis (bottom). Fold induction was calculated by Rap1-GTP/total Rap1. α-Tubulin expression is shown to indicate that total Rap1 levels do not change during the course of the experiment. Data shown are representative of 2 independent experiments. (B) Analysis of TSP1 production by human fibroblasts. Conditioned medium from cells was collected 48 hours after treatment with 8CPT (100μM) or mock treatment, centrifuged through a Centricon Plus 20 membrane to concentrate protein, and analyzed by Western blot (top). Autoradiographs were scanned, and bands were quantified using ImageJ software (bottom). Data shown are representative of 3 independent experiments.
Regulation of TSP1 expression by Epac/Rap1 in fibroblasts. (A) Activation of Rap1 by 8CPT in human fibroblasts after treatment with 8CPT (100μM). Cells were treated with 100μM 8CPT, followed by cell lysis and pull-down of Rap-GTP using RalGDS-Sepharose at the indicated times (top). Quantitation was performed using LI-COR software analysis (bottom). Fold induction was calculated by Rap1-GTP/total Rap1. α-Tubulin expression is shown to indicate that total Rap1 levels do not change during the course of the experiment. Data shown are representative of 2 independent experiments. (B) Analysis of TSP1 production by human fibroblasts. Conditioned medium from cells was collected 48 hours after treatment with 8CPT (100μM) or mock treatment, centrifuged through a Centricon Plus 20 membrane to concentrate protein, and analyzed by Western blot (top). Autoradiographs were scanned, and bands were quantified using ImageJ software (bottom). Data shown are representative of 3 independent experiments.
Discussion
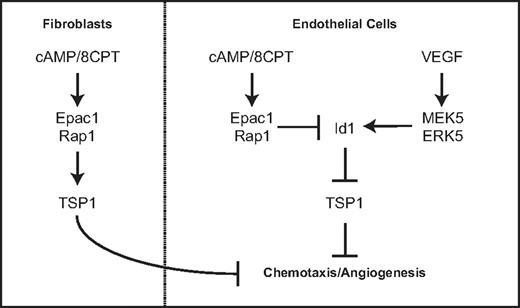
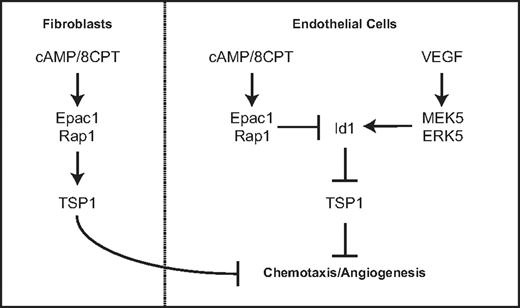
This study describes a novel function for Rap1 in endothelial cells. Our previous work defined a role for Epac and Rap1 in regulating endothelial cell morphology and chemotaxis via cAMP signaling. We demonstrate in this study that Rap1 activation can inhibit angiogenesis in 2 different in vivo models. Our results show that either pharmacologic activation of Rap1 with the cAMP analog, 8CPT, via Epac or introduction of CA Rap1 can suppress angiogenesis. The mechanism by which Rap1 inhibits chemotaxis and angiogenesis occurs, at least in part, via regulation of Id1 and TSP1, a key antiangiogenic molecule. We propose a model by which cAMP signaling via Epac1/Rap1 suppresses Id1 expression and induces TSP1 expression. This counteracts VEGF signaling via MEK5/ERK5, which induces Id1 expression and suppresses TSP1 (Figure 7). Furthermore, this signaling is coordinated in other cell types important for angiogenesis such as fibroblasts.
Model for regulation of thrombospondin expression by Epac/Rap1 and MEK5/ERK5 pathway in endothelial cells and fibroblasts.
Model for regulation of thrombospondin expression by Epac/Rap1 and MEK5/ERK5 pathway in endothelial cells and fibroblasts.
Depletion experiments with Epac1 or Epac2 suggest that both molecules help maintain baseline expression of TSP1 in endothelial cells. However, only Epac1 appears to mediate the effects of 8CPT because knockdown of Epac2 does not block induction of TSP1 by this compound. Consistently, Epac1, but not Epac2, mediates the morphologic changes induced by 8CPT in endothelial cells (data not shown);19 Epac1 and Epac2 have different cellular locations, and thus, are likely to perform different functions with respect to Rap1 activation.35,36 Overexpression of Rap1GAP causes a significant reduction in TSP1 levels, consistent with Rap1 as the downstream effector of Epac. Epac 1/2 and Rap1GAP show specificity for Rap2 as well as Rap1, and therefore, our data do not exclude a role for Rap2 in the regulation of angiogenesis.37,38
Id1 has previously been shown to regulate TSP1 gene transcription in fibroblasts using reporter constructs.6 Results in this study demonstrate that this regulation also exists in endothelial cells. Furthermore, we demonstrate that Rap1 can regulate Id1 expression. This effect is most apparent at the mRNA level and may be more difficult to detect at the protein level because of the short half-life of Id1.39 However, we also cannot exclude the possibility that Rap1 induces TSP1 independently of Id1. Similarly, although experiments using blocking antibodies to either TSP1 or its receptor, CD36, rescue the effects of activated Rap1, our data do not exclude other potential mechanism by which Rap1 may regulate angiogenesis.
We have also defined new downstream targets of the MEK5/ERK5 pathway in endothelial cell signaling. Activated MEK5/ERK5 induces expression of Id1 with a corresponding down-regulation of TSP1. This regulation is consistent with the essential role of ERK5 in angiogenesis40 and defines a new mechanism by which MEK5/ERK5 regulate angiogenesis. Although the Epac/Rap1 pathway has been previously shown to inhibit ERK5 activity in muscle cells,12 we were unable to detect any modulation of ERK5 activity by Epac/Rap1 after stimulation with VEGF. This is perhaps due to the lack of the appropriate scaffold or complex in endothelial as opposed to muscle cell types.
Recently, reports of knockout mice lacking Rap1a or Rap1b have been published and show defective angiogenesis.17,18 This is not surprising given the role Rap1 plays in cell adhesion13 and cell-cell junctions,14 functions that are crucial to formation of tubular structures. The results we report suggest that overactivation of Rap1 also suppresses angiogenesis. Taken together, these findings support the idea that angiogenesis results from a balance of pro- and antiangiogenic factors, and either extreme will have deleterious consequences.
The results demonstrating similar Rap1-mediated induction of thrombospondin in fibroblasts are consistent with an antiangiogenic role for Rap1 across multiple cell types within the microenvironment that participate in angiogenesis (Figure 7). Furthermore, TSP1 recruits vascular smooth muscle cells, which contribute to blood vessel maturation.9 It is interesting to note that cAMP induces VEGF production via PKA in fibroblasts.41 We propose that cAMP activation of the antiangiogenic Epac/Rap1 pathway may serve to balance cAMP activation of the proangiogenic signaling cascade mediated by PKA. Although we have not directly investigated the physiologic environmental ligands that stimulate these pathways, adenosine and prostaglandins are potential candidates as Epac/Rap1 activators.33,42 Taken together, these results strengthen the role of Epac/Rap1 as regulators of angiogenesis and suggest that signals leading to Rap1 activation may coordinately regulate angiogenesis in multiple cell types within the angiogenic microenvironment.
Presented in abstract form and oral presentation at the Keystone Symposia on Molecular Mechanisms of Angiogenesis in Development and Disease, Vancouver, BC, January 19, 2008.
The online version of this article contains a data supplement.
The publication costs of this article were defrayed in part by page charge payment. Therefore, and solely to indicate this fact, this article is hereby marked “advertisement” in accordance with 18 USC section 1734.
Acknowledgments
We thank Eva E. Eves for technical assistance and preparation of the manuscript.
This work was supported by a Young Investigator Award from the Cancer Research Foundation and a University of Chicago Breast Cancer Specialized Program of Research Excellence (SPORE) Developmental Research Project (R.C.D., who also received salary support as a Genentech Fellow in Hematology/Oncology at the University of Chicago); National Institutes of Health/National Institute of Dental and Craniofacial Research R01-DE15948 and R01-DE16586 (J.E.N.); National Institutes of Health/National Cancer Institute R01-CA109278 (M.R.R.); and a gift from the Cornelius Crane Trust for Eczema Research (M.R.R.).
National Institutes of Health
Authorship
Contribution: R.C.D., F.T.S.-H., J.H., A.C., B.D.Z., K.G., S.G., and M.W.L. performed experiments; Y.L. and M.K.A. provided novel reagents; R.C.D., F.T.S.-H., J.H., A.C., and M.W.L. analyzed results and made the figures; R.C.D., J.H., J.E.N., and M.R.R. designed the research; and R.C.D. and M.R.R. wrote the manuscript.
Conflict-of-interest disclosure: The authors declare no competing financial interests.
Correspondence: Robert C. Doebele, Division of Medical Oncology, Department of Medicine, MS 8117, 12801 East 17th Ave, RC1S, L18-8101A, University of Colorado Denver, Aurora, CO 80045; e-mail: robert.doebele@ucdenver.edu.



 ) normalized to α-tubulin expression (bottom). Data plotted are averages of 3 independent experiments ± SE. (C) Analysis of TSP1 protein expression in HMVECs expressing CA MEK5 or control after treatment with 8CPT. After Western blot analysis (top), quantitation was performed, as above (bottom). Data shown are representative of 2 independent experiments. (D) Detection of pERK5 in HMVECs treated with VEGF (10 ng/mL) for 5 minutes or pretreated with 8CPT (100μM) for 10 minutes, followed by VEGF treatment. Samples were analyzed by Western blotting. Data shown are representative of 2 independent experiments.