Abstract
Abstract 1215
Poster Board I-237
AHCT is standard therapy for relapsed or refractory Hodgkin Lymphoma (HL). Prognostic risk score models for HL patients receiving AHCT aim to predict post transplant outcomes based on factors measured at the time of AHCT. We performed a comparison of 3 such models from Dana-Farber Cancer Institute (DFCI), Roswell Park Cancer Institute (RPCI) and University of Minnesota (UMinn) in an independent multicenter dataset of 597 relapsed or refractory HL patients receiving AHCT from 1996-2004, reported to the CIBMTR by 150 centers.
Patient characteristics at diagnosis: 60% male, 52% stage III-IV, 59% B symptoms, 33% extranodal disease. Patient characteristics at AHCT: median (range) age 32 (7-74) years; 73% KPS≥90; 19% with extranodal disease; 39% had ≥3 prior chemotherapy regimens; 18% had resistant disease; median (range) time from diagnosis to AHCT 22 (3-238) months. High dose therapy regimens were primarily BEAM (72%) or CBV (12%) with 91% receiving peripheral blood stem cells. Progression free (PFS) and overall survival (OS) estimates at 3 years were 59% and 72%, respectively. The 3 prognostic models each measured 3 prognostic variables at AHCT that were combined into a prognostic score and assigned to a risk group (low, intermediate, high). The DFCI model risk factors were: chemo-resistant disease, KPS<90, ≥1 extranodal site; with corresponding risk groups low (0 factors), intermediate, (1 factor) and high (2-3 factors). The RPCI model risk factors were: chemo-resistant disease, KPS<90, ≥3 prior regimens with risk groups low (0-1 factor) and high (2-3 factors). The UMinn model risk factors were: chemo-resistant disease, B symptoms, not in CR at BMT with risk groups low (0-1 factor), intermediate (2 factors) and high (3 factors). Only 1 factor (chemo- resistant disease) was included in all 3 models.
We quantified the predictive capabilities of the models using Brier score (B) and R2 for each model. Brier score as a function of time is a measure of the accuracy of the model calculated as the average deviation between the predicted probabilities and the actual outcome. R2 measures goodness of fit based on the observed vs. predicted difference in the regression model. A smaller Brier score and a larger R2 indicate better predictive performance. The models are compared in Table 1 with regards to prediction of 36 month PFS:
| . | DFCI Model . | RPCI model . | UMinn model . |
|---|---|---|---|
| Brier Score | 0.2344 | 0.2360 | 0.2394 |
| R2 | 3.24% | 2.57% | 1.17% |
| . | DFCI Model . | RPCI model . | UMinn model . |
|---|---|---|---|
| Brier Score | 0.2344 | 0.2360 | 0.2394 |
| R2 | 3.24% | 2.57% | 1.17% |
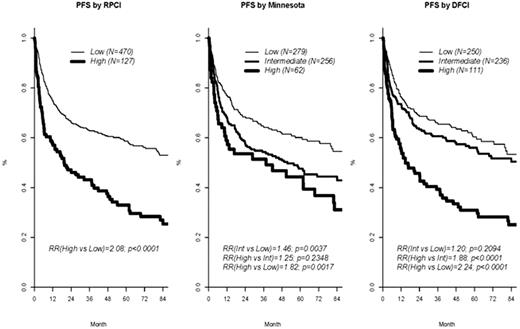
The high risk group PFS (Figure 1) was similar for the DFCI and RPCI models but the DFCI model separated a low and intermediate risk group which were not significantly different from each other. The UMinn model high risk group had a higher PFS than either of the other 2 models' high risk group and the intermediate group in this model was not significantly different from the high risk group. The relative incremental change in R2 was 26% higher for the DFCI than the RPCI model and 120% higher for the RPCI than the UMinn model. From the B and R2 values, the DFCI model had marginal superiority over RPCI model while both performed better than the UMinn model. Newer prognostic systems incorporating other prognostic variables are needed to distinguish lower and intermediate risk patients.
No relevant conflicts of interest to declare.
Author notes
Asterisk with author names denotes non-ASH members.


