Abstract
To delineate the relative roles of tumor necrosis factor-related apoptosis-inducing ligand (TRAIL) and Fas ligand in lymphocyte biology and lymphoproliferative disease, we generated mice defective in both molecules. B6.GT mice develop severe polyclonal lymphoproliferative disease because of accumulating CD3+CD4−CD8−B220+ T cells, CD4+ and CD8+ T cells, and follicular B cells, and mice die prematurely from extreme lymphocytosis, thrombocytopenia, and hemorrhage. Accumulating lymphocytes resembled antigen-experienced lymphocytes, consistent with the maximal resistance of B6.GT CD4+ and CD8+ T cell to activation-induced cell death. More specifically, we show that TRAIL contributes to Fas ligand-mediated activation-induced cell death and controls lymphocyte apoptosis in the presence of interferon-γ once antigen stimulation is removed. Furthermore, dysregulated lymphocyte homeostasis results in the production of anti-DNA and rheumatoid factor autoantibodies, as well as antiplatelet IgM and IgG causing thrombocytopenia. Thus, B6.GT mice reveal new roles for TRAIL in lymphocyte homeostasis and autoimmune lymphoproliferative syndromes and are a model of spontaneous idiopathic thrombocytopenia purpura secondary to lymphoproliferative disease.
Introduction
Apoptotic cell death is mediated primarily by 2 distinct pathways: the intrinsic mitochondrial-sensed, Bcl2-family regulated pathway and the extrinsic death-ligand/receptor pathway. Members of the tumor necrosis factor (TNF) family of death-inducing ligands, such as Fas ligand (FasL), TNF, and TNF-related apoptosis-inducing ligand (TRAIL), compose the extrinsic pathway, and these molecules bind to specific receptors that contain a “death-domain” signature in their cytoplasmic region. For FasL and TRAIL, ligand binding results in recruitment of Fas-associated death domain adaptor protein to the receptor's death domain enabling subsequent recruitment and activation of procaspase-8 and/or procaspase-10. Apical caspases then act on downstream effector caspases that leads to degradation of the inhibitor of the caspase-activated DNase, with cleavage of dsDNA causing apoptotic cell death.1 To date, however, the specific roles and redundancies of the multiple death TNF-family death ligands and receptors are unclear.
Despite the conservation in intracellular death receptor signaling, the biologic functions of TNF/TNFR molecules in vivo appear to be divergent. TNF-α is an important mediator of inflammation2 and a key cause of apoptosis of virus-infected cells,3 and FasL/Fas plays a critical role in the elimination of self-reactive lymphocytes and in regulating T cell homeostasis.4 In contrast, the physiologic role of TRAIL in vivo is still emerging. TRAIL specifically kills transformed5 and virally infected cells6 and controls tumor growth and metastasis contributing to tumor surveillance.7-10 The inert properties of LZ-TRAIL on normal cells5,11 has led to Apo2L/TRAIL protein and agonistic receptor-specific antibodies being trialed for the treatment of human cancers. However, it is debatable whether TRAIL's tumoricidal activity provides sufficient evolutionary pressure for its existence as the fourth death ligand/receptor system in humans. That cancer most frequently occurs in persons after child-bearing age and that TNF-α and FasL also have tumorigenic properties12,13 suggest that TRAIL/TRAIL-Rs mediates biologic functions that remain to be defined. Curiously, the study of TRAIL−/− mice revealed little about the roles of TRAIL in vivo as these mice are essentially physiologically normal.7 It is now apparent that, because most cells that express TRAIL also express FasL14 and because TRAIL and FasL initiate a death-signaling pathway that is almost identical,15 attempts to define the physiologic role of TRAIL/TRAIL-Rs in vivo must consider the expression of FasL. Therefore, to reveal the critical roles of TRAIL in lymphocyte biology and autoimmune lymphoproliferative syndromes, we generated mice that were defective in both FasL and TRAIL.
Methods
Mice
C57BL/6 (B6) mice, and B6.gld.gld(Smn) 15 generations B6, were obtained from The Jackson Laboratory. B6.TRAIL−/− mice,7 7 generations B6, were crossed with B6.gld/gld mice to generate heterozygous mice, which were interbred to produce B6.gld/gld.TRAIL−/− (B6.GT) mice. Mice were housed under standard specific pathogen-free conditions originally at the Immunex Animal Facility or conventional animal housing conditions at the Westmead Millennium Institute and the University of Technology Sydney. Mice were bred and used in accordance with institutional animal ethics committee approvals from the Westmead Millennium Institute and the University of Technology Sydney. The FasL gld allele16 is genotyped by polymerase chain reaction (PCR) using primer gld-A: 5′TCTCAACTCTCTCTGATCAATTTTGAGGAATCTAAGGCC-3′ and gld-B: 5′-CTCTCATTCAAGAAATATTCCTG-3′ where a StuI restriction site is created by the mutation and primer. TRAIL gene-specific PCR was performed with the following primers: 5′-AAAGACGGATGAGATTTCTGGG-3′, 5′-GACAGAACACCATATTGCTGGCG-3′, 5′-CTTGTGTAGCGCCAAGTGCCAG-3′, and 5′-CAAAGGTCTAATGAGGAACATTG-3′ (supplemental Figure 1A, available on the Blood Web site; see the Supplemental Materials link at the top of the online article).
Antibodies and flow cytometry
Single-cell suspension of splenocytes and bone marrow leukocytes was prepared by NH4Cl erythrocyte lysis. Nonspecific antibody binding was blocked with 1% normal goat serum, 1% normal rat serum, and 2.4G2 anti-FcRII/III blocking antibody; then cells were incubated in DMEM10 containing various combinations of antibodies: fluorescein isothiocyanate (FITC)–, phycoerythrin (PE)–, peridinin chlorophyll protein (PerCP)–, PE-Cy7-, allophycocyanin (APC)–, APC-Cy7-, Pacific blue-, or biotin-conjugated anti–mouse CD3ϵ (clone 145-2C11), CD4 (clone L3T4, or RM4-5), CD8 (clone 53-6.7), CD11b (clone M1/70), CD11c (clone HL3), CD19 (clone 1D3), CD21 (clone 7G6), CD23 (clone B3B4), CD41 (clone MWreg30) CD45R/B220 (clone RA3-6B2), CD61 (clone 2C9.G2), CD122 (cloneTM-β1), Gr-1 (clone RB6-8C5), NK1.1 (clone PK136), TCRVβ (clone H57-597; all BD Biosciences PharMingen), anti–mouse IgM-PE (Southern Biotechnology), or isotype control antibodies. Biotin-conjugated antibodies were detected with streptavidin (SA)–PE, SA-APC (BD Biosciences PharMingen), or SA-Pacific orange (Invitrogen). Murine Fas and Killer/DR5 were detected on anti–T cell receptor β (TCRVβ 10 μg/mL) and anti-CD28 (10 μg/mL) stimulated splenocytes with biotinylated anti–murine Fas (clone Jo2) or anti–Killer/DR5 (clone MD5-1) followed by streptavidin-PE (BD Biosciences PharMingen). TCRVβ gene usage by T cells and double-negative (DN) T cells was determined with CD3−, CD4−, CD8−, and B220− diluted directly into the following murine Vβ-specific FITC-conjugated antibodies: anti–Vβ2, 3, 4, 6, 7, 8.1 + 8.2, 8.3, 9, 10b, 11, 12, 13, 14, and 17a (BD Biosciences PharMingen). Activation status was assessed using PE- or biotin-conjugated anti–murine CD25 (clone 7D4, or PC61), CD44 (clone IM7), CD54 (clone 3E2), CD62L (clone MEL-14), CD69 (clone H1.2F3; all BD Biosciences PharMingen), or biotinylated anti–murine CCR7 (clone 4B12; eBioscience) and compared with isotype control antibody staining. Bone marrow megakaryocytes were analyzed on singlet bone marrow leukocytes with large forward scatter (FWD) and high CD41 and CD61. Flow cytometry was performed on a Becton Dickinson FACSCalibur or LSRII flow cytometer, and data were analyzed with CellQuestPro (Version 0.3.8f2b; BD Biosciences) or DIVA (Version 6.1.2; BD Biosciences) software. Usually, 30 000 events were collected; but for TCR expression and bone marrow megakaryocyte analysis, 100 000 events were collected. Sorting was performed using a FACSVantage (BD Biosciences).
TNF-α expression
Reverse-transcribed (RT)–PCR was performed as described previously,7 on fluorescence-activated cell sorter (FACS)–sorted purified splenic IgM+ B cells, CD3+ T cells, or IgM−CD3+B220+ DN T cells, or peritoneal exudate cells, using the following primers: MuTNF-α-A, 5′-CTTCTCAAAATTCGAGTGACAAGCC-3′; and MuTNF-α-B, 5′-AAGTTCCCAAATGGCCTCCCTC-3′; MuFasL-A, 5′-GAGAGAGTTGAGATATGTTGACATAT-3′; and MuFasL-B, 5′-CCTGCAGAAGGAACTGGCAGAA-3′; TRAIL-A, 5′-GTACTTCACCAACGAGATGAAGCA-3′; and TRAIL-B, 5′-AGAGCACGTGGTTGAGAAATGTA-3′; and GAPDH-A, 5′-AAGGGTGGAGCCAAACGGGTCAT-3′; and GAPDH-B, 5′-AACACGGAAGGCCATGCCAGTG-3′. Serum TNF-α protein was detected using the Quantikine ELISA (R&D Systems).
Pathology and TCR spectratyping
Blood samples from old mice were analyzed at the Institute for Clinical Pathology & Medical Research, Westmead Hospital. Freshly harvested tissues were fixed in formalin and processed for paraffin embedding using standard techniques. Tissue sections (5 μm) were stained with hematoxylin and eosin. Blood and megakaryocytes were detected with Wright Giemsa stain. TCR CDR3 gene usage was determined by RT-PCR, using Vβ-specific PCR, and CDR3 spectratyping was performed with a second round of PCR using 1 μL of PCR product from each TCRVβ, with FAM-labeled universal constant region primer, as described previously.17
Lymph node T cell AICD assays
Axillary, brachial, and inguinal lymph nodes were pooled from naive 4- to 5-week-old-mice and cultured on 10 μg/mL plate-bound agonistic anti-TCRVβ (clone H57-597), anti-CD28 (clone 37.51) antibodies, or isotype control Ig hamster IgG1κ (all BD Biosciences PharMingen) for 72 hours in 10 ng/mL recombinant murine interleukin-2 (IL-2; R&D Systems). Live cells were purified with Lympholyte-M (Cederlane Pty Ltd) and recultured for 24 hours in 10 ng/mL recombinant murine IL-2, IL-7, IL-15, or interferon-γ (IFN-γ; all R&D Systems). T cell blasts were then restimulated for 48 hours with plate-bound TCRVβ, or CD28 antibodies, or isotype control Ig plus cytokines, in triplicate wells of 96-well culture plates. Nonspecific binding was blocked as described above, and cells were incubated with CD4-Pacific blue or CD8-PE-Cy7 conjugated antibodies, and then incubated in annexin V-FITC and propidium iodide.
Autoantibody detection
Enzyme-linked immunosorbent assay (ELISA) plates were coated with 50 μL/well of 10 μg/mL sheered herring sperm DNA, rabbit Ig, or mouse IgG2a purified antibody. Plates were blocked overnight with 10% fraction-V bovine serum albumin (Sigma-Aldrich) in phosphate-buffered saline (PBS), and incubated with 100 μL/well of 2-fold serial dilutions of mouse serum in PBS. Serum IgM and IgG were detected with alkaline phosphatase-conjugated goat-anti–mouse IgG or goat-anti–mouse IgM antibodies (Southern Biotechnology) and p-nitrophenyl-phosphate substrate, washing 3 to 5 times with PBS with Tween-20 between each step. The endpoint titer was defined as the dilution with reactivity more than 3 SDs above background.
Platelets were purified from mouse blood collected in acid-citrate dextrose anticoagulant and centrifuged at 960g for 5 minutes. Platelets in acid-citrate dextrose platelet-rich plasma were further centrifuged at 2700g for 10 minutes, resuspended in Tyrode buffer containing 1% normal goat serum and 2.4G2 anti–murine FcRII/III blocking antibody, and incubated in 100 μL of 1/20 dilution of mouse serum, and then anti–IgG-FITC and anti–IgM-PE. Platelets were subsequently incubated with CD41-PECy7 and CD61-biotinylated antibody and then SA-APC and fixed in 2% paraformaldehyde/PBS. Platelet events were collected with side scatter (SSC) and FWD set on log scale and SSC/FWD scatter plots gated for less than 0.1% overlap with electronic noise when running saline.
Immunofluorescence histology detection of kidney-deposited antibody was performed on tissue sections incubated with 2% normal goat serum and then anti–mouse IgM-Texas red or anti–mouse IgG-FITC (BD Biosciences PharMingen).
Image acquisition
Bone marrow smears were prepared, air dried, fixed with 70% ethanol, stained with rapid Wright-Geimsa staining reagent (Delasco), and examined using a BX51 Olympus microscope (100×/1.30 oil objective). Images were captured with DP Controller software (Version 1.2.1.108).
Statistical analysis
Data were graphed and statistically analyzed using GraphPad Prism (Version 5) software. In all cases, a 1-way analysis of variance statistical analysis was performed with Bonferroni comparison test (P < .05, unless otherwise stated).
Results
Exacerbated LPD in B6.gld/gld.TRAIL−/− (B6.GT) mice
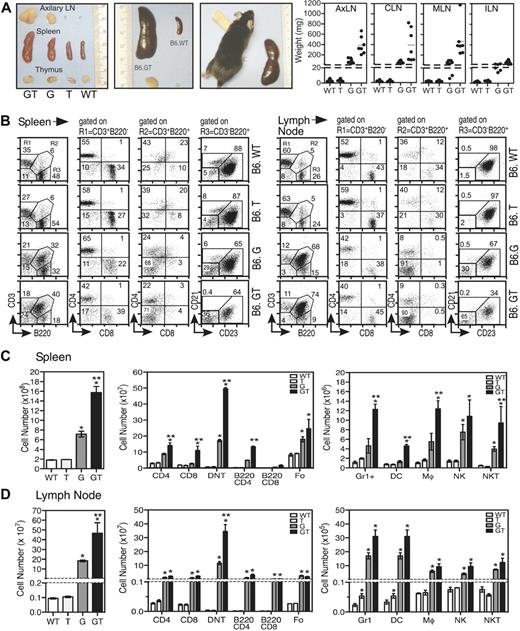
Cohorts of sex-matched B6.GT mice were aged together and directly compared with B6.WT, B6.TRAIL−/− (B6.T), and B6.gld/gld (B6.G) mice. By 5 weeks of age, there were no signs of aberrant lymphocyte homeostasis in immune tissues in any strains; indeed, blood biochemistry and hematology analysis appeared normal (data not shown). However, examination of 15-week-old mice revealed significant splenomegaly and lymphadenopathy in B6.GT mice compared with B6.gld/gld mice, whereas, as expected, B6.WT and B6.TRAIL−/− mice appeared normal7 (Figure 1A). Although lymphadenopathy was evident in virtually all peripheral lymph nodes of B6.GT mice, it was most severe in cervical, mesenteric, and axillary lymph nodes (Figure 1A, and data not shown), probably reflecting exposure to dietary and environmental antigens.
Analysis of immunologic organs of B6.GT mice. (A) Gross thymus, lymph node, and spleen organ size in age-matched B6.WT, B6.TRAIL−/−, B6.gld/gld, and B6.GT mice. Figures show 1 mouse per strain, with 5 or more mice per strain analyzed, as indicated in lymph node weight data. (B) Percentage of conventional CD3+B220− T cells (R1), as well as CD3+B220+ (R2) CD4−CD8−“double negative” T cells (DN T cells) and CD3−B220+ B cells as CD21−CD23+ follicular (Fo) B cells, CD21+CD23− marginal zone (MZ) B cells, and CD21−CD23− nonfollicular (NF) B cells in spleen and axillary lymph nodes of 3 age- and sex-matched B6.WT, B6.TRAIL (B6.T), B6.gld/gld (B6.G), and B6.gld/gld.TRAIL−/− (B6.GT) mice. FACS data (dot plots) shown are from 1 representative mouse of 3 age- and sex-matched mice per strain. (C-D) Total leukocyte cellularity and absolute numbers of T cell, B cell, and DN T cell leukocyte subsets calculated from dot plots in panel B. Numbers of non T and B cells were determined by gating first on CD3−B220− cells and subsequently on Gr1+, CD11c+, or NK1.1+ cells, whereas NKT cells were defined from within the CD3+B220− cells that expressed NK1.1. Data shown are mean plus or minus SD of each tissue from 3 mice per strain. Statistical significance was assessed using Mann-Whitney analysis, with differences between B6.gld/gld or B6.GT compared with B6.WT (*P < .05) and between B6.G and B6.GT (**P < .05).
Analysis of immunologic organs of B6.GT mice. (A) Gross thymus, lymph node, and spleen organ size in age-matched B6.WT, B6.TRAIL−/−, B6.gld/gld, and B6.GT mice. Figures show 1 mouse per strain, with 5 or more mice per strain analyzed, as indicated in lymph node weight data. (B) Percentage of conventional CD3+B220− T cells (R1), as well as CD3+B220+ (R2) CD4−CD8−“double negative” T cells (DN T cells) and CD3−B220+ B cells as CD21−CD23+ follicular (Fo) B cells, CD21+CD23− marginal zone (MZ) B cells, and CD21−CD23− nonfollicular (NF) B cells in spleen and axillary lymph nodes of 3 age- and sex-matched B6.WT, B6.TRAIL (B6.T), B6.gld/gld (B6.G), and B6.gld/gld.TRAIL−/− (B6.GT) mice. FACS data (dot plots) shown are from 1 representative mouse of 3 age- and sex-matched mice per strain. (C-D) Total leukocyte cellularity and absolute numbers of T cell, B cell, and DN T cell leukocyte subsets calculated from dot plots in panel B. Numbers of non T and B cells were determined by gating first on CD3−B220− cells and subsequently on Gr1+, CD11c+, or NK1.1+ cells, whereas NKT cells were defined from within the CD3+B220− cells that expressed NK1.1. Data shown are mean plus or minus SD of each tissue from 3 mice per strain. Statistical significance was assessed using Mann-Whitney analysis, with differences between B6.gld/gld or B6.GT compared with B6.WT (*P < .05) and between B6.G and B6.GT (**P < .05).
Although thymus cellularity was normal (data not shown), spleens and lymph nodes of 15-week-old B6.GT mice contain large numbers of CD4−CD8−CD3+TCR+B220+ DN T cells, as well as conventional CD4+ and CD8+ T cells compared with B6.gld/gld mice (Figure 1B-C, and data not shown). The DN T cells express B220 but not IgM or NK.1.1, and approximately 30% of DN T cells also express Gr1/Ly6G (data not shown). B220 is also expressed on many of the CD4+ and CD8+ conventional T cells (Figure 1C). In addition, B6.GT mice contained more CD21loCD23+ follicular CD3−B220+ B cells than age-matched to B6.gld/gld mice (Figure 1C), although CD21+CD23− marginal zone B cells were not significantly increased (data not shown). There was also an increase in Gr1/Ly6G+ (non DN T) cells as well as CD11b+CD11c− macrophages and CD11c+ dendritic cells, and significantly more lymph node NK T cells in B6.GT mice compared with the other strains (Figure 1C), but further dendritic cells and NK T cell specific analysis is required to enumerate subpopulations of these cells. Therefore, B6.GT mice exhibit an exacerbated lymphoproliferative disease (LPD) compared with age-matched B6.gld/gld mice, indicating an unappreciated role for TRAIL in regulating lymphocyte homeostasis.
Exacerbated LPD is unrelated to TNF-α expression levels
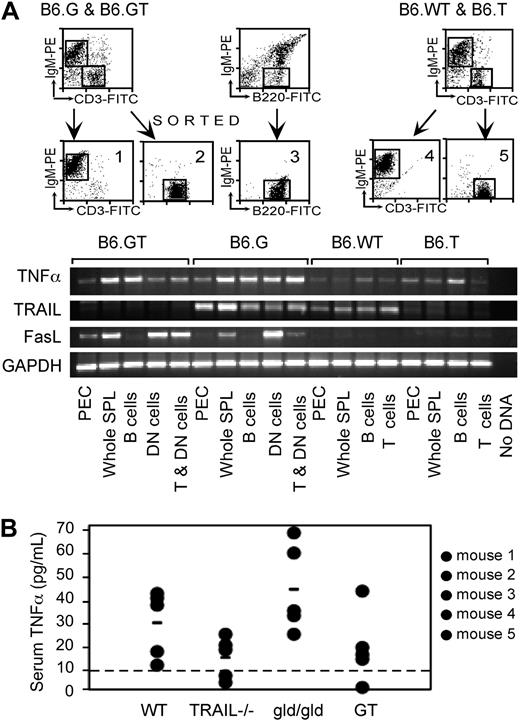
It is known that TNF-α influences the extent of LPD in B6.gld/gld,18,19 and hence increased TNF-α might compensate for defective FasL and TRAIL and explain exacerbated LPD in B6.GT mice. Therefore, TNF-α levels were assessed in 10- to 12-week-old B6.GT mice. TNF-α mRNA was increased in specific populations of cells from B6.gld/gld mice compared with B6.WT or B6.TRAIL−/− mice, but this was not further increased in cells from B6.GT mice (Figure 2A). Moreover, serum TNF-α protein levels were highest in age-matched B6.gld/gld mice rather than B6.GT mice and lowest in B6.WT or B6.TRAIL−/− mice (Figure 2B). Thus, either on a per-cell basis or on an individual animal basis, TNF-α is expressed in highest levels in B6.gld/gld mice rather than B6.GT mice. Therefore, exacerbated LPD in B6.GT mice is not the result of altered TNF-α expression. Interestingly, increased levels of TRAIL mRNA were evident in B6.gld/gld cells compared with other strains (Figure 2A), suggesting both that TRAIL is linked to FasL-control of lymphocytes and that compensatory mechanisms might exist between death-inducing TNF-family ligand/receptor systems in vivo.
TNF-α expression in B6.GT mice. (A) RNA was purified from 106 FACS sort-purified murine spleen IgM+ B cells, CD3+ conventional T cells, or IgM−CD3+B220+ DN T cells, or from peritoneal exudate cells (PEC), for assessment of TNF-α, TRAIL, FasL, and GAPDH mRNA levels by conventional semiquantitative RT-PCR. Data shown are representative of 2 independently repeated PCR analyses for each mRNA. (B) Serum TNF-α protein assessed by ELISA assay and quantitated relative to a recombinant murine TNF-α as a standard, with the limit of detection of TNF-α protein of approximately 10 pg/mL (line). Data shown are representative of an independently repeated TNF-α ELISA.
TNF-α expression in B6.GT mice. (A) RNA was purified from 106 FACS sort-purified murine spleen IgM+ B cells, CD3+ conventional T cells, or IgM−CD3+B220+ DN T cells, or from peritoneal exudate cells (PEC), for assessment of TNF-α, TRAIL, FasL, and GAPDH mRNA levels by conventional semiquantitative RT-PCR. Data shown are representative of 2 independently repeated PCR analyses for each mRNA. (B) Serum TNF-α protein assessed by ELISA assay and quantitated relative to a recombinant murine TNF-α as a standard, with the limit of detection of TNF-α protein of approximately 10 pg/mL (line). Data shown are representative of an independently repeated TNF-α ELISA.
B6.GT mice have reduced survival and altered breeding
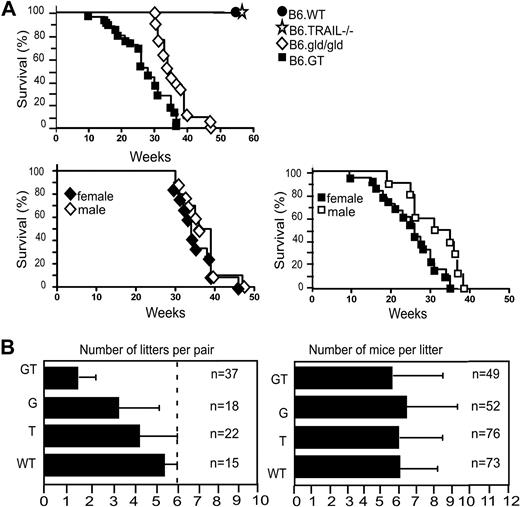
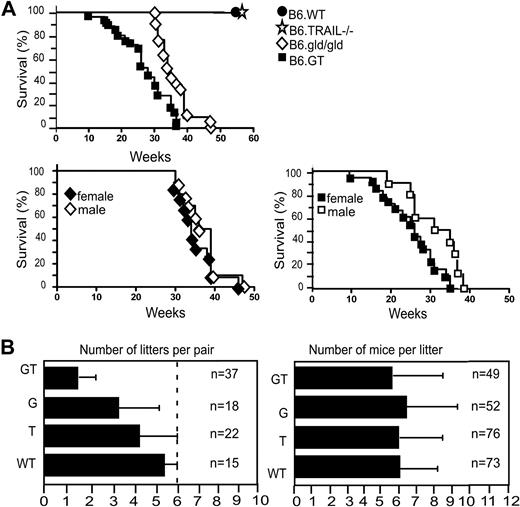
The LPD in B6.GT mice is very severe, and some mice die suddenly from as early as 10 to 12 weeks of age, with all mice dying by 38 to 40 weeks of age, significantly earlier than B6.gld/gld mice in our colony (Figure 3A). Moreover, it was notable that female B6.GT mice died younger than male mice, although this was not the case in B6.gld/gld mice (Figure 3A). B6.GT mice also exhibited impaired breeding because, even allowing for postpartum mating, B6.GT breeder pairs rarely generated more than 3 litters (Figure 3B). Autopsy examination of older nonproductive female B6.GT breeder mice found partially resorbed fetus, indicating that these mice conceive but fail to reach term. However, when litters are produced, the number of pups per litter is similar across all strains (Figure 3B).
Survival and breeding potential. (A) Mice were monitored from birth, until their sudden death, or until they were killed (having become moribund), in full accordance with Western Sydney Area Health Service institutional animal ethics guidelines. Kaplan-Meier graphs were plotted with survival data from 10 B6.WT, 12 B6.TRAIL−/−, 21 B6.gld/gld, and 25 B6.GT mice. Data were analyzed with log-rank test that indicated a statistically significant difference of P < .001 between B6.G and B6.GT. A statistically significance difference (P = .012) was also evident between female versus male B6.GT mice, but no significant difference was found for male versus female B6.gld/gld (P = .233). (B) Breeding potential was assessed by reviewing the number of litters per breeder pair and number of mice per litter, with data from long-term breeding records over 4 years. Male and female mice were mated at approximately 6 to 7 weeks of age, with pups weaned at approximately 3 weeks of age, and male mice were left with their female partners to allow postpartum mating.
Survival and breeding potential. (A) Mice were monitored from birth, until their sudden death, or until they were killed (having become moribund), in full accordance with Western Sydney Area Health Service institutional animal ethics guidelines. Kaplan-Meier graphs were plotted with survival data from 10 B6.WT, 12 B6.TRAIL−/−, 21 B6.gld/gld, and 25 B6.GT mice. Data were analyzed with log-rank test that indicated a statistically significant difference of P < .001 between B6.G and B6.GT. A statistically significance difference (P = .012) was also evident between female versus male B6.GT mice, but no significant difference was found for male versus female B6.gld/gld (P = .233). (B) Breeding potential was assessed by reviewing the number of litters per breeder pair and number of mice per litter, with data from long-term breeding records over 4 years. Male and female mice were mated at approximately 6 to 7 weeks of age, with pups weaned at approximately 3 weeks of age, and male mice were left with their female partners to allow postpartum mating.
Early lethality resulting from extreme LPD and thrombocytopenia
Postmortem autopsy of euthanized moribund mice or recently deceased mice suggested that death was the result of overwhelming lymphoproliferative crisis and hemorrhage. To ascertain the specific cause(s) of death, hematologic assessment was performed on peripheral blood of mice 20 or more weeks old. Approximately 66% (10 of 15) of aged B6.GT mice exhibited severe lymphocytosis, which occurred in less than 50% of age-matched B6.gld/gld mice (Figure 4A). There was a high incidence of extreme thrombocytopenia in aged B6.GT mice (Figure 4A) that correlated with anecdotal observations of failure of blood clotting on bleeding mice via the tail vein and/or the evidence of hemorrhage detected at autopsy. Thrombocytopenia was also evident in B6.gld/gld mice, but to a lesser extent (Figure 4A). Some B6.GT mice also appeared to hyperventilate before becoming moribund, at which point they were killed. Histologic examination of lungs revealed extensive lymphocytic infiltrates in B6.GT, but not B6.gld/gld, B6.TRAIL−/− or B6.WT, mice (Figure 4B). Large perivascular lymphocytic infiltrates were also evident in liver and other tissues (data not shown). Moreover, thoracic and mediastinal lymph nodes were dramatically enlarged in B6.GT mice, probably causing pressure on the respiratory tract. Thus, B6.GT mice die prematurely from complications of severe LPD: catastrophic hemorrhage, lymphocytosis, thrombocytopenia, and respiratory distress resulting from infiltrating lung lymphocytes and extreme mediastinal lymphadenopathy.
Hematologic assessed of B6.GT mice. (A) Peripheral blood hematology analysis of mouse blood collected from individual B6.WT (n = 7), B6.TRAIL−/− (n = 8), B6.gld/gld (n = 16), and B6.GT (n = 15) mice, more than 20 weeks of age. Blood was collected from freshly killed mice directly from the inferior vena cava into 5 mL potassium K2-EDTA acid-coated blood collection tubes and analyzed within 4 hours of collection on an ADIVA120 Hematology System analyzer. Each symbol differentiates an individual mouse across all hematologic parameters assessed. The normal range of each parameter in mouse blood is shown (dashed lines). (B) Lung histology. Hematoxylin and eosin staining of formalin-fixed paraffin-embedded lung tissues. Shown are sections of lung tissue from 1 representative B6.WT, B6.TRAIL−/−, B6.gld/gld, and B6.GT mouse, and data are representative of repeated analysis of independently generated mouse cohorts. (C) Assessment of T cell and DN T cell clonality as determined by conventional RT-PCR of Vβ-specific TCR CDR3 mRNAs, using RNA obtained from mouse bone marrow (BM), axillary lymph node (LN), and peripheral blood leukocytes (PBL) from a representative mouse 20 weeks of age or older from each strain, or from 7 B6.GT mice. Broad clonality was confirmed using spectratyping analysis on each PCR product. Spectratyping data shown are from PBL TCR Vβ-specific RT-PCR products, with the correlating total white cell counts for the individual mouse, as indicated.
Hematologic assessed of B6.GT mice. (A) Peripheral blood hematology analysis of mouse blood collected from individual B6.WT (n = 7), B6.TRAIL−/− (n = 8), B6.gld/gld (n = 16), and B6.GT (n = 15) mice, more than 20 weeks of age. Blood was collected from freshly killed mice directly from the inferior vena cava into 5 mL potassium K2-EDTA acid-coated blood collection tubes and analyzed within 4 hours of collection on an ADIVA120 Hematology System analyzer. Each symbol differentiates an individual mouse across all hematologic parameters assessed. The normal range of each parameter in mouse blood is shown (dashed lines). (B) Lung histology. Hematoxylin and eosin staining of formalin-fixed paraffin-embedded lung tissues. Shown are sections of lung tissue from 1 representative B6.WT, B6.TRAIL−/−, B6.gld/gld, and B6.GT mouse, and data are representative of repeated analysis of independently generated mouse cohorts. (C) Assessment of T cell and DN T cell clonality as determined by conventional RT-PCR of Vβ-specific TCR CDR3 mRNAs, using RNA obtained from mouse bone marrow (BM), axillary lymph node (LN), and peripheral blood leukocytes (PBL) from a representative mouse 20 weeks of age or older from each strain, or from 7 B6.GT mice. Broad clonality was confirmed using spectratyping analysis on each PCR product. Spectratyping data shown are from PBL TCR Vβ-specific RT-PCR products, with the correlating total white cell counts for the individual mouse, as indicated.
The disseminated lymphocytosis phenotype of B6.GT mice is consistent with a diagnosis of chronic lymphocytic leukemia or disseminated lymphoma. To confirm or exclude this diagnosis, lymphocyte clonality of accumulating T cells was assessed. First, TCR expression was assessed with TCR-specific antibodies in 10- to 12-week-old mice. At this age, both CD3+B220− T cells and CD3+B220+ DN (CD4− CD8−) T cells in spleens of B6.GT mice displayed a broad range of surface Vβ TCR expression as detected by flow cytomtery, indicating broad T cell clonal diversity (data not shown). In addition, peripheral blood, lymph node, and bone marrow leukocytes from 25-week-old mice were examined by RT-PCR and TCR spectratyping. This molecular analysis demonstrated that B6.GT immune tissues contain a full spectrum of TCR clonotypes, even in old B6.GT mice (Figure 4C), and no evidence of clonal outgrowths (Figure 4C). Thus, B6.GT mice develop an extremely severe polyclonal LPD, and mice die prematurely from hematologic complications, including lymphocytosis and thrombocytopenia, but not from fatal T cell lymphoma or leukemia per se.
LPD consists of an accumulation of antigen-experienced lymphocytes
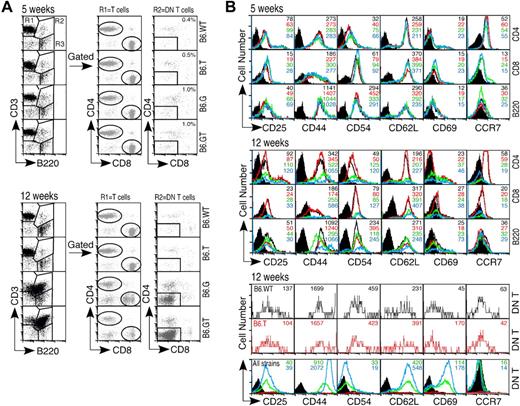
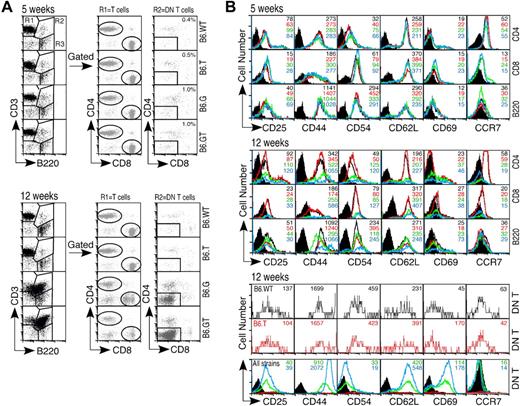
The T cell dominance of the lymphoproliferative phenotype of B6.GT mice indicated defective control of T lymphocyte homeostasis. To determine whether this represented loss of control of naive T cells or mature memory T cells, T cell activation antigens were examined simultaneously in 5-week-old (young) and 12-week-old (old) mice. Interestingly, CD8lo cells exist in lymph nodes from B6.G mice, but these were not present in B6.GT lymph nodes, and CD4 expression was unaltered (Figure 5A). CD4+ and CD8+ lymph node T cells from all strains expressed similar levels of CD25, CD44, CD54, CD62L, CD69, and CCR7 (Figure 5B). However, T cells from older B6.GT mice were CD44hi, CD54hi but CCR7− (Figure 5B). DN T lymph node lymphocytes are rare in B6.WT or B76.TRAIL−/− lymph nodes (Figure 5A); and being CD44+ CCR7+, they are naive but activated cells (Figure 5B). In contrast, DN T cells from older B6.GT mice are CD44hi CD62hi CD69hi CD54lo and CCR7− (Figure 5B). B cells from older B6.GT mice were CD44hi CD54hi, and some were CD69hi (Figure 5B). Therefore, accumulating B, T, and DN T lymphocytes in B6.GT mice are previously antigen-activated or antigen-experienced lymphocytes.
Lymphocyte activation marker expression. Axillary lymph node lymphocytes from 5- and 12-week-old mice were assessed for expression of activation status molecules using multicolor flow cytometry. (A) Lymphocytes were gated first on CD3+B220− (R1) and CD4 or CD8 to designate mature peripheral conventional T lymphocyte subsets, or on CD3+B220+ (R2) and then CD4−CD8− DN T cells, or on CD3−B220+ (R3) B cells. (B) Expression of CD25, CD44, CD54, CD62L, CD69, and the chemokine receptor CCR7 was determined on each of these lymphocyte subsets. Data shown are histogram overlays with mean fluorescent intensity of individual histograms, indicating relative expression levels of each activation-status molecule on young (5-week-old) or older (12-week-old) B6.WT (black unfilled histogram), B6.TRAIL−/− (red unfilled histogram), B6.gld/gld (unfilled green histogram), and B6.GT (blue unfilled histogram). Data are shown compared with B6.WT control Ig-stained cells (black filled histograms) for CD4+, CD8+, and B200+ cells, or B6.G control stained DN T cells (black filled histograms). Data shown are representative of repeated analysis of independently generated mouse cohorts.
Lymphocyte activation marker expression. Axillary lymph node lymphocytes from 5- and 12-week-old mice were assessed for expression of activation status molecules using multicolor flow cytometry. (A) Lymphocytes were gated first on CD3+B220− (R1) and CD4 or CD8 to designate mature peripheral conventional T lymphocyte subsets, or on CD3+B220+ (R2) and then CD4−CD8− DN T cells, or on CD3−B220+ (R3) B cells. (B) Expression of CD25, CD44, CD54, CD62L, CD69, and the chemokine receptor CCR7 was determined on each of these lymphocyte subsets. Data shown are histogram overlays with mean fluorescent intensity of individual histograms, indicating relative expression levels of each activation-status molecule on young (5-week-old) or older (12-week-old) B6.WT (black unfilled histogram), B6.TRAIL−/− (red unfilled histogram), B6.gld/gld (unfilled green histogram), and B6.GT (blue unfilled histogram). Data are shown compared with B6.WT control Ig-stained cells (black filled histograms) for CD4+, CD8+, and B200+ cells, or B6.G control stained DN T cells (black filled histograms). Data shown are representative of repeated analysis of independently generated mouse cohorts.
Failure of AICD in B6.GT CD4 and CD8 T cells
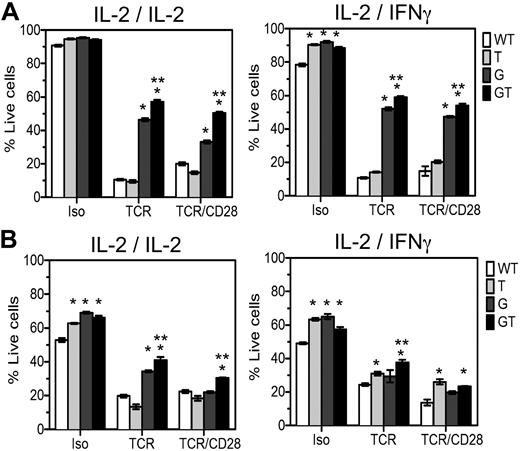
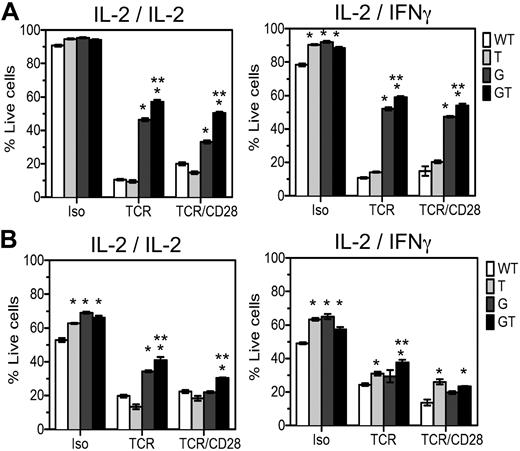
To define independent or overlapping roles of FasL and TRAIL in T cell homeostasis and to explain the exacerbated LPD in B6.GT versus B6.gld/gld mice, 4- to 5-week-old naive CD4 and CD8 lymph node T cells were examined in activation-induced cell death (AICD) assays. In the presence of IL-2, B6.WT and B6.TRAIL−/− cells were killed by AICD processes, whereas FasL-mutant B6.gld/gld CD4+ T cells were significantly resistant to this form of T cell death (Figure 6A), and compound mutations in both FasL and TRAIL resulted in further resistance to TCR- or TCR- and CD28-induced AICD (Figure 6A). Thus, TRAIL plays a cooperative role with FasL to maximally induce CD4 T cell AICD. To further identify any TRAIL-dependent FasL-independent effects in AICD, the assays were repeated with IL-2 family cytokines IL-4, IL-7, or IL-15, but no clear FasL-independent role for TRAIL could be demonstrated (data not shown). Because TRAIL is an IFN-regulated gene, the assay was repeated in IFN-γ. The effect of TRAIL cooperating with FasL was again evident; but in the presence of IFN-γ, TRAIL deficiency increased the survival of control Ig-stimulated cells (Figure 6A). Thus, in the presence of IFN-γ, TRAIL plays a role in CD4+ T cell AICD once TCR stimulation is removed or TRAIL-deficient cells have increased viability. The CD8+ T cells within these same cultures were also assessed and in this case IL-2–stimulated CD8+ T cells undergo FasL/Fas-mediated TCR-induced AICD, and again TRAIL cooperates with FasL because deficiency in both molecules results in maximal resistance to TCR and CD28-induced AICD (Figure 6B). However, TRAIL deficiency alone conferred resistance of CD8+ T cells to TCR-, and TCR- and CD28-induced AICD in the presence of IFN-γ (Figure 6B), and a further TRAIL-dependent, FasL-independent effect was evident in CD8+ T cells stimulated with control Ig. Thus, TRAIL cooperates with FasL to mediate T cell AICD and acts independently of FasL to regulate lymphocyte survival of CD8+ T cells in IFN-γ, especially once antigen-stimulation is removed.
AICD of lymph node T cells from B6.GT mice. Lymphocyte blasts were prepared from single cell suspensions of pooled axillary and brachial lymph node lymphocytes from B6.WT, B6.TRAIL−/−, B6.gld/gld, or B6.GT naive 5-week-old mice. Cells were cultured for 3 days on TCRVβ- and CD28-agonistic antibody-coated tissue culture plates and restimulated for 48 hours with isotype control, TCRVβ-, or TCRVβ- and CD28-agonistic antibodies in the presence of recombinant murine IL-2 or recombinant murine IFN-γ during the primary or secondary culture, as indicated. Cells were harvested and incubated with CD4-Pacific blue or CD8-PECy7-conjugated antibodies and stained with propidium iodide and annexin V-FITC and analyzed by flow cytometry. Data are the mean percentage of propidium iodide-negative annexin V-negative live cells plus or minus SD of triplicate cultures of (A) CD4+ T cells or (B) CD8+ T cells. AICD data were analyzed by 1-way analysis of variance, and significant differences (P < .05) relative to B6.WT cells (*) or relative to AICD of B6.gld/gld cells (**) are as indicated. Data shown are representative of repeated experiments on cells from independently generated mouse cohorts.
AICD of lymph node T cells from B6.GT mice. Lymphocyte blasts were prepared from single cell suspensions of pooled axillary and brachial lymph node lymphocytes from B6.WT, B6.TRAIL−/−, B6.gld/gld, or B6.GT naive 5-week-old mice. Cells were cultured for 3 days on TCRVβ- and CD28-agonistic antibody-coated tissue culture plates and restimulated for 48 hours with isotype control, TCRVβ-, or TCRVβ- and CD28-agonistic antibodies in the presence of recombinant murine IL-2 or recombinant murine IFN-γ during the primary or secondary culture, as indicated. Cells were harvested and incubated with CD4-Pacific blue or CD8-PECy7-conjugated antibodies and stained with propidium iodide and annexin V-FITC and analyzed by flow cytometry. Data are the mean percentage of propidium iodide-negative annexin V-negative live cells plus or minus SD of triplicate cultures of (A) CD4+ T cells or (B) CD8+ T cells. AICD data were analyzed by 1-way analysis of variance, and significant differences (P < .05) relative to B6.WT cells (*) or relative to AICD of B6.gld/gld cells (**) are as indicated. Data shown are representative of repeated experiments on cells from independently generated mouse cohorts.
Uncontrolled LPD results in spontaneous early-onset fatal autoimmunity
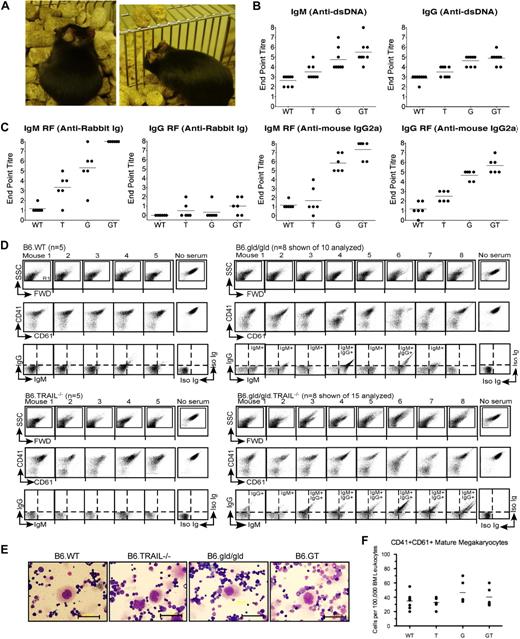
Uncontrolled lymphocytosis can result in autoimmunity resulting from low-affinity self-reactive lymphocytes, and 75% to 80% of older B6.GT mice spontaneously developed a cutaneous skin lesions beginning on the posterior neck or ears and progressing deep into the tissues and ear pinna (Figure 7A). Histologic examination demonstrated tissue destruction with lymphocytic infiltrates but no bacterial or fungal microorganisms or other evidence of infection. Skin lesions are known to occur in B6.gld/gld mice, but they are evident in only 10% of age-matched B6.gld/gld mice in our facility, usually not involving the ear pinna, consistent with inflammatory skin lesions in caspase-8−/− mice.20 Thus, a high proportion of B6.GT mice developed autoimmune dermatitis.
Autoantibody production in B6.GT mice. (A) Spontaneous autoimmune skin lesions and ear pinna erosion in old B6.GT mice. (B) IgM and IgG anti–double-stranded DNA-specific autoantibodies in serum from 5 age-matched female B6.WT, B6.TRAIL−/−, B6.gld/gld, and B6.GT mice. Shown are endpoint titers of individual mouse sera (●) and mean autoantibody levels (horizontal line) of 5 mice per strain. (C) IgM and IgG rheumatoid factor antibodies: anti–rabbit Ig, or anti–mouse IgG2a antibodies, determined by standard ELISA, on serum from 5 age-matched female B6.WT, B6.TRAIL−/−, B6.gld/gld, and B6.GT mice. Endpoint titers (●) and mean autoantibody levels are shown (horizontal line). (D) FACS analysis of B6.WT platelet-bound IgG and IgM autoantibodies in K2EDTA-anticoagulated serum obtained from old B6.WT (n = 5), B6.TRAIL−/− (n = 5), B6.gld/gld (n = 10 shown of 15 analyzed), or B6.GT mice (n = 10 shown of 15 analyzed). Serum antiplatelet antibody capacity to block detection of CD41 and CD61 is also shown. Log scale SSC/FWD scatter platelet events were gated to exclude 99.9% of electronic noise. (E) Visualization of megakaryocytes in Wright Giemsa-stained bone marrow smears. Scale bar represents 50 μm. (F) Enumeration of CD41hiCD61hi bone marrow megakaryocytes per 100 000 bone marrow leukocytes as determined by flow cytometry. Data are individual bone marrow megakaryocytes per pair mouse femurs (●), and means of bone marrow megakaryocytes from 5 mice per strain (horizontal line), calculated from CD41 versus CD61 dot plots of FWD-area large cells (< 0.5% events), pregated for singlet cells determined from FWD-height versus FWD-area dot plots (supplemental Figure 3). No statistically significant differences were found between any strains by 1-way analysis of variance.
Autoantibody production in B6.GT mice. (A) Spontaneous autoimmune skin lesions and ear pinna erosion in old B6.GT mice. (B) IgM and IgG anti–double-stranded DNA-specific autoantibodies in serum from 5 age-matched female B6.WT, B6.TRAIL−/−, B6.gld/gld, and B6.GT mice. Shown are endpoint titers of individual mouse sera (●) and mean autoantibody levels (horizontal line) of 5 mice per strain. (C) IgM and IgG rheumatoid factor antibodies: anti–rabbit Ig, or anti–mouse IgG2a antibodies, determined by standard ELISA, on serum from 5 age-matched female B6.WT, B6.TRAIL−/−, B6.gld/gld, and B6.GT mice. Endpoint titers (●) and mean autoantibody levels are shown (horizontal line). (D) FACS analysis of B6.WT platelet-bound IgG and IgM autoantibodies in K2EDTA-anticoagulated serum obtained from old B6.WT (n = 5), B6.TRAIL−/− (n = 5), B6.gld/gld (n = 10 shown of 15 analyzed), or B6.GT mice (n = 10 shown of 15 analyzed). Serum antiplatelet antibody capacity to block detection of CD41 and CD61 is also shown. Log scale SSC/FWD scatter platelet events were gated to exclude 99.9% of electronic noise. (E) Visualization of megakaryocytes in Wright Giemsa-stained bone marrow smears. Scale bar represents 50 μm. (F) Enumeration of CD41hiCD61hi bone marrow megakaryocytes per 100 000 bone marrow leukocytes as determined by flow cytometry. Data are individual bone marrow megakaryocytes per pair mouse femurs (●), and means of bone marrow megakaryocytes from 5 mice per strain (horizontal line), calculated from CD41 versus CD61 dot plots of FWD-area large cells (< 0.5% events), pregated for singlet cells determined from FWD-height versus FWD-area dot plots (supplemental Figure 3). No statistically significant differences were found between any strains by 1-way analysis of variance.
To further investigate the apparent early-onset autoimmunity in B6.GT mice, serum was collected from 15-week-old cohorts of age-matched female mice and examined for anti-dsDNA and rheumatoid factor autoantibodies. B6.GT mice produced high levels of anti-dsDNA IgM and IgG (Figure 7B). B6.GT mice also produced higher levels of IgM reactive with rabbit Ig than B6.G, B6.T, or B6.WT mice (P < .05; Figure 7C) and higher levels of IgM and IgG anti–mouse IgG2a antibodies, with at least half of the B6.GT sera containing 2-fold higher levels of rheumatoid factor Igs than B6.G sera (Figure 7C). Moreover, TRAIL deficiency alone results in increased levels of autoantibodies compared with B6.WT mice (P < .05), consistent with previous reports of dsDNA-specific antibodies in WT mice treated with TRAIL-neutralizing antibody.21 Autoimmune mice, just like humans with lupus, frequently exhibit antibody deposition in kidneys that ultimately leads to impaired kidney function. However, although there was clear evidence of both IgM and IgG antibody in kidney (supplemental Figure 2), older B6.GT mice did not develop proteinuria or glomerulonephritis and thus had not yet developed fulminant lupus-like kidney disease.
The detection of high titer autoantibodies indicated a possible autoimmune etiology for the thrombocytopenia in older B6.G and B6.GT mice, and this was more probable than defective platelet function because, even though platelets express FasL and TRAIL,22,23 young mice have normal platelet counts and no evidence of hemorrhage (data not shown). Consistent with this, approximately 90% of old B6.GT mouse serum contained detectable antiplatelet IgG and IgM antiplatelet antibodies (Figure 7D). Antiplatelet antibodies were also detectable in approximately 70% of older B6.gld/gld mouse sera, but these were mostly IgM isotype, and only 30% B6.G sera contained antiplatelet IgG antibodies (Figure 7D). In an analogous manner to humans with idiopathic thrombocytopenia purpura (ITP), many of these antibodies were directed toward CD41 and CD61 molecules within the glycoprotein IIIc/IIb intergrin complex because many old B6.gld/gld and B6.GT mouse sera blocked the detection of these platelet antigens (Figure 7D). Moreover, the effects of serum autoantibodies were deleterious to platelet longevity, causing platelet activation, clumping, and/or destruction, as evident by aberrant FWD and SSC profiles of B6.gld/gld or B6.GT serum-reacted WT platelets (Figure 7D). Hence, thrombocytopenia in B6.T mice correlated with demonstrable antiplatelet IgG, exactly as in humans with ITP secondary to chronic lymphocytic leukemia or lymphoma.24
Autoimmune thrombocytopenia often results from antibody-mediated opsonization of platelets and their subsequent destruction by splenic macrophages25 rather than hypomegakaryocytopoiesis. To determine whether B6.GT mice represented a true model of human autoimmune idiopathic thrombocytopenia, bone marrow megakaryocytes were assessed and large polyploid cells characteristic of megakaryocytes were present in all strains (Figure 7E). Because bone marrow megakaryocytes usually represent less than 0.3% to 0.5% of total mouse bone marrow leukocytes, megakaryocytes were enumerated using flow cytometry; however, the large CD41hi CD6hi mature megakaryocytes were present in similar numbers in all strains (Figure 7F; supplemental Figure 3). Thus, B6.GT mice develop severe thrombocytopenia resulting from pathogenic IgG antiplatelet CD41- and CD61-specific antibodies but have no overt defect in megakaryocytopoiesis. Taken together, these data clearly indicate that B6.GT mice spontaneously develop autoimmune diseases at a young age and die from fatal autoimmune thrombocytopenia secondary to LPD.
Discussion
Genetic loss of both FasL and TRAIL resulted in striking splenomegaly and lymphadenopathy, caused primarily by a large accumulation of CD3+B220+CD4−CD8− cells. These CD4−CD8− “double-negative” T cells are described in FasL-mutant gld mice,16 lpr Fas-mutant26 and Fas−/− mice,27 and cFLIP transgenic mice28 ; and just as we have shown in B6.GT mice, they are present in large numbers in B6.lpr/lpr.Bim−/− mice.29-31 They are also in humans with autoimmune lymphoproliferative syndrome (ALPS), most of whom have mutations in FasL, Fas,32 caspase-8,33 or caspase-10,34 or missense mutations in TNFR-associated death domain,35 causing defective lymphocyte apoptosis. The DN cells are classed as T cells because they express CD3 and TCR, even though they express B220, a molecule historically used to define murine B cells but also expressed on apoptotic T lymphocytes.36 DN T cells are thought to be derived from conventional CD4+ or CD8+ T cells that are stimulated through their TCR but fail to die because of defective FasL/Fas-medated apoptosis. Data presented here indicate that TRAIL provides additional control of peripheral lymphocyte apoptosis in vivo. This is supported by observations that variation in Fas or FasL mutation only partially explains loss of sensitivity to FasL-mediated lymphocyte cell death in ALPS patients.37 Thus, although other factors were known to contribute, these are only now emerging and include TRAIL/TRAIL-Rs. Interestingly, TNF-α can also mediate lymphocyte apoptosis38 but just as there are no DN T cells in TNF-α−/− and TNF-R−/− mice, similarly, there is no accumulation of DN T cells in B6.TRAIL−/− mice7 or B6.Killer/DR5−/− mice.39 One explanation is that FasL is an essential mediator of AICD, whereas TNF-α and TRAIL operate in a secondary or cooperative manner. We show here that TRAIL affects the viability of both CD4+ and CD8+ T cells in vitro and is particularly important to CD8+ T cells in the presence of IFN-γ. This suggests that TRAIL plays a key role in the survival of T cells and in the contraction of the T cell response after antigen is already cleared but when antiviral cytokines, such as IFN-γ, are still locally high. This appears to be distinct from the role for TRAIL in regulating CD8+ memory through CD4+ T cell help40 and different from Bim-mediated cytokine withdrawal-induced cell death.41 Notably, there is no in vitro peripheral T cell assay that demonstrates CD4 or CD8 down-regulation to the same extent as that seen on DN T cells. This implies that sustained and repeated TCR ligation is needed to achieve complete loss of coreceptor expression in vivo. Yet even in chronically lymphocytic choriomeningitis virus-infected B6.lpr/lpr.Bim−/− mice, antigen-specific tetramer-positive cells are found to express relatively normal levels of CD8, and tetramer-positive antigen-specific CD8− cells are not reported.31 Thus, debate remains as to the origin of DN T cells and although there are reports of DN T cells in some ALPS patients that appear to be clonally related to CD8+ T cells,42 consistent with low CD8 on older B6.G lymph node lymphocytes and the loss of these CD8lo cells in older B6.GT lymph nodes, there is also evidence of CD4+ T cell and CD8+ T cell unrelatedness,43 and it remains possible that the DN T cells accumulate directly from the rare DN T cells found in normal mice. Taken together, it seems probable that other as yet undefined factors contribute to the complete loss of CD4 and/or CD8 on T cells in vivo to turn them into DN T cells. Nevertheless, TRAIL clearly contributes to the severity of accumulation of CD4+, CD8+, and CD4−CD8− DN T cells in FasL-defective gld/gld mice.
Interestingly, there were no monoclonal outgrowths of TCR αβ-expressing conventional or DN T cells in B6.GT mice thus, genetic deficiency of FasL and TRAIL, even with extensive accumulation of T cells, does not necessarily result in early-onset lymphoma in vivo. Thus, TRAIL is important in tumor surveillance9 and in controlling tumors once they have arisen7,8 but not necessarily in T cell lymphomagenesis per se. On the other hand, B and T cell lymphomas are reported in a number of human ALPS patients with Fas mutations.44 Nevertheless, we have yet to identify B cell lymphomas in the longest surviving B6.GT mice. It must be noted, however, that B6.GT mice die prematurely, possibly before the onset of spontaneous lymphoma—a low frequency event in young B6 mice, and other oncogenic events, such as those involving c-myc or p53, are known to be required for early-onset transformation to leukemia or lymphoma.
It was notable that both B6.GT and B6.lpr/lpr.Bim−/− mice develop exacerbated LPD and autoimmunity compared with Fas−/− mice.29-31 However, the cause of autoimmunity in B6.GT and B6.lpr/lpr.Bim−/− strains is dissimilar because Bim−/− mice have major defects in central thymic deletion,45 whereas neither FasL nor TRAIL appears to be an essential inducer of thymocyte apoptosis because B6.GT mice have normal thymocyte cellularity. Thus, the LPD and autoimmunity in B6.GT mice appear to be the result of failure of mature peripheral lymphocyte cell death rather than defective thymocyte apoptosis. In any case, failure to eliminate self-reactive peripheral lymphocytes brings severe consequences to B6.GT mice, as they developed high levels of anti-dsDNA and rheumatoid factor autoantibodies by just 20 weeks of age. Furthermore, GT mice develop antiplatelet IgG and died prematurely from autoimmune thrombocytopenia, which is strikingly similar to humans with autoimmune ITP secondary to LPD or hematologic malignancy.24 Although anti-dsDNA antibodies are thought to primarily result from T cell–independent B cell responses, both rheumatoid factors and antiplatelet antibody are strongly T cell–dependent B cell Igs. In the case of B6.GT mice, these autoantibodies seem unlikely to arise simply because of too much T cell help (from accumulating CD4+ T cells) because it is known that platelet glycoprotein IIIa/IIb-specific CD4+ T cells can be detected in humans with ITP as well as in healthy controls46 and thus, defective B cell tolerance and B cell homeostasis are required for the development of pathogenic antiplatelet Igs. Indeed, expanded numbers of follicular B cells in the spleens of B6.GT mice relative to B6.gld/gld mice further insinuate an as yet undefined role for TRAIL in B cell homeostasis. Moreover, these findings may also indicate that anti–B cell therapies could be beneficial in ALPS patients with ITP. However, recent reports caution against this because of dangers of unwanted toxicities and prolonged neutropenia evident after rituximab treatment of ALPS patients, as these constitute unnecessary infection risks.47 Finally, although TRAIL has been previously implicated in playing a role in autoimmunity, the evidence for this has largely come from immunization-induced autoimmune disease models in mice, such as collagen-induced arthritis,48 streptozocin-induced diabetes,49 and central nervous system peptide immunization-induced models of multiple sclerosis.50 Notably, these models all require strong adjuvants or cytotoxic agents to break self-tolerance, whereas B6.GT mice spontaneously developed severe autoimmunity from an early age, providing convincing evidence of the importance of TRAIL in autoimmunity.
In conclusion, the characterization of B6.GT mice demonstrates how failure to control lymphocyte expansion through FasL and TRAIL results in extreme lymphoproliferative disease and autoimmunity, most notably severe autoimmune thrombocytopenia. On this basis, we report that B6.GT mice provide a unique model of spontaneous ITP secondary to LPD that is virtually identical to human with ALPS-like syndromes with ITP or persons with hematologic malignancy.24 Thus, TRAIL is not simply important in tumor surveillance and control of tumor metastasis in vivo,7-9 but it is also critically important in the immune and hematopoietic systems, acting together with FasL to control lymphocyte homeostasis and to limit autoimmunity. This is important knowledge that can critically inform the safe use of recombinant TRAIL- and TRAIL-R–based reagents currently being assessed in human trials for use in cancer patients.
The online version of this article contains a data supplement.
The publication costs of this article were defrayed in part by page charge payment. Therefore, and solely to indicate this fact, this article is hereby marked “advertisement” in accordance with 18 USC section 1734.
Acknowledgments
The authors thank the staff at the Immunex Animal Facility and Westmead Hospital Animal Facility for expert animal care, Aysen Yuksel (Westmead Millennium Institute) for histology service, Min Hu (Children's Hospital at Westmead) for assistance with TCR spectratyping, Gillian Rozenberg (Prince of Wales Hospital, Sydney) and Lacey Johnson (Australian Red Cross Blood Service) for Giemsa staining and advice on megakaryocytes, David Gottlieb (Westmead Millennium Institute) for thoughtful comments on lymphomagenesis, and Marina Botto (Imperial College London) for discussion of autoimmune alleles in mice.
A.K. was supported by a University of Sydney International Post-graduate Research Scholarship. This work was supported by the National Health and Medical Research Council (project grant 211128), University of Sydney Cancer Research grant, Westmead Hospital Charitable Trust (L.M.S.), and NSW Leukemia Foundation (L.M.S., L.J.B.).
Authorship
Contribution: L.M.S. designed and performed research, analyzed data, and wrote the paper; A.K., A.K.P., and S.R.O. performed research and analyzed data; G.C.F. and G.J.S. contributed intellectually and provided material support for the project; and S.I.A. and L.J.B. contributed reagents and expertise in TCR spectratyping and platelet preparation, respectively.
Conflict-of-interest disclosure: The authors declare no competing financial interests.
Correspondence: Lisa M. Sedger, Institute for Biotechnology of Infectious Disease, University of Technology, Sydney, PO Box 123, Broadway, NSW 2007, Australia; e-mail: Lisa.Sedger@uts.edu.au.


