Abstract
Activated platelets secrete a negatively charged polymer, polyphosphate (polyP). Here, we explore the interactions of polyP with fibrin(ogen) and its effect on fibrin structure and fibrinolysis. Electrophoretic mobility and binding assays indicate that polyP interacts with fibrinogen and soluble fibrin. Clots formed in the presence of polyP exhibited reduced turbidity and permeability indicative of a tighter fibrin network, but these changes were not related to cross-linking or fibrinopeptide release. Microscopy showed a change in fibrin distribution in clots formed with polyP; with formation of tight aggregates of fibrin fibers interspaced with large pores in contrast to homogenous fiber distribution in control clots. Lysis by tissue plasminogen activator (tPA) and plasminogen or plasmin was delayed in clots formed with polyP and depended on both the activator and polyP concentration. Adding polyP to the clot after fibrin formation or to repolymerizing soluble fibrin did not affect lysis, indicating changes induced by polyP occur at the level of conversion of fibrinogen to fibrin. Surface plasmon resonance showed that the presence of polyP reduced the binding of both plasminogen and tPA to partially lysed fibrin surfaces. These data show that polyP directly influences fibrin architecture and attenuates fibrinolysis through reduced binding of fibrinolytic proteins.
Introduction
Coagulation culminates in the generation of thrombin that converts fibrinogen to fibrin. Fibrinogen is composed of 2 sets of 3 chains designated Aα, Bβ, and γ.1,2 The N-termini of all 6 chains are clustered in the center of the molecule termed the E region from which 2 sets of coiled coils extend to the D regions. Thrombin cleaves short acidic N-terminal sequences on the Aα and Bβ chains, designated fibrinopeptides A and B, respectively, thereby exposing polymerization sites. Thrombin preferentially cleaves fibrinopeptide A3,4 spontaneously forming staggered, double-stranded protofibrils. Removal of fibrinopeptide B then liberates the C-termini of the α chain from the central E region, resulting in lateral aggregation of the protofibrils through αC–αC interactions.3 Fibers exhibit branching,5,6 thus forming a 3-dimensional scaffold.
The structure and mechanical properties of fibrin are important determinants for its breakdown and in vivo can translate into an increased risk of thrombosis or embolism.7-9 Fibrin clot structure is determined by fiber thickness and distribution of the fibers and branchpoints. Changes in these parameters influence clot stability and susceptibility to degradation by fibrinolytic proteases. Thrombin also activates factor XIII (FXIII), a process that is augmented by fibrin itself.10 Activated FXIII (FXIIIa) cross-links fibrin and incorporates inhibitors of fibrinolysis, such as α2antiplasmin, into the clot, resulting in a network with increased resistance to lysis.
Fibrin not only acts as a cofactor in its stabilization by FXIII but also in its dissolution, by binding tissue plasminogen activator (tPA) and plasminogen.11 Activation of plasminogen by tPA is inefficient in solution, but the rate is increased dramatically on the fibrin surface.12 Thick fibers are lysed at a slower rate at the level of the individual fibers than thin fibers.13 Clots with thick fibers are, however, more susceptible to lysis on the whole, because there are a smaller number of fibers present per volume of clot and the fibers are less densely packed.14
Fibrin structure is influenced by platelets.15-18 The platelet surface is a regulator of procoagulant activity and local thrombin concentration, parameters that have been shown to dictate clot structure.18 Platelets interact directly with fibrin by the αIIbβ3 integrin that alters fibrin structure and susceptibility to lysis.15-17 When stimulated, platelets release polyphosphate (polyP) from the dense granules.19 PolyP is a linear polymer of orthophosphate residues (Pi) linked by high-energy phosphoanhydride bonds. Released polyP stimulates thrombin generation by enhancing factor V activation and activating the contact pathway.20 The changes in thrombin generation induced by polyP increase activation of thrombin activatable fibrinolysis inhibitor (TAFI) and down-regulate fibrinolysis.20 The proximity of polyP to the clot led us to question whether it has a direct effect on fibrin structure, independently of its effect on thrombin generation. With the use of a purified system we find that fibrin networks formed in the presence of polyP are heterogeneous in nature and are more resistant to degradation by fibrinolytic proteases.
Methods
Materials
Human plasminogen-free fibrinogen, α-thrombin, plasminogen, and plasmin were from Enzyme Research Laboratories. Polyphosphate (average chain lengths of 5, 25, 45, and 65), atroxin, and toluidine blue O were from Sigma-Aldrich. tPA was from Technoclone GmbH. Zirconia beads were from ZirChrom Separations. Rabbit polyclonal antibody to fibrinogen was from Dako. Handee mini-spin columns, polyvinylidene fluoride membrane, and Gelcode were from Pierce Chemical. NuPAGE gels (4%-12%), NuPAGE sample buffer and reducing agent, MOPS (3-[N-Morpholino]propanesulphonic acid) running buffer, and 6% Tris (tris(hydroxymethyl)aminomethane)–glycine gels were from Invitrogen. Fibrogammin was from CSL Behring UK Limited. CM5 sensor chips and P-20 were from GE Healthcare. S2251 chromogenic substrate was from DiaPharma (Axis-Shield). Unless otherwise stated Tris-buffered saline (TBS; 50mM Tris-HCl pH 7.4, 100mM NaCl) was used. PolyP concentration is expressed in monomer concentration throughout (monomer formula NaPO3).
Fibrin(ogen) binding
PolyP was immobilized onto porous zirconia beads as described.21 Briefly, 250 mg of zirconia beads were incubated with 10 mg/mL polyP65 in water for 20 hours at 37°C. The beads were washed with distilled water before blocking with 10% bovine serum albumin (BSA) for 15 hours at ambient temperature. After washing in water the zirconia beads were oven dried at 80°C for 2 hours. Control beads were treated with water and BSA only.
PolyP-zirconia beads (10 mg of dry weight) were equilibrated with 200 μL of TBS containing 0.1% BSA before addition of fibrinogen (10 μg). After incubation at ambient temperature for 30 minutes, the mixtures were centrifuged in mini-spin columns at 1677g for 30 seconds. The flow-through was collected, and the polyP-zirconia beads were washed with 200 μL of TBS containing 0.1% BSA followed by elution with 200 μL of TBS, 1M NaCl, and 0.1% BSA. Recovery of fibrinogen from the beads was determined by separating samples on 4% to 12% NuPAGE gels with MOPS running buffer, transferring to polyvinylidene fluoride, and Western blotting with an antibody to fibrinogen.
Gel mobility shift assays were performed with fibrinogen and soluble fibrin, prepared as described.22 Proteins (10 μg/lane) were preincubated with polyP65 (100 μg) for 10 minutes at ambient temperature before mixing with 60mM Tris-HCl pH 6.8, 10% glycerol, 0.01% bromophenol blue. Samples were resolved on 6% Tris-glycine gels for 2.5 hours at 125 V. Gels were stained for protein with Gelcode, or for polyP with 0.25% toluidine blue O in 25% methanol, 5% glycerol for 10 minutes and destained in the same solution without dye.
Microscopy of fibrin clots
Fibrinogen (3μM) was incubated with 0.25 U/mL thrombin and 5mM CaCl2 plus or minus polyP65 (325 or 650μM) in TBS. After 2 hours at room temperature, clots were washed in sodium cacodylate buffer and fixed overnight in 2% glutaraldehyde. Clots were dehydrated with an acetone gradient and sputter coated with platinum palladium. Samples were analyzed with the use of a field-emission scanning electron microscope (LEO 1530 FEGSEM; Leo Electron Microscopy) in 10 different areas of the clot and recorded with the use of Leo 32 Version 03.0210 software.
For confocal microscopy, fibrinogen (3μM) was added to chamber slides (Ibidi μ-slide VI-flow; Thistle Scientific) and clotted with or without polyP65 as described earlier. Samples were visualized with the use of a Leica TCS SP-2 laser scanning confocal equipment (Leica Microsystems) on an inverted DM IRE 2 microscope with 63× water immersion objective (numeric aperture 1.2). Each sample was analyzed with reflected light mode in at least 10 different areas of 240 × 240 × 40 μm. Z-stacks were taken every 1 to 2 μm, and 2-dimensional reconstructed images were rendered of the fibrin clots with the Leica software.
Fibrin permeation studies
Fibrin clots were generated by incubating fibrinogen (3μM) with 0.25 U/mL thrombin and 5mM CaCl2 plus or minus polyP65 (325 or 650μM) in TBS for 2 hours in a moist chamber at ambient temperature. Permeation of TBS through the clot was quantified as described23 with a pressure drop of 2 cm, from which the Darcy constant (Ks) was calculated.
Turbidity analysis
Purified human fibrinogen (2.4μM) with or without polyP65 (325-650μM) in TBS was added in triplicate to 96-well polystyrene plates (Greiner). Clotting was initiated by thrombin (0.25 U/mL) and CaCl2 (5mM), and turbidity was monitored every 12 seconds at 350 nm for 60 minutes in a FLX-800 plate reader (Biotek Instruments).
Fibrin cross-linking
Clots were prepared as described for turbidity but with the addition of Fibrogammin (10 μg/mL) as a source of FXIII to fibrinogen before initiation of clotting. Commercial preparations of fibrinogen are contaminated with FXIII, so in some cases were subjected to further purification. Briefly, CaCl2 (10mM) was added to fibrinogen before the addition of 20% ammonium sulfate. After incubation for 90 minutes the mixture was spun at 3000g for 20 minutes at 4°C, the pellet was discarded, and the supernatant, containing FXIII-depleted fibrinogen, was precipitated by bringing the ammonium sulfate concentration to 33%. The pellet was dissolved in distilled water and dialyzed into TBS. Cross-linking by FXIIIa was investigated by sodium dodecyl sulfate–polyacrylamide gel electrophoresis as described.24 Briefly, fibrinogen (3μM) with or without polyP (325μM) was clotted with the use of thrombin (0.25 U/mL) and CaCl2 (5mM) with Fibrogammin (10 μg/mL). The reaction was stopped at 0, 5, 30, and 60 minutes with the use of reducing NuPAGE sample buffer. Samples were then separated on 4% to 12% gradient gels with MOPS running buffer and stained with GelCode.
Fibrinopeptide release
Cleavage of fibrinopeptides A and B from fibrinogen by thrombin was monitored by high-performance liquid chromatography (HPLC) as described23,25 with minor modifications. Fibrinogen (3μM), thrombin (0.25 U/mL), CaCl2 (5mM) with or without polyP65 (325 and 650μM) were incubated at 37°C for 0, 0.5, 1, 2.5, 5, 10, and 20 minutes before stopping with 1:10 (vol/vol) of 3M HCIO4. Samples were spun for 15 minutes at 1677g, and supernatants were applied to a 0.46 × 25-cm silica C18 (bead size, 5 mm; pore size, 30 nm [300 Å]) column (Pepmap C18) on a BioCad Sprint chromatography system (both Perseptive Biosystems). Fibrinopeptides were eluted with a linear gradient from 10% acetonitrile and 90% 0.083M NaH2PO4, pH 3.1, to 40% acetonitrile and 60% 0.083M NaH2PO4, pH 3.1, and UV absorbancy was determined at 205 nm. The area under the curve was determined and converted to molar concentration against the maximal fibrinopeptide release at 45 minutes. Samples were performed in triplicate and expressed as mean plus or minus SD of the ratio of fibrinopeptide concentration over maximal release ([Fp]/[Fp]max).
Fibrinolysis
Clots were generated as described for turbidity with the addition of plasminogen (0.24μM) and tPA (20pM) or plasmin (11nM) before initiation of clotting with thrombin (0.25 U/mL) and CaCl2 (5mM). In some cases thrombin was replaced with atroxin (0.5 μg/mL), or clots were formed by repolymerizing soluble fibrin. The effect of polyP chain length was analyzed by including NaH2PO4 or polyP of different average chain lengths (5-, 25-, 45-, and 65-mer) at a constant phosphate monomer concentration (325μM). The concentrations of thrombin (0.0125-5 U/mL), CaCl2 (0-20mM), tPA (10-500pM), and polyP65 (0.065-3.25mM) were varied. Lysis was monitored at 340 nm. Turbidity was normalized, and the time to 50% lysis was calculated as the time between maximal and half-maximal turbidity. In some experiments clots were generated in the absence of lytic proteins and were incubated for 30 minutes before overlaying with tPA (10nM) and plasminogen (0.55μM). In these experiments polyP65 (325μM) was included with fibrinogen before clotting, in the overlay, or in both.
Surface plasmon resonance
Binding of plasminogen and tPA to fibrin was analyzed with the use of a Biacore 3000 (BIAcore) as previously described26 with the following modifications. All samples were analyzed in 10mM HEPES (N-2-hydroxyethylpiperazine-N′-2-ethanesulfonic acid), 140mM NaCl, and 2.5mM CaCl2 with 0.05% P-20, pH 7.4 (HBSC), and the experiments were performed at 25°C. Fibrinogen was covalently attached to a carboxymethyl dextra–coated biosensor chip (CM5) by amine coupling, to yield approximately 1000 response units. Immobilized fibrinogen was converted to fibrin by running 1 U/mL thrombin, with or without 325μM polyP65, at 2 μL/minute for 20 minutes. Thrombin was removed by injecting 40 μL of 1M NaCl, 10mM HEPES, pH 7.4, followed by 35 μL of HBSC (30 μL/minute). Plasminogen (0-1μM) or t-PA (0-2.2μM) was injected for 6 minutes at 30 μL/minute, and the dissociation was monitored for 3 minutes. The surface was regenerated with 1M NaCl, 10mM HEPES, pH 7.4, at 30 μL/minute, followed by HBSC (35 μL) and re-equilibrated with running buffer for 5 minutes before the next run. Benzamidine (2.5mM) was included in the buffer during plasminogen binding to prevent activation. Plasmin (30nM) was applied to the fibrin surface at 2 μL/minute for 5 minutes, and binding studies with plasminogen and tPA were repeated on partially lysed fibrin.
Plasmin activity
Fibrinogen (2.4μM) and plasminogen (0.55μM) were added to microtiter plates (Greiner) with or without 325μM polyP65 in 10mM Tris (pH 7.4) with 140mM NaCl and 0.01% Tween-20. Clotting was initiated with thrombin (1 U/mL) and CaCl2 (5mM), and the plate was incubated for 30 minutes at 37°C before lysing with tPA (5nM) in the presence of S2251 (0.12mM). Absorbance at 405 nm was recorded every 30 seconds, and the amount of plasmin within the clot was quantified. The direct effect of polyP on plasmin (0-200nM) was analyzed with or without polyP65 (325μM) by monitoring hydrolysis of S2251 (0.12mM) at 405 nm for 10 minutes.
Statistical analysis
Data are expressed as mean and SD or SEM of at least 3 separate experiments. Statistical analyses were performed with GraphPad Prism 5 using t test (GraphPad Software), and P values less than .05 were considered statistically significant.
Results
Polyphosphate binds to fibrinogen and fibrin
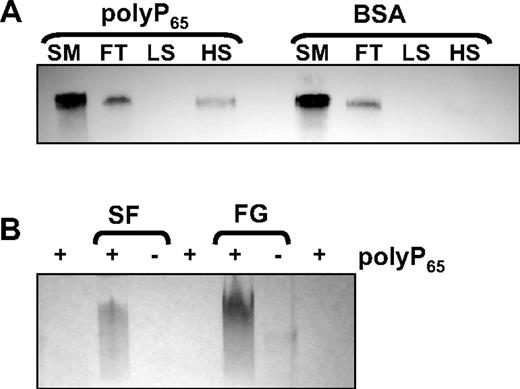
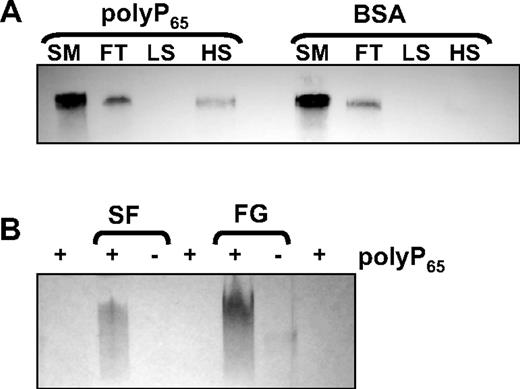
Binding of polyP to fibrinogen was studied with the use of a column-based technique in which polyP65 was preimmobilized onto zirconia dioxide beads to form a stable solid phase. PolyP-zirconia or control-zirconia (treated with BSA only) were incubated with fibrinogen (10 μg) for 30 minutes at ambient temperature. The flow-through and eluates at low- and high-salt conditions were analyzed by Western blot with an antibody to fibrinogen. Fibrinogen could be detected in the flow-through of both polyP-zirconia and control beads (Figure 1A), but beads coated with polyP65 retained fibrinogen that could only be eluted with 1M NaCl. Binding between polyP and fibrin(ogen) was also investigated with the use of a gel shift assay. Fibrinogen or soluble fibrin with or without polyP65 was subjected to native gel electrophoresis, and the gel was stained with toluidine blue O, a metachromatic dye that binds polyP. Free polyP65 migrated with the dye front, but preincubation with either fibrinogen or soluble fibrin retarded movement of the polymer through the gel, showing an interaction of polyP with these proteins (Figure 1B). In the absence of polyP65 negligible staining was observed for the proteins.
PolyP binds to fibrinogen and soluble fibrin. (A) Fibrinogen (10 μg) was incubated with zirconia beads coated with either polyP65 or bovine serum albumin (BSA). The starting material (SM), flow-through (FT), low-salt (LS), and high-salt (HS) washes were subjected to sodium dodecyl sulfate–polyacrylamide gel electrophoresis on 4% to 12% NuPAGE gels with MOPS running buffer and blotted with an antibody to fibrinogen. (B) PolyP65 was incubated with 10 μg of soluble fibrin (SF), fibrinogen (FG), or buffer alone for 10 minutes before separating on 6% Tris-glycine gels for 2.5 hours under native conditions. The gels were stained with toluidine blue O that binds polyP. Free polyP65 migrates with the dye front and cannot be visualized.
PolyP binds to fibrinogen and soluble fibrin. (A) Fibrinogen (10 μg) was incubated with zirconia beads coated with either polyP65 or bovine serum albumin (BSA). The starting material (SM), flow-through (FT), low-salt (LS), and high-salt (HS) washes were subjected to sodium dodecyl sulfate–polyacrylamide gel electrophoresis on 4% to 12% NuPAGE gels with MOPS running buffer and blotted with an antibody to fibrinogen. (B) PolyP65 was incubated with 10 μg of soluble fibrin (SF), fibrinogen (FG), or buffer alone for 10 minutes before separating on 6% Tris-glycine gels for 2.5 hours under native conditions. The gels were stained with toluidine blue O that binds polyP. Free polyP65 migrates with the dye front and cannot be visualized.
Polyphosphate influences fibrin structure
PolyP65 did not influence the rate of fibrin polymerization during clot formation (Figure 2A) even when the thrombin concentration was varied (not shown). However, inclusion of polyP65 during clot formation reduced maximum turbidity of the fibrin clot compared to control (0.45 ± 0.014 vs 0.51 ± 0.015; P < .005). We next measured the permeation constant Ks that is a direct measure of the average pore size in the fibrin network. Fibrin clots formed in the presence of polyP65 showed an approximately 1.5-fold reduction in Ks (3.35 ± 0.15 10−9 cm2) compared with control (5.02 ± 0.26 10−9 cm2; P < .001). The lower turbidity and reduction in Ks of clots formed in the presence of polyP65 show a direct effect of polyP on the structure of the fibrin network.
PolyP-induced changes in fibrin formation and structure. (A) Fibrinogen (2.4μM) was clotted in the absence (gray line) and presence (black line) of polyP65 (325μM) by an activation mix of thrombin (0.25 U/mL) and CaCl2 (5mM). The turbidity was monitored at 340 nm every 12 seconds for 30 minutes, and the results are expressed as mean ± SEM (n = 4). (B) Fibrinopeptide release from fibrinogen during polymerization with thrombin (0.2 U/mL) and CaCl2 (5mM) was monitored over time by reverse-phase high-performance liquid chromatography (HPLC) in the absence (open symbols) and presence (closed symbols) of polyP65 (325μM). The concentration of fibrinopeptide A (circles) and fibrinopeptide B (triangles) at each time point is expressed as a fraction of maximal release ([FP]/[FP]max, so that complete release is equal to 1). The inset shows the linear part of the curve.
PolyP-induced changes in fibrin formation and structure. (A) Fibrinogen (2.4μM) was clotted in the absence (gray line) and presence (black line) of polyP65 (325μM) by an activation mix of thrombin (0.25 U/mL) and CaCl2 (5mM). The turbidity was monitored at 340 nm every 12 seconds for 30 minutes, and the results are expressed as mean ± SEM (n = 4). (B) Fibrinopeptide release from fibrinogen during polymerization with thrombin (0.2 U/mL) and CaCl2 (5mM) was monitored over time by reverse-phase high-performance liquid chromatography (HPLC) in the absence (open symbols) and presence (closed symbols) of polyP65 (325μM). The concentration of fibrinopeptide A (circles) and fibrinopeptide B (triangles) at each time point is expressed as a fraction of maximal release ([FP]/[FP]max, so that complete release is equal to 1). The inset shows the linear part of the curve.
We investigated whether changes in fibrin structure are related to an effect of polyP on fibrin cross-linking by FXIIIa. Purified fibrinogen preparations are contaminated with FXIII; therefore, the assays performed are assumed to contain small amounts of the transglutaminase. Inclusion of purified FXIII did not result in any additional changes in the turbidity of the fibrin clots formed with or without polyP. When fibrinogen was purified, to remove contaminating FXIIIa, no differences in the response to polyP65 were observed (not shown). Sodium dodecyl sulfate–polyacrylamide gel electrophoresis of the fibrin cross-links generated by FXIIIa did not show differences in γ-γ dimers or α-polymers with or without polyP65 (not shown). These observations support previous work that polyP does not interfere with fibrin cross-linking27 and that FXIIIa activity is not directly affected by polyP.28
Fibrin structure is influenced by factors that interfere with the kinetics of fibrinopeptide cleavage. Using HPLC, we measured fibrinopeptide A and fibrinopeptide B release by thrombin, which we found to be equivalent in the absence and presence of polyP65 (325 or 650μM; Figure 2B; only 325μM polyP is shown for clarity). The similar kinetics of fibrinopeptide A cleavage in the presence and absence of polyP65 is consistent with the lack of effect on polymerization in turbidity measurements. The fact that fibrinopeptide B release was also unaffected indicates that the altered fibrin structure observed in the presence of polyP does not result from fibrinopeptide B–dependent changes in lateral association of fibrin fibers. These data are consistent with a thrombin-independent effect of polyP on fibrin formation.
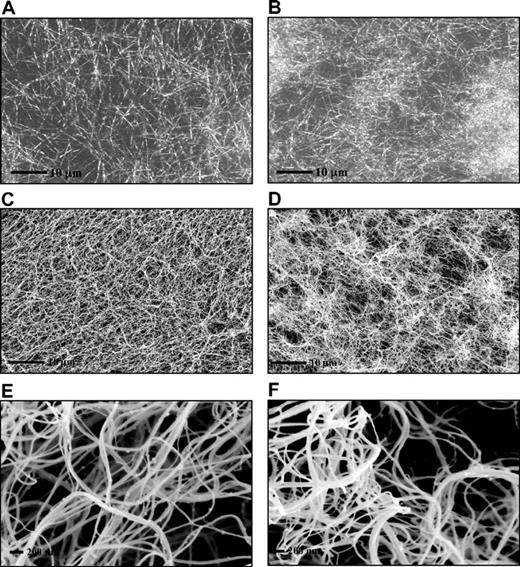
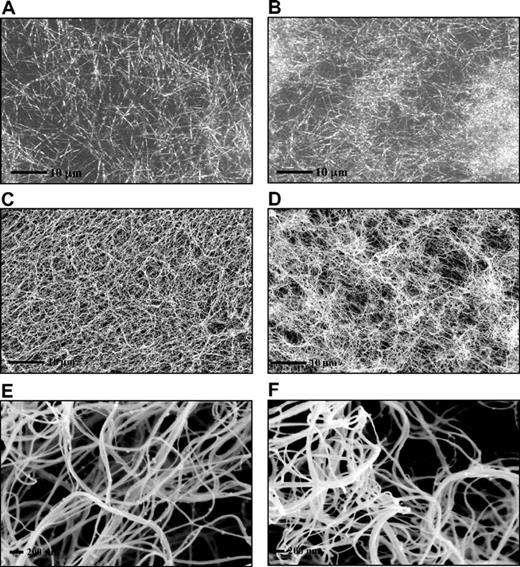
Fibrin clots prepared in the absence of polyP showed a homogenous structure by laser scanning confocal and scanning electron microscopies (Figure 3A,C,E). In contrast, clots formed in the presence of polyP showed an abnormal and distinct pattern of fibrin distribution with tightly knotted regions that were interspersed by large pores (Figure 3B,D,F). Despite the irregular appearance of the clots, no major effect of polyP was observed on the average fiber diameter.
PolyP-induced changes in fibrin ultrastructure. Fibrin clots were prepared by incubating fibrinogen (3μM) with thrombin (0.25 U/mL) and CaCl2 (5mM) in the absence (A,C,E) and the presence (B,D,F) of polyP65 (325μM). Fibrin clots analyzed by laser scanning confocal microscopy (A-B) and were analyzed by scanning electron micrographs (C-F). A total of 10 different areas were visualized in 3 replicate clots, and representative pictures are shown. The high-magnification images (E-F) show details of a tightly knotted fibrin region in the presence of polyP (F).
PolyP-induced changes in fibrin ultrastructure. Fibrin clots were prepared by incubating fibrinogen (3μM) with thrombin (0.25 U/mL) and CaCl2 (5mM) in the absence (A,C,E) and the presence (B,D,F) of polyP65 (325μM). Fibrin clots analyzed by laser scanning confocal microscopy (A-B) and were analyzed by scanning electron micrographs (C-F). A total of 10 different areas were visualized in 3 replicate clots, and representative pictures are shown. The high-magnification images (E-F) show details of a tightly knotted fibrin region in the presence of polyP (F).
Polyphosphate delays fibrinolysis
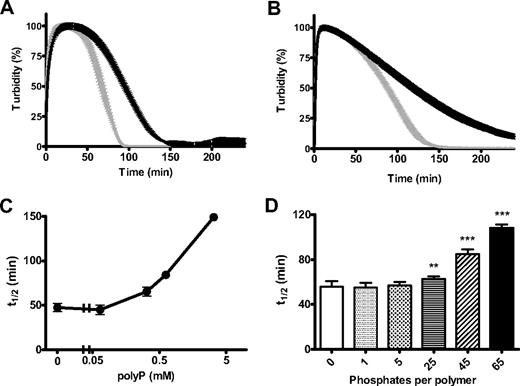
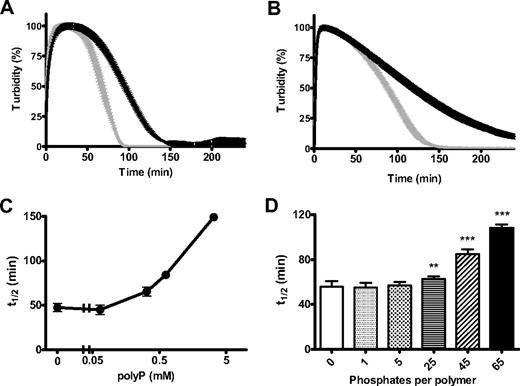
Changes in the structural and mechanical properties of fibrin can have profound effects on its degradation by fibrinolytic enzymes. We found that clots formed with polyP were significantly more resistant to lysis by tPA and plasminogen or plasmin (Figure 4A-B). There was a strong dose-dependent effect of polyP in delaying tPA-mediated fibrinolysis with high concentrations of the polymer, conferring considerable resistance to degradation (Figure 4C). Down-regulation of lysis depended on polymer size, with significant lengthening of the 50% lysis time on inclusion of 25-, 45-, and 65-mer polymers (polyP65 being most effective), whereas very short polymers (5-mer) or inorganic phosphate did not delay lysis (Figure 4D). This experiment also shows that the effect of polyP does not result from changes in ionic strength, because the same phosphate monomer concentration (325μM) was present in each reaction mixture.
PolyP delays fibrinolysis. Fibrin clots were formed with purified fibrinogen (2.4μM) in the absence (gray line) and presence (black line) of polyP65 (325μM). Lysis was induced by including 20pM tissue plasminogen activator (tPA) and 0.24μM plasminogen (A) or 11nM plasmin (B) with fibrinogen before activation with thrombin (0.25 U/mL) and CaCl2 (5mM). Lysis was monitored by changes in absorbance at 340 nm for 4 hours with time points every 1 minute. Results are normalized to account for polyP-induced changes in turbidity and are expressed as mean ± SEM of the percentage of lysis (n = 6). (C) Lysis was followed as described for tPA and plasminogen but with the addition of various polyP65 concentrations (0-3.25mM). The time to mean time to 50% lysis ± SEM is shown (n = 3). (D) Clots were formed in the presence of monophosphate or polyphosphate of various chain lengths (5-65 phosphate residues) at equivalent monomer concentration (325μM). Lysis by tPA and plasminogen was monitored, and the mean 50% lysis time ± SEM is shown (n = 4). Fifty percent lysis times of statistical significance are denoted with **P < .001 and ***P < .001).
PolyP delays fibrinolysis. Fibrin clots were formed with purified fibrinogen (2.4μM) in the absence (gray line) and presence (black line) of polyP65 (325μM). Lysis was induced by including 20pM tissue plasminogen activator (tPA) and 0.24μM plasminogen (A) or 11nM plasmin (B) with fibrinogen before activation with thrombin (0.25 U/mL) and CaCl2 (5mM). Lysis was monitored by changes in absorbance at 340 nm for 4 hours with time points every 1 minute. Results are normalized to account for polyP-induced changes in turbidity and are expressed as mean ± SEM of the percentage of lysis (n = 6). (C) Lysis was followed as described for tPA and plasminogen but with the addition of various polyP65 concentrations (0-3.25mM). The time to mean time to 50% lysis ± SEM is shown (n = 3). (D) Clots were formed in the presence of monophosphate or polyphosphate of various chain lengths (5-65 phosphate residues) at equivalent monomer concentration (325μM). Lysis by tPA and plasminogen was monitored, and the mean 50% lysis time ± SEM is shown (n = 4). Fifty percent lysis times of statistical significance are denoted with **P < .001 and ***P < .001).
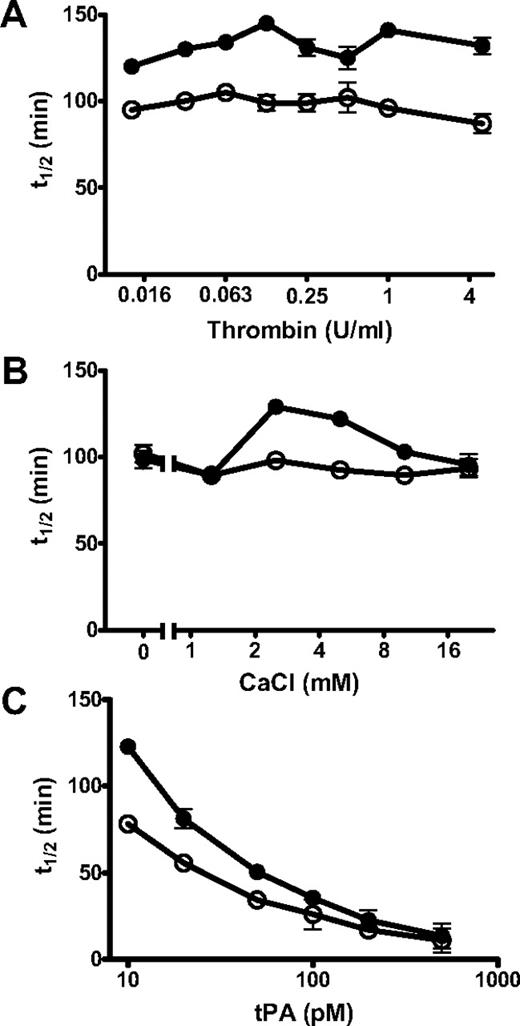
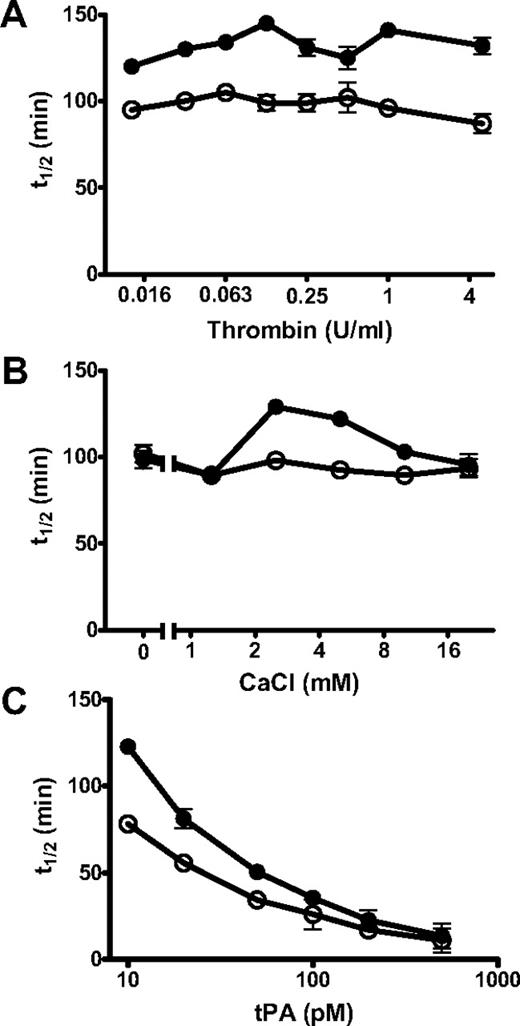
PolyP-induced changes in fibrinolysis were independent of thrombin concentration (0.0125-5 U/mL) but dependent on calcium concentration (0-20mM; Figure 5). Down-regulation of lysis by polyP was most pronounced at calcium concentrations of 2.5 and 5mM, with little effect at higher concentrations or in the absence of calcium. PolyP is known to chelate metal ions, but the molar concentration of calcium used in these experiments is significantly higher than the polyP concentration (325-650μM). The ability of polyP to down-regulate fibrinolysis could also be overcome by including high concentrations of tPA (Figure 5C).
Different parameters affect the ability of polyP to modulate lysis. Fibrin clots were formed from fibrinogen (2.4μM), plasminogen (0.24μM), and tPA in the absence (○) and presence (●) of polyP65 (325μM) by adding thrombin and CaCl2 (A). The concentration of thrombin used to induce clotting was varied from 0.016 U/mL to 5 U/mL with constant CaCl2 (5mM) and tPA (20pM) concentrations. (B) The concentration of CaCl2 was varied from 0 to 20mM in the presence of constant thrombin (0.25 U/mL) and tPA (20pM) concentrations. (C) The tPA concentration was varied from 10 to 500pM in the presence of constant thrombin (0.25U/mL) and CaCl2 (5mM) concentrations. All the results are expressed as the mean ± SEM time to 50% lysis (n = 4).
Different parameters affect the ability of polyP to modulate lysis. Fibrin clots were formed from fibrinogen (2.4μM), plasminogen (0.24μM), and tPA in the absence (○) and presence (●) of polyP65 (325μM) by adding thrombin and CaCl2 (A). The concentration of thrombin used to induce clotting was varied from 0.016 U/mL to 5 U/mL with constant CaCl2 (5mM) and tPA (20pM) concentrations. (B) The concentration of CaCl2 was varied from 0 to 20mM in the presence of constant thrombin (0.25 U/mL) and tPA (20pM) concentrations. (C) The tPA concentration was varied from 10 to 500pM in the presence of constant thrombin (0.25U/mL) and CaCl2 (5mM) concentrations. All the results are expressed as the mean ± SEM time to 50% lysis (n = 4).
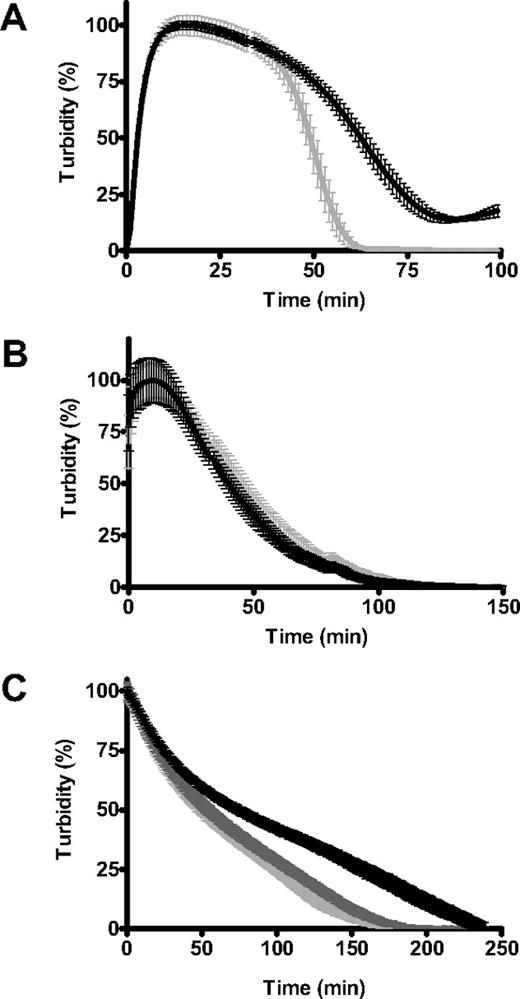
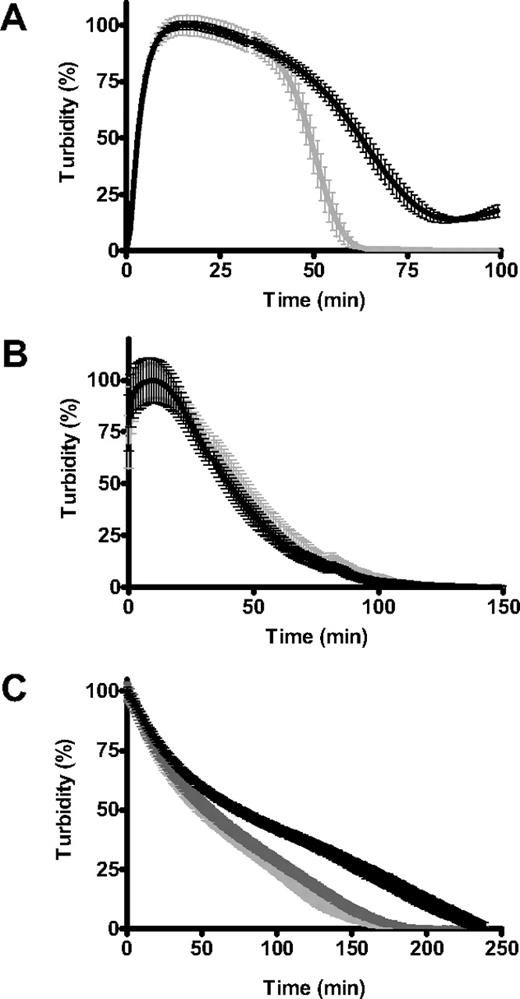
The effect of polyP on fibrin structure was independent of fibrinopeptide release by thrombin. Consistent with these observations, fibrin generated with atroxin, which only cleaves fibrinopeptide A, was more resistant to tPA-mediated fibrinolysis when formed in the presence of polyP65 (Figure 6A). Clots generated from soluble fibrin, which was allowed to repolymerize with or without polyP65, lysed at the same rates regardless of the presence of polyP (Figure 6B). We next analyzed fibrin clots formed with or without polyP65 that were lysed externally with the use of an overlay of plasminogen and tPA. PolyP induced down-regulation of fibrinolysis occurred only when clots were formed in the presence of the polymer and not when it was added to the overlay with tPA and plasminogen (Figure 6C). Inclusion of polyP in both the clot and overlay did not generate any additional effects (not shown). These data show that polyP down-regulates fibrinolysis by altering the arrangement of the fibrin network during clot formation.
PolyP only affects lysis if present during polymerization of fibrinogen. (A) Fibrin clots were formed from fibrinogen (2.4μM), plasminogen (0.24μM), and tPA (20pM) in the absence (gray line) and presence (black line) of polyP65 (325μM) by adding atroxin (10 μg/mL) and CaCl2 (5mM; n = 4). (B) Soluble fibrin was repolymerized in the presence of plasminogen (0.24μM) and tPA (20pM) in the absence (gray line) and presence (black line) of polyP 65 (325μM; n = 5). (C) Clots were generated with purified fibrinogen clotted with (black line) and without (pale gray line) polyP65 (325μM). Clots were incubated for 30 minutes at 37°C before overlaying with a mixture of plasminogen (0.55μM) and tPA (10nM) with (dark gray line) and without polyP65 (325μM; n = 8). Results are normalized and expressed as the mean ± SEM.
PolyP only affects lysis if present during polymerization of fibrinogen. (A) Fibrin clots were formed from fibrinogen (2.4μM), plasminogen (0.24μM), and tPA (20pM) in the absence (gray line) and presence (black line) of polyP65 (325μM) by adding atroxin (10 μg/mL) and CaCl2 (5mM; n = 4). (B) Soluble fibrin was repolymerized in the presence of plasminogen (0.24μM) and tPA (20pM) in the absence (gray line) and presence (black line) of polyP 65 (325μM; n = 5). (C) Clots were generated with purified fibrinogen clotted with (black line) and without (pale gray line) polyP65 (325μM). Clots were incubated for 30 minutes at 37°C before overlaying with a mixture of plasminogen (0.55μM) and tPA (10nM) with (dark gray line) and without polyP65 (325μM; n = 8). Results are normalized and expressed as the mean ± SEM.
Plasmin generation and binding of both tPA and plasminogen is attenuated by polyphosphate
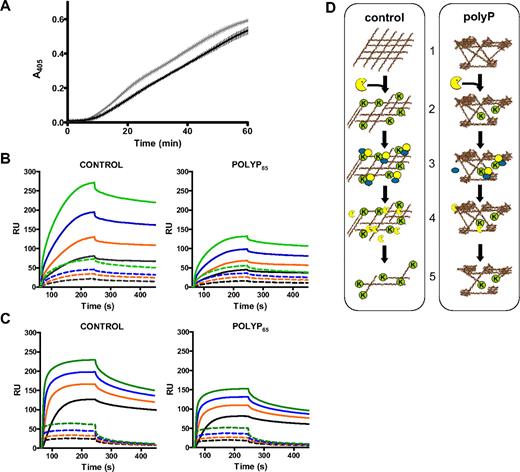
The effect of polyP on the activation of plasminogen by tPA was assessed by incorporating the chromogenic substrate S2251 during clot formation. Plasmin generation was slower on fibrin formed in the presence of polyP65 (325μM) compared with control fibrin (Figure 7A; P < .001), consistent with a slower rate of lysis (Figure 6C). Reduced plasmin generation by polyP65 was not observed in the absence of fibrin, and there was no direct effect of polyP65 on the activity of preformed plasmin (not shown).
PolyP attenuates the binding of fibrinolytic enzymes and the cofactor activity of fibrin. (A) Fibrin clots containing plasminogen (0.55μM) were formed with purified fibrinogen (2.4μM) in the absence (gray line) and presence (black line) of polyP65 (325μM) by adding thrombin (1 U/mL) and CaCl2 (5mM). Clots were lysed by overlaying with tPA (5nM) in the presence of S2251 (0.12mM), and readings were recorded at 405 nm. Plasmin generation at 405 nm over time is shown, and results are expressed as mean ± SEM, n = 3. (B) Fibrinogen was captured on the surface of a CM5 chip and converted to fibrin by thrombin (1 U/mL) in the absence and presence of polyP65 (325μM). Binding of 125nM (black), 250nM (orange), 500nM (blue), and 1000nM (green) plasminogen was analyzed (dashed lines). The surface was then treated with plasmin (30nM), and binding of plasminogen, at the concentrations described above, was repeated (solid lines). (C) As described for panel B with 31.25nM (black), 62.5nM (orange), 125nM (blue), and 250nM (green) tPA instead of plasminogen. (B-C) Experiments performed in triplicate and are expressed as mean ± SEM. (D) Schematic representation of polyP-induced down-regulation of fibrinolysis. (1) Fibrin formed in the presence of polyP has a heterogeneous structure composed of tightly knotted regions interspersed with large pores. (2) Plasmin (yellow) is less efficient at cleaving this heterogeneous fibrin structure, thereby reducing the exposure of C-terminal lysines (K) on the fibrin surface. (3) The capacity of fibrin to sequester tPA and plasminogen on its surface is subsequently reduced, and the cofactor role of fibrin in tPA-mediated plasminogen activation is diminished. (4) This leads to less plasmin formation. (5) As a result fibrinolysis is down-regulated in clots formed in the presence of polyP.
PolyP attenuates the binding of fibrinolytic enzymes and the cofactor activity of fibrin. (A) Fibrin clots containing plasminogen (0.55μM) were formed with purified fibrinogen (2.4μM) in the absence (gray line) and presence (black line) of polyP65 (325μM) by adding thrombin (1 U/mL) and CaCl2 (5mM). Clots were lysed by overlaying with tPA (5nM) in the presence of S2251 (0.12mM), and readings were recorded at 405 nm. Plasmin generation at 405 nm over time is shown, and results are expressed as mean ± SEM, n = 3. (B) Fibrinogen was captured on the surface of a CM5 chip and converted to fibrin by thrombin (1 U/mL) in the absence and presence of polyP65 (325μM). Binding of 125nM (black), 250nM (orange), 500nM (blue), and 1000nM (green) plasminogen was analyzed (dashed lines). The surface was then treated with plasmin (30nM), and binding of plasminogen, at the concentrations described above, was repeated (solid lines). (C) As described for panel B with 31.25nM (black), 62.5nM (orange), 125nM (blue), and 250nM (green) tPA instead of plasminogen. (B-C) Experiments performed in triplicate and are expressed as mean ± SEM. (D) Schematic representation of polyP-induced down-regulation of fibrinolysis. (1) Fibrin formed in the presence of polyP has a heterogeneous structure composed of tightly knotted regions interspersed with large pores. (2) Plasmin (yellow) is less efficient at cleaving this heterogeneous fibrin structure, thereby reducing the exposure of C-terminal lysines (K) on the fibrin surface. (3) The capacity of fibrin to sequester tPA and plasminogen on its surface is subsequently reduced, and the cofactor role of fibrin in tPA-mediated plasminogen activation is diminished. (4) This leads to less plasmin formation. (5) As a result fibrinolysis is down-regulated in clots formed in the presence of polyP.
We next used surface plasmon resonance to investigate the effects of polyP on the binding of plasminogen and tPA to fibrin. Fibrinogen, captured on a CM5 sensor chip, was converted to fibrin with or without polyP65 (325μM) by injecting thrombin (1 U/mL) in the presence of calcium (2.5mM). The surface was treated with 1M NaCl to remove fibrin-bound thrombin. Binding of plasminogen (0-1μM; Figure 7B dashed lines) and tPA (0-250nM; Figure 7C dashed lines) to fibrin formed in the presence of polyP65 was only slightly reduced compared with control surfaces. Exposure of surfaces to plasmin (30nM) resulted in a drop in the baseline, consistent with fibrin degradation. This effect was less pronounced on fibrin surfaces formed in the presence of polyP65 (37.5% assuming 100% for control). Plasmin degradation of fibrin significantly enhanced binding of both plasminogen (Figure 7B solid lines) and tPA (Figure 7C solid lines). The presence of polyP65 during fibrin formation dramatically impairs the ability of plasminogen (Figure 7B) and tPA (Figure 7C) to bind to partially lysed fibrin; a similar fold decrease was noted for both proteins relative to control values (Table 1). Collectively these results suggest that polyP down-regulates fibrinolysis by a 2-tier process (Figure 7D), whereby changes in fibrin structure delay plasmin degradation of the clot. This, in turn, reduces the availability of lysine binding sites on partially lysed fibrin, thereby attenuating binding of tPA and plasminogen and further decreasing plasmin generation and fibrinolysis.
Discussion
The fibrin matrix is a dynamic environment that dictates the stability and resistance of a clot to degradation by fibrinolytic enzymes. This study shows that polyP, a negatively charged polymer that is released from platelet-dense granules on activation,19 binds to fibrin(ogen), generating heterogeneous clots characterized by knotted regions interspersed with large pores. We found that lysis of these clots by tPA and plasminogen or plasmin is impaired and that plasmin generation is attenuated. Binding studies showed a reduction in the association of plasminogen and tPA to partially lysed fibrin surfaces formed in the presence of polyP. These experiments show that polyP induces changes in fibrin structure that interfere with its ability to be degraded by plasmin and bind fibrinolytic proteases, thereby interfering with its role as a cofactor in tPA-mediated activation of plasminogen. Both these processes result in a more stable fibrin clot.
The lag phase of fibrin polymerization was not affected by polyP, suggesting that fibrinopeptide A release, oligomer formation, and conversion to protofibrils occur in a normal manner.6 Release of fibrinopeptide B stimulates lateral aggregation that arises once protofibrils reach a sufficient length. Experimentally, it is reflected by a rapid increase in turbidity that is directly related to the average fiber cross-sectional area.29 The maximal turbidity was lower in the presence of polyP, indicating a possible shift in average fiber diameter. However, measurements of fiber diameter on scanning electron microscopy and confocal microscopy showed that fiber thickness remained unaltered in the presence of polyP. Instead, clusters of tightly knit fibers were found interspersed with looser fibrin structures. The ratio of these clusters over the areas of loose structures may explain the differences in maximal absorbancy observed in turbidity experiments. Consistent with the decrease in maximal turbidity, the permeability constant Ks of clots formed with polyP was lower.
Microscopy studies30 following fibrin formation in real time show that initial scaffold formation corresponds to the lag phase in turbidity curves with branching, lateral, and longitudinal growth of fibers continuing until network formation is complete. The effects of polyP on fibrin structure were clearly evident at the microscopic level with formation of distinct bundles of fibers rather than the homogenous distribution observed in control samples. These effects on fibrin structure were apparent both with scanning electron microscopy on fixed, processed clots and with laser scanning confocal microscopy on fully hydrated clots. High magnification images did not reveal clear differences in the diameter of individual fibers but showed structures of highly knotted fibers. Remarkably, the changes in fibrin fiber arrangement that we observe with polyP appear similar to the structure of fibrin-surrounding platelets, as found by Collet et al,16 This suggests that polyP released by platelets may contribute to the tightly knitted fibrin structures surrounding these cells, an observation that requires further investigation. Our data on fibrin clot structure in part contrast a previous report,27 which showed a significant increase in the diameter of the fibrin fibers in the presence of polyP. These discrepancies perhaps result from the higher concentrations of polyP in that study, generally 1mM compared with 0.325mM in our study, although lower concentrations were found to increase fiber diameter albeit at a more modest level. Another explanation could be the 10 to 15 minutes of preincubation of fibrinogen, calcium, and polyP necessary for the increase in fiber thickness to be observed. In our study the changes in fibrin structure were independent of the order of addition of components, as long as polyP was added before clot formation. It is noteworthy that purified fibrinogen, such as that used here and in Smith and Morrissey,27 is preloaded with calcium as no steps were taken to chelate ions from fibrinogen or the buffer before clotting was initiated.
Identical patterns of fibrinopeptide release from fibrinogen were observed by HPLC in the presence and absence of polyP, confirming the turbidimetric analysis and indicating that this is not the point at which polyP influences fibrin formation. Similarly, the effect of polyP is not mediated through cross-linking because depletion of contaminating FXIII or addition of purified FXIII did not alter the ability of polyP to modify fibrin structure. These data confirm previous reports that polyP does not alter fibrin cross-linking27 or FXIIIa activity.28 The fibrin(ogen) αC regions, which are liberated from the central E region after removal of fibrinopeptide B, have been reported to influence lateral aggregation of fibrils.31 This region has a positive charge, in contrast to the net negative charge of fibrin(ogen), and has been shown to be involved in lateral association.32 It is therefore feasible that the αC regions provide an appropriate surface for a highly negatively charged molecule, such as polyP, to bind. Interestingly, a study that included homo poly(L-amino acids) during fibrin formation showed altered fibrin networks on inclusion of positive but not negative polymers.33 The negatively charged glycosaminoglycan heparin, which binds to the N-terminus of the β chain of fibrin,34,35 generates clots with thicker fibers and larger pores that results in increased susceptibility to fibrinolytic degradation.36 These divergent effects of anionic polymers on fibrin structure indicate that, although charge may be important, there are more subtleties to be considered. It is plausible that polyP bridges fibers during assembly or acts as a point of nucleation, but further studies will be required to define the underlying mechanism.
The composition of the fibrin network affects its susceptibility to fibrinolysis, with the number of fibers per volume having more effect than individual fiber diameter.37 PolyP induced a dose-dependent delay in time to 50% lysis when included in clots at the time of formation, but not if added to preformed fibrin clots alongside the lytic agents. When soluble fibrin was allowed to repolymerize in the presence of polyp, lysis was unchanged. These experiments are consistent with polyP exerting its effect during conversion of fibrinogen to fibrin. For the most part, this study investigated intrinsic lysis, when the components of the fibrinolytic system are incorporated during clot formation. This mode of lysis is akin to situations in vivo, when clotting and fibrinolysis are triggered simultaneously, and act side by side, balancing fibrin deposition and breakdown. Increasing the tPA concentration annihilated the differences in lysis observed with polyP, most probably because of the rapid fibrin-independent conversion of plasminogen to plasmin. Nevertheless, delayed lysis of clots was still observed with preformed plasmin, suggesting the effect was related to the structure of the fibrin network and/or the ability of plasmin to interact with the fibrin surface. Plasmin activity toward a chromogenic substrate was not affected by polyP, but fibrin-enhanced tPA-stimulated plasminogen activation was down-regulated. Binding of plasminogen and tPA to fibrin formed in the presence of polyP was only slightly attenuated, but after plasmin treatment of the fibrin surface this effect was dramatically magnified. These data indicate that polyP affects fibrinolysis at 2 levels, as represented in the schematic in Figure 7D. Plasmin is less efficient at cleaving fibrin formed in the presence of polyP which reduces the exposure of lysine binding sites. This ultimately decreases the capacity of fibrin to act as a cofactor in tPA-mediated plasminogen activation, thereby reducing plasmin generation and further delaying fibrinolysis.
Delayed fibrinolysis of clots formed in the presence of polyP was evident over a range of thrombin concentrations, further illustrating that the ability of this polymer to influence fibrin structure and lysis was independent of thrombin or fibrinopeptide cleavage. These observations were substantiated with snake venom atroxin, which cleaves only fibrinopeptide A from fibrinogen, and showed that polyP can induce a similar down-regulation of fibrinolysis. Calcium binds to several sites in fibrinogen. Calcium binding has been shown, using a variant fibrinogen lacking the β2 binding site, to regulate lateral aggregation.38 PolyP is known to chelate divalent metal ions such as calcium.39 The effects of polyP on fibrin structure cannot, however, be explained by simple sequestration, because the experiments were performed with a large molar excess of calcium (5mM) over the concentration of phosphate groups (typically 650μM, which could bind 0.33mM Ca2+). Furthermore, effects on lysis were not observed by adding a similar concentration of the monomer that would sequester equal amounts of calcium. Dose responses to calcium showed a bell-shaped curve with a minimal effect of polyP on lysis at either end of the scale. A possible explanation for these observations is that polyP is binding at or near a calcium binding site and is interfering with fibrin formation, leading to an altered network that is cleaved less effectively by plasmin. The similar fiber diameters in the presence of polyP suggest that lateral aggregation is unaffected, in agreement with an effect that is independent of calcium modulation. The observation that fibrin structure in the presence of polyP shows areas of tightly knit fibers interspersed by more loosely packed structures suggests that polyP interferes with fiber branching rather than with lateral aggregation.
The concentration of polyP in serum is reported to reach approximately 50μM40 ; therefore, it is plausible that local concentrations of 5- to 10-fold higher could be readily achieved during clot formation. Our data indicate that polyP produces prothrombotic fibrin structures with increased resistance to fibrinolysis. These effects result from architectural differences in the clot that occur during conversion of fibrinogen to fibrin. These changes affect the ability of plasmin to cleave the network and reduce exposure of lysine binding sites, thereby modulating the cofactor capacity of fibrin in tPA-mediated plasminogen activation. Secretion of polyP by platelets during clot formation will therefore lead to a more stable fibrin clot, and this may have important implications for thrombotic disease.
The publication costs of this article were defrayed in part by page charge payment. Therefore, and solely to indicate this fact, this article is hereby marked “advertisement” in accordance with 18 USC section 1734.
Acknowledgments
This work was supported by a start-up grant from the British Society of Haemotology and by the British Heart Foundation (PG/07/122; N.J.M. and R.E.), (PG/06/089/21 244; S.U.d.W., H.P., and R.A.S.A.).
Authorship
Contribution: N.J.M. performed research, analyzed data, and wrote the manuscript; R.E. and S.U.d.W. performed research; H.P. analyzed data; and R.A.S.A. analyzed data and wrote the manuscript.
Conflict-of-interest disclosure: The authors declare no competing financial interests.
Correspondence: Nicola J. Mutch, 7.56 b Garstang Bldg, Faculty of Biological Sciences, University of Leeds, Leeds, LS2 9JT, United Kingdom; e-mail: n.j.mutch@leeds.ac.uk.

![Figure 2. PolyP-induced changes in fibrin formation and structure. (A) Fibrinogen (2.4μM) was clotted in the absence (gray line) and presence (black line) of polyP65 (325μM) by an activation mix of thrombin (0.25 U/mL) and CaCl2 (5mM). The turbidity was monitored at 340 nm every 12 seconds for 30 minutes, and the results are expressed as mean ± SEM (n = 4). (B) Fibrinopeptide release from fibrinogen during polymerization with thrombin (0.2 U/mL) and CaCl2 (5mM) was monitored over time by reverse-phase high-performance liquid chromatography (HPLC) in the absence (open symbols) and presence (closed symbols) of polyP65 (325μM). The concentration of fibrinopeptide A (circles) and fibrinopeptide B (triangles) at each time point is expressed as a fraction of maximal release ([FP]/[FP]max, so that complete release is equal to 1). The inset shows the linear part of the curve.](https://ash.silverchair-cdn.com/ash/content_public/journal/blood/115/19/10.1182_blood-2009-11-254029/4/m_zh89991052590002.jpeg?Expires=1768222567&Signature=Ai-2yv5hwWbYmBDLa-bVKkcPZH71dg8j~Efw6QBx~JHQjkbBR~lpPKfFVlomsrthXC5~33XVSZMSvXawVdPs9yEn1N7NM4JYlctJhxBfn-jlIs-a6tfUN1KX~e93iEGPYf-u4MLAK~cgiFSPP2aX-vn4~8Du8SukqEbhSWw3CIuT88tp4AItDZTfPEVP44b-WXdYlZcDGUK8aHIAPRJkiVEqtHS7wwgJ-9Y83Q-H10u6sv7u~Wz8VT4AeIhqKTze7L6WUL36M5RJ2Uf5Zzl3Q3tU0APTxMhcQtLCYVSTwyzJ~R1YNIKSVRs3YFGfiPQueGWTg~9HWB~LhChwvWeM-A__&Key-Pair-Id=APKAIE5G5CRDK6RD3PGA)


![Figure 2. PolyP-induced changes in fibrin formation and structure. (A) Fibrinogen (2.4μM) was clotted in the absence (gray line) and presence (black line) of polyP65 (325μM) by an activation mix of thrombin (0.25 U/mL) and CaCl2 (5mM). The turbidity was monitored at 340 nm every 12 seconds for 30 minutes, and the results are expressed as mean ± SEM (n = 4). (B) Fibrinopeptide release from fibrinogen during polymerization with thrombin (0.2 U/mL) and CaCl2 (5mM) was monitored over time by reverse-phase high-performance liquid chromatography (HPLC) in the absence (open symbols) and presence (closed symbols) of polyP65 (325μM). The concentration of fibrinopeptide A (circles) and fibrinopeptide B (triangles) at each time point is expressed as a fraction of maximal release ([FP]/[FP]max, so that complete release is equal to 1). The inset shows the linear part of the curve.](https://ash.silverchair-cdn.com/ash/content_public/journal/blood/115/19/10.1182_blood-2009-11-254029/4/m_zh89991052590002.jpeg?Expires=1768710529&Signature=Wfc4IuJYd44oXL3d-1oTuWMVkurNDO41KvziwNoxdq2-FdGEtcEI72gxL0fM6d0eX-wVbzU0PY-FrAtxZVUDW5UMTMwTv9t7~vlEWe0~8Jr9P5sSPaz5T~9rlHTbv8IZXVzORxmsPS9I-u2u5Jh1~MbNnHKBAXL977orLFXuOat8t8pctHNZX421h~ORKJceiWG-ILnXzgdAHYAp22TQDpQBqGyrhYQ6G79VWkJsFdhMoIMKE34MY4trV6K6AFry7W179HjILXteEuBbReORM3XrmmJbqQulb1kj8J~~i9VQ4~IiU7Q7dysemzq9K1QQQ0uZjA3HkoHWOwUCQTi0JQ__&Key-Pair-Id=APKAIE5G5CRDK6RD3PGA)
