Abstract
Human parvovirus B19 (B19V) infection shows a strong erythroid tropism and drastically destroys erythroid progenitor cells, thus leading to most of the disease outcomes associated with B19V infection. In this study, we systematically examined the 3 B19V nonstructural proteins, 7.5kDa, 11kDa, and NS1, for their function in inducing apoptosis in transfection of primary ex vivo–expanded erythroid progenitor cells, in comparison with apoptosis induced during B19V infection. Our results show that 11kDa is a more significant inducer of apoptosis than NS1, whereas 7.5kDa does not induce apoptosis. Furthermore, we determined that caspase-10, an initiator caspase in death receptor signaling, is the most active caspase in apoptotic erythroid progenitors induced by 11kDa and NS1 as well as during B19V infection. More importantly, cytoplasm-localized 11kDa is expressed at least 100 times more than nucleus-localized NS1 at the protein level in primary erythroid progenitor cells infected with B19V; and inhibition of 11kDa expression using antisense oligos targeting specifically to the 11kDa-encoding mRNAs reduces apoptosis significantly during B19V infection of erythroid progenitor cells. Taken together, these results demonstrate that the 11kDa protein contributes to erythroid progenitor cell death during B19V infection.
Introduction
Human parvovirus B19 (B19V) infection is the cause of “fifth disease,” a highly contagious infection of childhood. B19V infection can result in serious and occasionally fatal hematologic diseases in susceptible patients.1 In patients with increased destruction of red cells and a high demand for the production of erythrocytes, acute B19V infection can cause transient aplastic crisis. Pure red cell aplasia can also be a manifestation of persistent B19V infection in immunocompromised or immunodeficient patients.
B19V belongs to the genus Erythrovirus in the family Parvoviridae.2 Spanned by 2 identical terminal hairpin repeats, the 5.6-kb linear single-stranded DNA genome of B19V encodes a single nonstructural protein (NS1), and 2 capsid proteins (VP1 and VP2). Two other smaller nonstructural proteins, 7.5kDa and 11kDa, have been detected during B19V infection.3,4 The 11kDa protein is translated from a small left–open reading frame (ORF) that overlaps with the C-terminal of the VP1/VP2 ORF in a different frame. The 7.5kDa protein is translated from a small mid-ORF. NS1 is a multiple functional polypeptide essential to viral replication and regulation of gene expression that is cytotoxic to host cells.5-8 The 11kDa protein has been shown to have a role in virion production and trafficking in infected cells, whereas the 7.5kDa protein has not yet been reported to have functions during B19V infection.9
B19V shows extreme tropism for erythroid progenitor colony-forming unit–erythroid cells and burst-forming unit–erythroid cells in the bone marrow of patients.10-12 Disease manifestations of B19V infection, as seen in transient aplastic crisis, pure red cell aplasia, and hydrops fetalis, are due to the direct cytotoxicity of the virus,13 a direct outcome of the cell death of erythroid progenitors that are targets of B19V replication. A progressive host cell apoptosis has been identified during B19V infection of primary erythroid progenitor cells and megakaryoblastoid cell lines.5,14 NS1 expression in megakaryoblastoid cell lines has been associated with B19V-induced apoptosis5,14 ; however, the kinetics of NS1 expression has not correlated with that of induced apoptosis during B19V infection of megakaryoblastoid cell line UT7/Epo-S1, which is semipermissive to B19V infection.15,16 These findings raise the question about the role of NS1 in inducing apoptosis during B19V infection.
In the present study, we show for the first time that 11kDa is a more significant inducer of apoptotic cell death than NS1 in transfection of primary erythroid progenitor cells. Because 11kDa is expressed at least 100 times more than NS1 at the steady-state protein level in erythroid progenitor cells during B19V infection, we conclude that the B19V infection–induced apoptosis of erythroid progenitor cells is largely mediated by the small nonstructural 11kDa protein.
Methods
Cells and virus infection
HeLa cells, 293 cells, K562 cells, and UT7/Epo-S1 cells were maintained as previously described.17,18 Human primary CD36+ erythroid progenitor cells (CD36+ EPCs) were expanded ex vivo in the expansion medium as previously described.18,19 Large numbers of CD36+ EPCs, which were used for either transfection or B19V infection, were obtained on day 8 or day 9. The animal protocol for producing antibodies was approved by the Institutional Animal Care and Use Committee at the University of Kansas Medical Center.
Twenty microliters of B19V viremic plasma that contained 1012 copies of B19V genome per milliliter were incubated with 2 × 10⁶ cells in a volume of 500 μL of medium with slow rotation at 4°C for 2 hours. Infected cells were then cultured in the expansion medium at a concentration of 2 × 10⁵ cells/mL at 37°C with 5% CO2.
Caspase inhibitors
Two general caspase inhibitors, pan-caspase fmk inhibitor Z-VAD-fmk (Z-VAD) and Oph inhibitor Q-VD-Oph (Q-VD), and 9 individual caspase inhibitors (caspases-1, -2, -3&7, -4, -6, -8, -9, -10, and -13 inhibitors) were purchased from R&D Systems.
Morpholino oligos
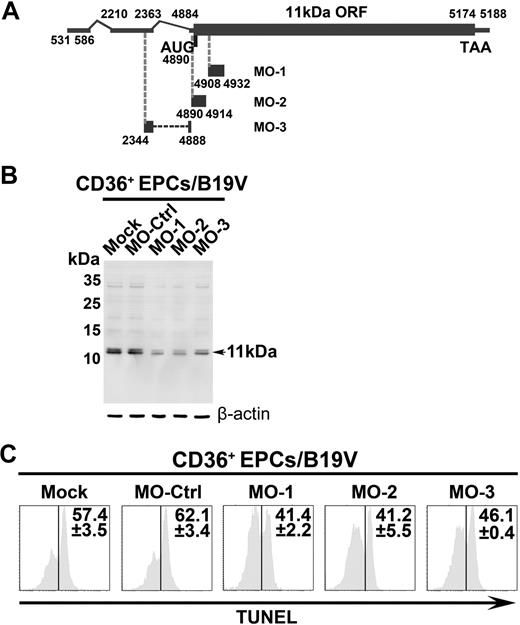
Three Morpholino antisense oligos were designed to specifically target sequences in the region of the AUG translation start site of the 11kDa-encoding mRNAs, which are diagramed in Figure 5A. Their sequences, written from 5′ to 3′ and complementary to the 11kDa-encoding mRNA, are as follows: MO-1: TCTTCAGGCTTTTCATATCCATGTC; MO-2: CCATGTCTGTGGTGTTGTTTTGCAT; and MO-3: TGTAGAGTTCACGAAACTGGTCTGC. The Morpholino oligos were synthesized at Gene Tools LLC, and Endo-Porter was used for delivery following the manufacturer's protocol. A random control Morpholino was used as a control.
Plasmid construction
NS1, 7.5kDa, and 11kDa expression plasmids in mammalian cells.
Green fluorescent protein (GFP) was cloned into pNTAP-B (Stratagene) by BamHI and EcoRI as pGFP. Then we cloned the NS1 ORF (nucleotides [nt's] 616-2631), the 7.5kDa mid-ORF (nt's 2090-2305), and the 11kDa ORF (nt's 4890-5171) into this pGFP plasmid through EcoRI/XhoI sites as pGFP-NS1, pGFP-7.5kDa, and pGFP-11kDa, respectively. pRFPHA, pRFP-NS1HA, and pRFP-11kDaHA were constructed by replacing GFP with RFPHA (C-terminal HA-tagged red fluorescent protein, DsRed; Clontech), RFP-NS1HA, and RFP-11kDaHA (NS1 and 11kDa were HA tagged at C-terminal) in the pGFP, respectively.
Bacterial expression plasmids of glutathione S-transferase–fused B19V proteins.
The 11kDa ORF and the N-terminus encoding sequence (nt's 616-1158) of the NS1 were cloned into pGEX4T3 (GE Healthcare) as pGEX11kDa and pGEXNS1 (amino acids [aa's] 1-181), respectively.
RT real-time PCR
Production of antisera against B19V nonstructural proteins
Transfection
The 293 and HeLa cells were transfected with 2 μg of DNA per 60-mm dish using Lipofectamine and Plus reagent (Invitrogen) as previously described.23 K562 cells were electroporated with 2 μg of DNA per 2 × 10⁶ cells using reagent V and program T6 with the Amaxa Nucleofector (Lonza Inc). UT7/Epo-S1 cells and CD36+ EPCs were electroporated with 2 μg of DNA per 2 × 10⁶ cells, using a universal transfection reagent with program X-005 as previously described.18 After transfection, CD36+ EPCs were maintained in the expansion medium.18,19
SDS-PAGE, Western blotting, and immunofluorescence
Flow cytometric analysis
Annexin V/propidium iodide staining.
Unfixed cells were stained with cyanin 5 (Cy5)–conjugated annexin V (BD Biosciences) and propidium iodide (PI; Sigma-Aldrich) together to detect apoptotic cells according to the manufacturer's instructions (BD Biosciences).
TUNEL.
Terminal deoxynucleotidyl transferase deoxyuridine triphosphate nick end labeling (TUNEL) assay was performed basically according to the manufacturer's protocol (MBL International), with the modification that streptavidin-Cy5 (Jackson ImmunoResearch) was used to develop fluorescence.
FLICA.
Live cells (106) were stained with respective FAM-labeled fluorochrome inhibitor of caspase assay (FLICA) peptide according to the manufacturer's manual (Immunochemistry Tech).
All the samples were analyzed on the 3-laser flow cytometer (LSR II; BD Biosciences) within an hour of staining at the Flow Cytometry Core at the University of Kansas Medical Center. All flow cytometric data were analyzed using FACSDiva software (BD Biosciences).
Results
11kDa induces apoptosis in both B19V permissive and nonpermissive cells
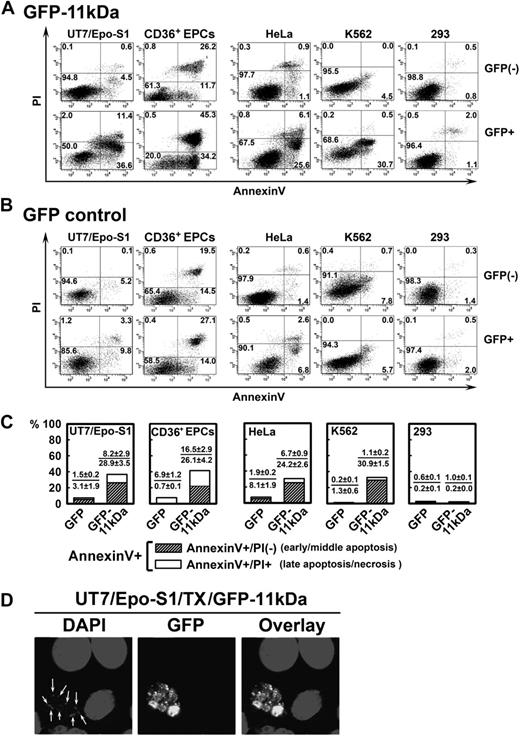
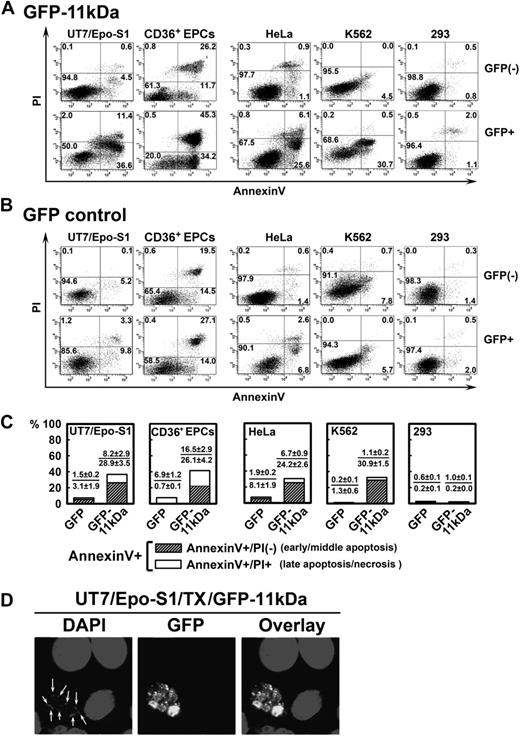
To examine the potential role of 11kDa in inducing apoptosis, we transfected pGFP-11kDa and pGFP plasmids, respectively, into both B19V permissive and nonpermissive cells. The GFP-positive (GFP+) population was selectively gated and analyzed in comparison with the GFP-negative (GFP−) population using annexin V/PI double staining. There were significantly more annexin V-positive (annexin V+) cells in GFP-11kDa–expressing UT7/Epo-S1 cells, CD36+ EPCs, HeLa cells, and K562 cells than in GFP control–expressing cells (Figure 1A-B, GFP+), but no significant difference was observed between the GFP-11kDa and GFP-expressing 293 cells (Figure 1A-B, GFP+ 293).
Transfection of 11kDa induces apoptosis in both B19V permissive and nonpermissive cells. (A-B) UT7/Epo-S1 cells, CD36+ EPCs, HeLa cells, K562 cells, and 293 cells were transfected with pGFP-11kDa plasmid (A) or pGFP as a control (B). CD36+ EPCs were stained at 24 hours after transfection; other cells were stained at 48 hours after transfection with annexin V/PI double staining, followed by flow cytometric analysis. Both GFP-negative (GFP−) and GFP-positive (GFP+) cell populations were gated to plot cells by PI versus annexin V. Only a representative experiment is shown, and the percentage of each quadrant is indicated. Annexin V+ population is a combination of the annexin V+/PI+ population (number in the upper right quadrant) with the annexin V+/PI− population (number in the lower right quadrant). (C) The experiments as described in panels A and B were performed at least 3 times independently. The percentage value of annexin V+/PI+ or annexin V+/PI−, as shown in individual panel with indicated cell type, was calculated by subtracting the annexin V+/PI+ population or the annexin V+/PI− population of GFP+ cells by that of GFP− cells (background apoptosis). (D) UT7/Epo-S1 cells were transfected with pGFP-11kDa and stained with DAPI. Confocal images were taken at a magnification of 60× (objective lens) with an Eclipse C1 Plus confocal microscope (Nikon). Arrows show apoptotic nuclei, which were enclosed in the apoptotic bodies visualized by GFP fluorescence. Results that are shown as average ± SD in all the figures are generated from at least 3 independent experiments. Tx indicates transfection.
Transfection of 11kDa induces apoptosis in both B19V permissive and nonpermissive cells. (A-B) UT7/Epo-S1 cells, CD36+ EPCs, HeLa cells, K562 cells, and 293 cells were transfected with pGFP-11kDa plasmid (A) or pGFP as a control (B). CD36+ EPCs were stained at 24 hours after transfection; other cells were stained at 48 hours after transfection with annexin V/PI double staining, followed by flow cytometric analysis. Both GFP-negative (GFP−) and GFP-positive (GFP+) cell populations were gated to plot cells by PI versus annexin V. Only a representative experiment is shown, and the percentage of each quadrant is indicated. Annexin V+ population is a combination of the annexin V+/PI+ population (number in the upper right quadrant) with the annexin V+/PI− population (number in the lower right quadrant). (C) The experiments as described in panels A and B were performed at least 3 times independently. The percentage value of annexin V+/PI+ or annexin V+/PI−, as shown in individual panel with indicated cell type, was calculated by subtracting the annexin V+/PI+ population or the annexin V+/PI− population of GFP+ cells by that of GFP− cells (background apoptosis). (D) UT7/Epo-S1 cells were transfected with pGFP-11kDa and stained with DAPI. Confocal images were taken at a magnification of 60× (objective lens) with an Eclipse C1 Plus confocal microscope (Nikon). Arrows show apoptotic nuclei, which were enclosed in the apoptotic bodies visualized by GFP fluorescence. Results that are shown as average ± SD in all the figures are generated from at least 3 independent experiments. Tx indicates transfection.
In UT7/Epo-S1 cells, the population of annexin V+ cells induced by GFP-11kDa reached a high rate of 48.0% at 48 hours after transfection in GFP+ cells (Figure 1A, GFP+ S1). In contrast, GFP− cells in the same sample showed only 5.1% annexin V+ cells (Figure 1A, GFP− S1). Less than 13.1% of GFP+ cells in the pGFP-transfected cells (as control) were stained with annexin V (Figure 1B, GFP+ S1). GFP-11kDa induced an average of 37.1% more annexin V+ cells in GFP+ cells than in GFP− cells at 48 hours after transfection (Figure 1C, GFP-11kDa S1), indicating that the annexin V+ population of GFP+ cells in the pGFP-11kDa–transfected cells is predominately induced by the 11kDa, not the GFP.
The GFP-11kDa also induced a high annexin V+ population in CD36+ EPCs that are highly permissive to B19V infection in vitro and are the primary cells most closely resembling the colony-forming unit–erythroid cells and burst-forming unit–erythroid cells in the bone marrow of patients.19 Similar to UT7/Epo-S1 cells, GFP-11kDa induced an average of 42.6% more annexin V+ cells in GFP+ cells than in GFP− cells at 24 hours after transfection (Figure 1C, GFP-11kDa CD36+). In comparison, pGFP control transfection resulted in only approximately 7% annexin V+ cells over the background (Figure 1C, GFP CD36+). Notably, we observed a significant amount of background cell death in transfected CD36+ EPCs, which presumably was induced by the electroporation and despite the optimized conditions that allowed us to transfect the CD36+ EPCs. At 24 hours after transfection, as much as 34% of the background annexin V+ population was detected in GFP− cells of pGFP-transfected CD36+ EPCs (Figure 1B, GFP− CD36+). This amount increased to more than 50% at 48 hours after transfection, which made assessing apoptosis induced by transfection of the GFP-11kDa less accurate (data not shown). Therefore, we chose to assay transfected CD36+ EPCs only at 24 hours after transfection.
The 11kDa also induced a significant amount of annexin V+ cells in B19V nonpermissive cells, HeLa and K562 cells, in addition to these B19V permissive cells. We observed more than 30% of annexin V+ cells in GFP+ population of the pGFP-11kDa–transfected cells of both types at 48 hours after transfection (Figure 1A, GFP+ HeLa and K562). Conversely, pGFP transfection alone induced only approximately 9% and 6% of the annexin V+ population in GFP+ HeLa and K562 cells, respectively (Figure 1B, GFP+ HeLa and K562). However, the GFP-11kDa was not able to induce a significant amount of annexin V+ population in 293 cells (Figure 1 A,C, 293); E1b-19kDa protein that is expressed in 293 cells inhibits apoptosis perhaps in a way similar to that of Bcl-xL.26,27 In the pGFP transfection control of all the 5 cell types, GFP did not significantly induce the annexin V+ population in GFP+ cells of transfected cells in comparison with that in GFP− cells (Figure 1B). When we transfected the CD36+ EPCs, however, we noted a relatively high percentage of annexin V+ population in GFP− cells of both pGFP-11kDa– and pGFP-transfected cells (Figure 1A-B, CD36+), which indicated background cell death that was caused in part by the electroporation.
The majority of annexin V+ cells induced by GFP-11kDa stained PI-negative (annexin V+/PI−), and thus were in the early or middle stage of apoptosis. Specifically, approximately 80% of annexin V+ cells stained PI-negative in UT7/Epo-S1, HeLa, and K562 cells, and 60% stained PI-negative in CD36+ EPCs (Figure 1C, annexin V+/PI−). The cell population of annexin V+/PI+ is an indicator of either late apoptosis or necrosis (Figure 1C, annexin V+/PI+). In addition, we directly visualized a representative cell with GFP-11kDa expression with distinct cellular nucleus degradation. We also observed small apoptotic bodies enclosing a degraded nucleus by green fluorescence (Figure 1D).28,29 Overall, these results suggest that the 11kDa induces cell death with apoptotic features rather than necrosis in both B19V permissive and nonpermissive transfected cells. Further supporting this finding, 11kDa did not induce an annexin V+ cell population in 293 cells.
11kDa is a more significant inducer of apoptosis than NS1
The apoptotic nature of NS1 has not been examined in primary erythroid progenitor cells. We sought to determine which protein, 11kDa or NS1, was more potent in inducing apoptosis in UT7/Epo-S1 cells and CD36+ EPCs. For comparison, we also studied the 7.5kDa, another small nonstructural protein shown to be expressed during B19V infection but with an unknown function.3
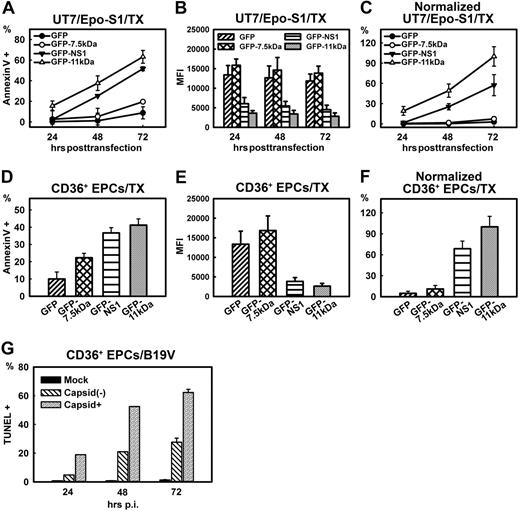
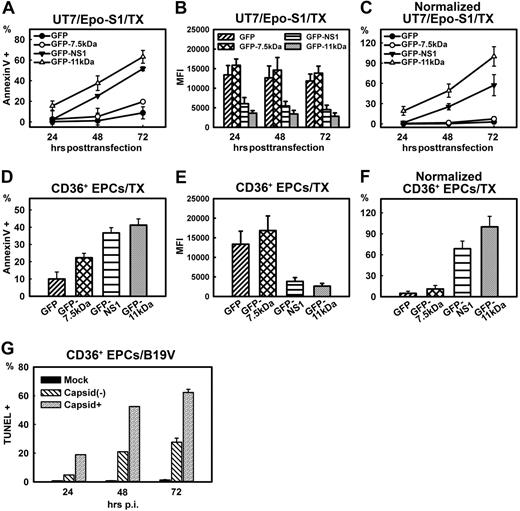
Whereas the GFP-11kDa and the GFP-NS1 both extensively induced annexin V+ cells when transfected to UT7/Epo-S1 cells, the GFP-7.5kDa poorly induced the annexin V+ population in GFP+ cells (Figure 2A). In a time-dependent manner, the GFP-11kDa caused the annexin V+ population to increase from less than 20% to more than 60%, at 24 to 72 hours after transfection (Figure 2A). At all 3 time points, the extent of the GFP-11kDa–induced annexin V+ population was significantly higher than that induced by the GFP-NS1 (Figure 2A). However, at 72 hours after transfection only, an increased population of annexin V+ cells, approximately 16%, was observed in pGFP-7.5kDa–transfected cells compared with the pGFP-transfected control (8%; Figure 2A). To better evaluate the potency of the NS1 and the 11kDa in inducing apoptosis, we normalized the level of annexin V+ population by the level of protein expression represented by the mean intensity of the green fluorescence of the GFP detected by flow cytometer (Figure 2B).30-32 Results normalized by GFP were plotted as relative values to that of the GFP+ population of pGFP-11kDa–transfected cells, which was arbitrarily set to 100% (Figure 2C). Transfecting the GFP-11kDa induced approximately 2-fold more annexin V+ cells than transfecting the GFP-NS1 did (Figure 2C), indicating that the 11kDa is twice as potent in inducing apoptosis than the NS1 in UT7/Epo-S1 cells. However, the difference between the GFP control and GFP-7.5kDa transfection groups was not statistically significant after normalization, suggesting that the 7.5kDa is not a significant apoptosis inducer in UT7/Epo-S1 cells.
Comparison of apoptosis induced by transfection of 3 B19V nonstructural proteins and by B19V infection. (A-C) Comparison of apoptosis induced by 7.5kDa, 11kDa, and NS1 in UT7/Epo-S1 cells. UT7/Epo-S1cells were transfected with pGFP control, pGFP-7.5kDa, pGFP-11kDa, and pGFP-NS1. Cells were analyzed at the 3 time points after transfection as indicated. (A) The absolute percentages of annexin V+ populations of GFP+ cells were subtracted from those of GFP− cells and are plotted to the time points after transfection as shown. (B) UT7/Epo-S1 cells were transfected with plasmids expressing GFP or GFP-fused proteins as indicated. The mean fluorescence intensity (MFI) of GFP or GFP-fused proteins was detected by flow cytometer and plotted at 3 time points after transfection. (C) The absolute values shown in panel A were normalized by the MFI of GFP shown in panel B that serves as a marker of protein expression level. The normalized data were plotted as relative values to GFP-11kDa, arbitrarily set as 100%. (D-F) Comparison of apoptosis induced by 7.5kDa, 11kDa, and NS1 in CD36+ EPCs. The same plasmids, as indicated, were transfected to CD36+ EPCs. (D) The absolute percentages of annexin V+ populations of GFP+ cells were subtracted from those of GFP− cells and are plotted to the time points after transfection as shown. (E) CD36+ EPCs were transfected with plasmids expressing GFP or GFP-fused proteins as indicated. The MFI of GFP or GFP-fused proteins was detected by flow cytometer and plotted at 24 hours after transfection. (F) Results shown in panel D were normalized by following the same method used in panel C. (G) Apoptosis induced during B19V infection of CD36+ EPCs. The extent of apoptosis induced by mock/B19V infection of CD36+ EPCs was detected by TUNEL assay. Cells were also immunostained at the time points as indicated with an anti-B19V capsid antibody (clone 521-5D; Millipore) at 1:100 dilution followed by a fluorescein isothiocyanate–conjugated secondary antibody with the TUNEL assay simultaneously. Stained cells were analyzed by flow cytometer, and both capsid+ and capsid− cell populations of B19V-infected cells were gated for TUNEL+ population. TX indicates transfection.
Comparison of apoptosis induced by transfection of 3 B19V nonstructural proteins and by B19V infection. (A-C) Comparison of apoptosis induced by 7.5kDa, 11kDa, and NS1 in UT7/Epo-S1 cells. UT7/Epo-S1cells were transfected with pGFP control, pGFP-7.5kDa, pGFP-11kDa, and pGFP-NS1. Cells were analyzed at the 3 time points after transfection as indicated. (A) The absolute percentages of annexin V+ populations of GFP+ cells were subtracted from those of GFP− cells and are plotted to the time points after transfection as shown. (B) UT7/Epo-S1 cells were transfected with plasmids expressing GFP or GFP-fused proteins as indicated. The mean fluorescence intensity (MFI) of GFP or GFP-fused proteins was detected by flow cytometer and plotted at 3 time points after transfection. (C) The absolute values shown in panel A were normalized by the MFI of GFP shown in panel B that serves as a marker of protein expression level. The normalized data were plotted as relative values to GFP-11kDa, arbitrarily set as 100%. (D-F) Comparison of apoptosis induced by 7.5kDa, 11kDa, and NS1 in CD36+ EPCs. The same plasmids, as indicated, were transfected to CD36+ EPCs. (D) The absolute percentages of annexin V+ populations of GFP+ cells were subtracted from those of GFP− cells and are plotted to the time points after transfection as shown. (E) CD36+ EPCs were transfected with plasmids expressing GFP or GFP-fused proteins as indicated. The MFI of GFP or GFP-fused proteins was detected by flow cytometer and plotted at 24 hours after transfection. (F) Results shown in panel D were normalized by following the same method used in panel C. (G) Apoptosis induced during B19V infection of CD36+ EPCs. The extent of apoptosis induced by mock/B19V infection of CD36+ EPCs was detected by TUNEL assay. Cells were also immunostained at the time points as indicated with an anti-B19V capsid antibody (clone 521-5D; Millipore) at 1:100 dilution followed by a fluorescein isothiocyanate–conjugated secondary antibody with the TUNEL assay simultaneously. Stained cells were analyzed by flow cytometer, and both capsid+ and capsid− cell populations of B19V-infected cells were gated for TUNEL+ population. TX indicates transfection.
Similar results were obtained by transfecting CD36+ EPCs (Figure 2D). At 24 hours after transfection, whereas pGFP control transfection induced approximately 10% annexin V+ cells over the background, transfection of pGFP-7.5kDa, pGFP-NS1, and pGFP-11kDa induced a significantly higher level of the annexin V+ population, approximately 22%, 36%, and 42%, respectively (Figure 2D). After normalization of the GFP expression level (Figure 2E), the GFP-11kDa induced approximately 1.5 times more annexin V+ cells than did the GFP-NS1 (Figure 2F), results similar to those obtained with UT7/Epo-S1 cells (Figure 2C). Again, the difference between the GFP-7.5kDa and GFP alone did not continue to be statistically significant after normalization (Figure 2F). Given the unique nature of ex vivo culture of CD36+ EPCs (even the GFP control induced approximately 10% annexin V+ cells over the background), we determined that the GFP-7.5kDa was not a significant inducer of apoptosis, and thus focused our study on the NS1 and the 11kDa thereafter.
For comparison, we also determined the apoptosis level represented by TUNEL-positive (TUNEL+) population during B19V infection of CD36+ EPCs. B19V-infected positive (capsid+) population was specifically selected to assess the extent of nicked DNA–containing cells, compared with those of the capsid-negative (capsid−) population. As shown in Figure 2G, at 24, 48, and 72 hours after infection, approximately 20%, 50%, and 64% TUNEL+ populations were detected, respectively, in the capsid+ population. Interestingly, we also found a time-dependent increase of TUNEL+ population in the B19V uninfected (capsid−) cell population, from 2% at 24 hours after infection to 19% at 48 hours after infection, which rose to more than 25% at 72 hours after infection. The TUNEL+ populations in capsid− cells is likely due to the sensitivity of the capsid-recognizing antibody, but not to the release of apoptosis-inducing molecules from infected cells (supplemental Figure 4, available on the Blood website; see the Supplemental Materials link at the top of the online article). However, a significant difference was consistently found between the capsid+ and capsid− cell populations. Similar results were obtained when the NS1-expressed cell population was selected for TUNEL assay using the anti-NS1 sera (data not shown). Thus, our results confirmed the apoptotic nature of CD36+ EPCs during B19V infection.
11kDa localizes dominantly in cytoplasm and is expressed at least 100 times more than NS1 during B19V infection of CD36+ EPCs
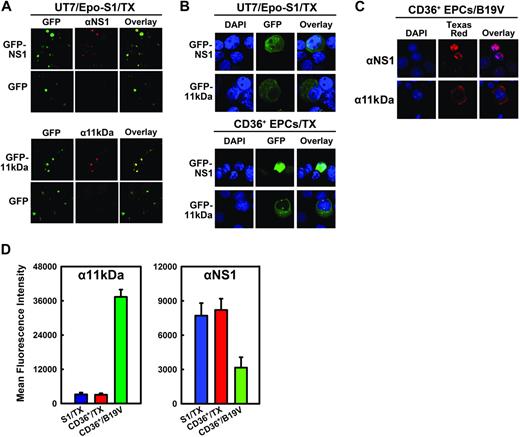
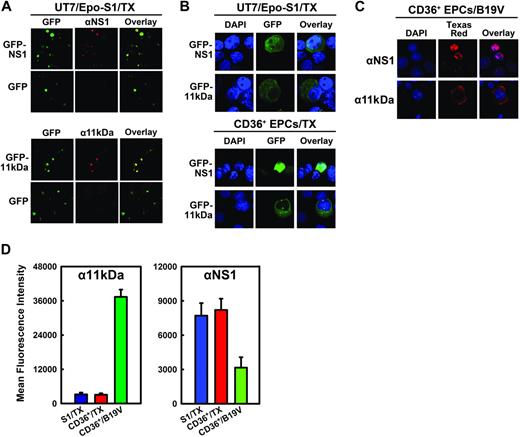
Induction of apoptosis is often caused by accumulation of the apoptotic inducer in the cytoplasm, and nuclear translocation is often a means to inactivate the apoptotic inducer.33,34 Using anti-NS1 (αNS1)– and anti-11kDa (α11kDa)–specific sera (Figure 3A), GFP-11kDa and GFP-NS1 in transfected UT7/Epo-S1 cells and CD36+ EPCs showed similar cellular localization as the 11kDa and the NS1 expressed in B19V-infected CD36+ EPCs (Figure 3B-C). The blue nuclear DAPI (4,6 diamidino-2-phenylindole) staining did not overlap with either the green GFP-11kDa (Figure 3B) or the 11kDa stained with α11kDa (red; Figure 3C), indicating that the GFP-11kDa and the 11kDa localize predominantly in cytoplasm. Conversely, nuclear DAPI staining overlapped exactly with NS1 stained with αNS1 (red) in B19V-infected CD36+ EPCs (Figure 3C), confirming that NS1 is expressed exclusively in nucleus in B19V-infected cells as previously reported.9,35 In pGFP-NS1–transfected UT7/Epo-S1 cells and CD36+ EPCs, the GFP signal diffused to cytoplasm to some extent, however, the GFP-NS1 localized mainly in the nucleus.
Cellular localization and expression of 11kDa and NS1 in transfection. (A) Specificity of αNS1 and α11kDa polyclonal antibodies. UT7/Epo-S1 cells transfected with pGFP-NS1 or pGFP-11kDa were stained with respective antisera followed by a Texas red–conjugated secondary antibody. Images were taken from an Eclipse SE TE2000-S UV microscope (Nikon) at 20× magnification. (B) Cellular localization of GFP-NS1 and GFP-11kDa in transfected UT7/Epo-S1 cells and CD36+ EPCs. UT7/Epo-S1 cells and CD36+ EPCs were transfected with pGFP-NS1 or pGFP-11kDa and stained with DAPI at 48 hours after transfection. DAPI was used to stain the nuclei. The confocal images in panels B and C were taken at 60× (objective lens) magnification with an Eclipse C1 Plus confocal microscope (Nikon). (C) Cellular localization of 11kDa and NS1 in B19V-infected CD36+ EPCs. Infected CD36+ EPCs (at 48 hours after infection) were stained with α11kDa and αNS1 antisera followed by a Texas red–conjugated secondary antibody, respectively. DAPI was used to stain the nuclei. (D) The protein levels of GFP-NS1 and GFP-11kDa in transfected UT7/Epo-S1 cells and CD36+ EPCs versus the NS1 and the 11kDa expressed in B19V-infected CD36+ EPCs, respectively. UT7/Epo-S1 cells and CD36+ EPCs were transfected with either pGFP-11kDa or pGFP-NS1 and stained at 48 hours after transfection. CD36+ EPCs were infected with B19V and stained at 48 hours after infection. Cells were fixed with 1% paraformaldehyde and permeabilized in 0.2% Tween-20. Either α11kDa or αNS1 antiserum at a dilution of 1:100 was used to immunostain cells, followed by a Cy5-conjugated secondary antibody. Stained cells were analyzed by flow cytometer. The protein level, represented by the mean fluorescence intensity, was compared between transfected and infected cells. S1 indicates UT7/Epo-S1; CD36+, CD36+ EPCs; and TX, transfection.
Cellular localization and expression of 11kDa and NS1 in transfection. (A) Specificity of αNS1 and α11kDa polyclonal antibodies. UT7/Epo-S1 cells transfected with pGFP-NS1 or pGFP-11kDa were stained with respective antisera followed by a Texas red–conjugated secondary antibody. Images were taken from an Eclipse SE TE2000-S UV microscope (Nikon) at 20× magnification. (B) Cellular localization of GFP-NS1 and GFP-11kDa in transfected UT7/Epo-S1 cells and CD36+ EPCs. UT7/Epo-S1 cells and CD36+ EPCs were transfected with pGFP-NS1 or pGFP-11kDa and stained with DAPI at 48 hours after transfection. DAPI was used to stain the nuclei. The confocal images in panels B and C were taken at 60× (objective lens) magnification with an Eclipse C1 Plus confocal microscope (Nikon). (C) Cellular localization of 11kDa and NS1 in B19V-infected CD36+ EPCs. Infected CD36+ EPCs (at 48 hours after infection) were stained with α11kDa and αNS1 antisera followed by a Texas red–conjugated secondary antibody, respectively. DAPI was used to stain the nuclei. (D) The protein levels of GFP-NS1 and GFP-11kDa in transfected UT7/Epo-S1 cells and CD36+ EPCs versus the NS1 and the 11kDa expressed in B19V-infected CD36+ EPCs, respectively. UT7/Epo-S1 cells and CD36+ EPCs were transfected with either pGFP-11kDa or pGFP-NS1 and stained at 48 hours after transfection. CD36+ EPCs were infected with B19V and stained at 48 hours after infection. Cells were fixed with 1% paraformaldehyde and permeabilized in 0.2% Tween-20. Either α11kDa or αNS1 antiserum at a dilution of 1:100 was used to immunostain cells, followed by a Cy5-conjugated secondary antibody. Stained cells were analyzed by flow cytometer. The protein level, represented by the mean fluorescence intensity, was compared between transfected and infected cells. S1 indicates UT7/Epo-S1; CD36+, CD36+ EPCs; and TX, transfection.
We next compared the expression level of GFP-11kDa and GFP-NS1 with that of 11kDa and NS1, respectively, during B19V infection. The level of the GFP-11kDa in transfected UT7/Epo-S1 cells and CD36+ EPCs at 48 hours after transfection, as quantified by flow cytometry analysis using α11kDa antiserum, was approximately 12 times lower than that of the 11kDa expressed in B19V-infected CD36+ EPCs at 48 hours after infection (Figure 3D, α11kDa), implying that a stronger proapoptotic effect is induced by 11kDa in B19V-infected CD36+ EPCs than that induced by the GFP-11kDa in transfected cells. In contrast, nearly twice as much GFP-NS1 was expressed in both transfected UT7/Epo-S1 cells and CD36+ EPCs cells at 48 hours after transfection than the NS1 expressed in B19V-infected CD36+ EPCs at 48 hours after infection (Figure 3D, αNS1), indicating that the GFP-NS1 in transfected cells likely mimics the function of the NS1 during B19V infection.
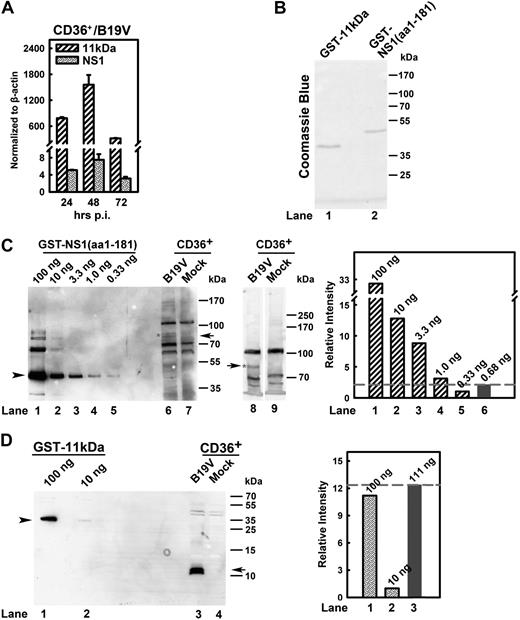
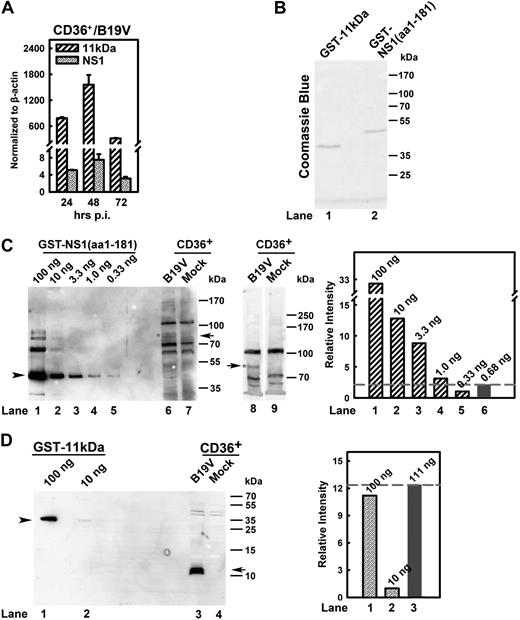
To determine the relative expression level of 11kDa and NS1 during B19V infection of the native targets, erythroid progenitor cells, we quantified the mRNA levels of the 2 nonstructural proteins using RT real-time PCR. By normalizing to copy numbers of β-actin mRNA (relative copies per β-actin mRNA), the 11kDa-encoding mRNA remained at a consistent level that was approximately 100 to 200 times higher than that of the NS1-encoding mRNA during the course of B19V infection (Figure 4A).
Quantification of 11kDa and NS1 expression during B19V infection of CD36+ EPCs. (A) Quantification of B19V 11kDa- and NS1-encoding mRNAs. CD36+ EPCs were infected with B19V. At 24, 48, and 72 hours after infection, total RNA was isolated, treated with DNase, reverse-transcribed, and quantified for absolute copies of mRNA by multiplex real-time PCR for NS1-mRNA/β-actin-mRNA and 11kDa-mRNA/β-actin-mRNA as described in “RT real-time PCR.” The copy numbers of the 11kDa- and NS1-encoding mRNAs were normalized by copy numbers of β-actin mRNA in the same reaction and presented as numbers per copy of β-actin mRNA. (B) Purity of purified fusion proteins GST-NS1(aa1-181) and GST-11kDa. Purified GST-NS1(aa1-181) and GST-11kDa proteins were resolved in SDS-PAGE 10% gel and stained with Coomassie blue as shown. (C-D) Quantification of the steady-state protein level of 11kDa versus NS1 during B19V infection. GST-NS1(aa1-181) (100 ng) and GST-11kDa (100 ng) as seen in panel B and a serial dilution of them as shown were loaded in SDS-PAGE 8% and SDS-PAGE 15% for Western blot (C lanes 1-7 and D, respectively). At 48 hours after infection, 1.5 × 10⁵ of CD36+ EPCs with or without (mock) B19V infection were harvested, directly dissolved in SDS lysis buffer, and loaded in lanes 6-7 (SDS-PAGE 8%), lanes 8-9 (SDS-PAGE 6%) (C), and lanes 3-4 (SDS-PAGE 15%) (D). Results from lanes as indicated were also quantified with Quantity One software (GE Healthcare) and plotted to the right in panels C-D. Arrow and arrowhead in panel C show NS1-specific band and GST-NS1(aa1-181), respectively; and arrow and arrowhead in panel D show 11kDa-specific band and GST-11kDa, respectively. CD36+ indicates CD36+ EPCs.
Quantification of 11kDa and NS1 expression during B19V infection of CD36+ EPCs. (A) Quantification of B19V 11kDa- and NS1-encoding mRNAs. CD36+ EPCs were infected with B19V. At 24, 48, and 72 hours after infection, total RNA was isolated, treated with DNase, reverse-transcribed, and quantified for absolute copies of mRNA by multiplex real-time PCR for NS1-mRNA/β-actin-mRNA and 11kDa-mRNA/β-actin-mRNA as described in “RT real-time PCR.” The copy numbers of the 11kDa- and NS1-encoding mRNAs were normalized by copy numbers of β-actin mRNA in the same reaction and presented as numbers per copy of β-actin mRNA. (B) Purity of purified fusion proteins GST-NS1(aa1-181) and GST-11kDa. Purified GST-NS1(aa1-181) and GST-11kDa proteins were resolved in SDS-PAGE 10% gel and stained with Coomassie blue as shown. (C-D) Quantification of the steady-state protein level of 11kDa versus NS1 during B19V infection. GST-NS1(aa1-181) (100 ng) and GST-11kDa (100 ng) as seen in panel B and a serial dilution of them as shown were loaded in SDS-PAGE 8% and SDS-PAGE 15% for Western blot (C lanes 1-7 and D, respectively). At 48 hours after infection, 1.5 × 10⁵ of CD36+ EPCs with or without (mock) B19V infection were harvested, directly dissolved in SDS lysis buffer, and loaded in lanes 6-7 (SDS-PAGE 8%), lanes 8-9 (SDS-PAGE 6%) (C), and lanes 3-4 (SDS-PAGE 15%) (D). Results from lanes as indicated were also quantified with Quantity One software (GE Healthcare) and plotted to the right in panels C-D. Arrow and arrowhead in panel C show NS1-specific band and GST-NS1(aa1-181), respectively; and arrow and arrowhead in panel D show 11kDa-specific band and GST-11kDa, respectively. CD36+ indicates CD36+ EPCs.
Further, to ascertain the steady-state protein level of 11kDa and NS1 during B19V infection, we attempted to estimate the relative protein level of 11kDa versus NS1 during B19V infection. GST-NS1(aa1-181) and GST-11kDa were purified (Figure 4B). The purified protein standards (Figure 4C lanes 1-5 and Figure 4D lanes 1-2) and cell lysates from B19V-infected CD36+ EPCs (at 48 hours after infection) and mock cells were blotted with α11kDa and αNS1 antisera (Figure 4C-D). We observed significant nonspecific protein bands by the αNS1 antiserum; however, the blots clearly showed the specific NS1 band with both 8% and 6% PAGE gels (Figure 4C, compare lane 6 with 7 and lane 8 with 9, respectively). The intensity of this specific NS1 band from B19V-infected CD36+ EPCs (Figure 4C lane 6) fell between 1.0 ng and 0.33 ng of the GST-NS1(aa1-181) standards (Figure 4C lanes 4-5). In contrast, the signal of the 11kDa from B19V-infected CD36+ EPCs was stronger than that from 100 ng of the GST-11kDa (Figure 4D, compare lane 3 with 1). This result suggests that during B19V infection of CD36+ EPCs at 48 hours after infection, at a steady-state protein level, 11kDa expresses at least 100 times more than NS1 (Figure 4C-D), which presented during the course of B19V infection of CD36+ EPCs (supplemental Figure 2).
Both high expression and cytoplasmic localization of 11kDa and the low expression and nuclear localization of NS1 during B19V infection of CD36+ EPCs suggest the important role of the 11kDa in apoptosis of B19V-infected erythroid progenitors.
Inhibition of 11kDa expression by 11kDa-specific Morpholinos reduces apoptosis significantly during B19V infection of CD36+ EPCs
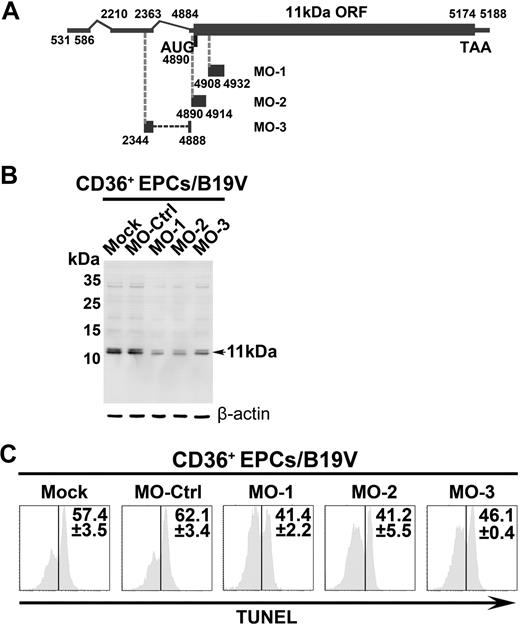
To confirm a key role of 11kDa in inducing apoptosis during B19V infection, we next applied specific Morpholino antisense oligos to knock down 11kDa expression through inhibition of translation initiation.36,37 CD36+ EPCs were pretreated with Morpholino oligos 24 hours before infection. The expression of 11kDa was reduced by approximately 60% in B19V-infected CD36+ EPCs treated with MO-1, MO-2, and MO-3 at 48 hours after infection, as indicated by Western blot (Figure 5B). Consequently, as a result, the level of apoptosis, indicated by TUNEL+ population, was reduced by approximately 20%, in comparison with the cells treated with the control Morpholino (MO-Ctrl; Figure 5C). The expression levels of NS1 and capsid proteins VP1 and VP2 were not affected with treatment of Morpholinos as determined (data not shown), indicating MO-1, MO-2, and MO-3 target specifically to the 11kDa-encoding mRNAs. Thus, we have demonstrated that inhibition of 11kDa expression reduces apoptosis during B19V infection of CD36+ EPCs, supporting a key role of the 11kDa in inducing apoptosis during B19V infection.
The inhibitory effects of 11kDa-specific Morpholinos on B19V infection–induced apoptosis. CD36+ EPCs were pretreated with a control Morpholino (MO-Ctrl) or 11kDa-specific Morpholinos, MO-1, MO-2, and MO-3, as indicated, at a final concentration of 6μM, 24 hours before B19V infection. (A) A schematic diagram of the 11kDa-encdoing mRNA and targets for specific Morpholino is shown. Regions in the 11kDa-encoding mRNA that Morpholinos target are shown with their respective nucleotide numbers. (B) Detection of B19V 11kDa protein. The same samples used for TUNEL assay were used for Western blot using anti-11kDa antiserum. Detection of β-actin using a polyclonal antibody (ab1801; Abcam) served as a loading control. (C) TUNEL assay was performed with costaining of B19V capsid using an anti-B19V capsid antibody (clone 521-5D; Millipore) for selection of infected cells at 48 hours after infection by flow cytometer. The TUNEL+ population is shown as a percentage in capsid-positive cells.
The inhibitory effects of 11kDa-specific Morpholinos on B19V infection–induced apoptosis. CD36+ EPCs were pretreated with a control Morpholino (MO-Ctrl) or 11kDa-specific Morpholinos, MO-1, MO-2, and MO-3, as indicated, at a final concentration of 6μM, 24 hours before B19V infection. (A) A schematic diagram of the 11kDa-encdoing mRNA and targets for specific Morpholino is shown. Regions in the 11kDa-encoding mRNA that Morpholinos target are shown with their respective nucleotide numbers. (B) Detection of B19V 11kDa protein. The same samples used for TUNEL assay were used for Western blot using anti-11kDa antiserum. Detection of β-actin using a polyclonal antibody (ab1801; Abcam) served as a loading control. (C) TUNEL assay was performed with costaining of B19V capsid using an anti-B19V capsid antibody (clone 521-5D; Millipore) for selection of infected cells at 48 hours after infection by flow cytometer. The TUNEL+ population is shown as a percentage in capsid-positive cells.
Caspase-10 inhibitor is as effective as pan-caspase inhibitors in reducing B19V- induced apoptosis
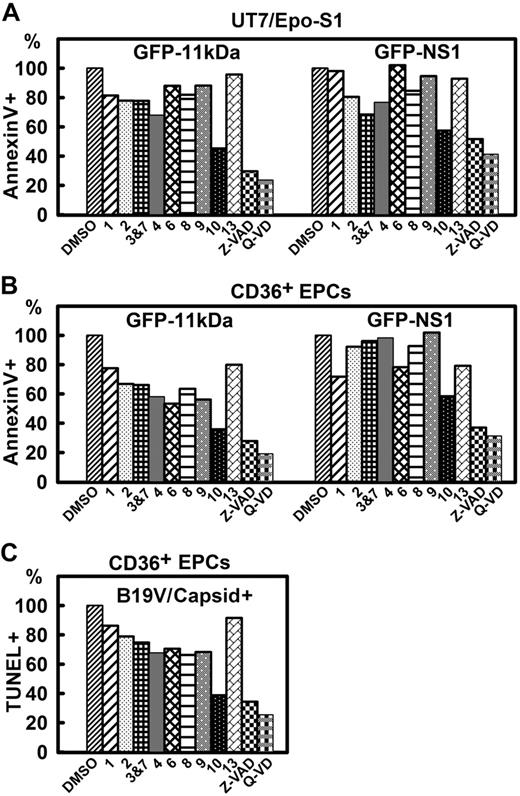
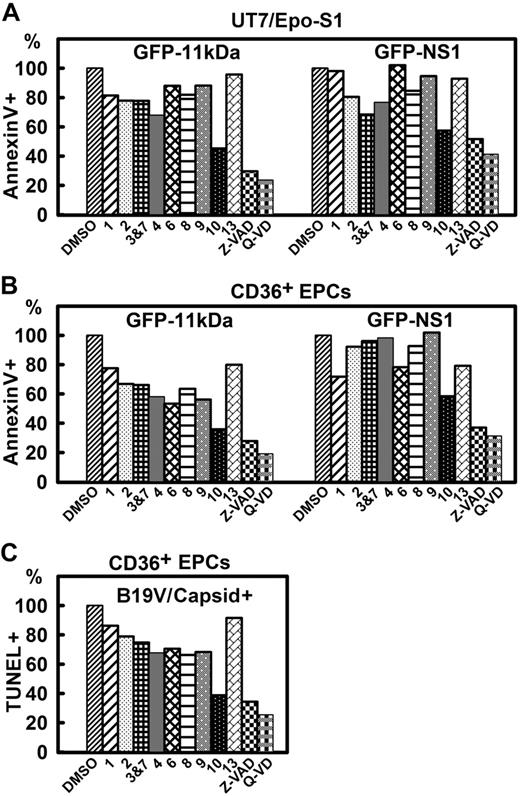
Transfecting UT7/Epo-S1 cells with GFP-11kDa, we observed an 80% inhibition of annexin V+ population at 48 hours after transfection when Q-VD, a newly developed pan-caspase inhibitor without cross-inhibition of cathepsin,38 was used at 10μM (Figure 6A). Among individual caspase inhibitors (caspase-1, -2, -3&7, -4, -6, -8, -9, -10, and -13 inhibitors), the caspase-10 inhibitor was particularly effective; treatment with caspase-10 inhibitor at 20μM reduced the percentage of the annexin V+ population by 55%. However, treatments with caspase-1, -2, -3&7, -4, -6, and -8 inhibitors at 20μM reduced the annexin V+ population by only approximately 20%. The inhibition of the GFP-NS1–induced annexin V+ population in UT7/Epo-S1 cells generally shared the same profile but had less sensitivity compared with the population induced by 11kDa. At 48 hours after transfection, less inhibition was observed in pGFP-NS1–transfected cells with the treatment of the same dose of inhibitors; treatments with Q-VD, Z-VAD, and caspase-10 inhibitor reduced the annexin V+ population by 55%, 45%, and 40%, respectively (Figure 6A). Notably, after transfecting both UT7/Epo-S1 cells and CD36+ EPCs, the percentage of the GFP+ population (of the total) in pGFP-NS1–transfected cells was approximately 1.6 times more than that of pGFP-11kDa–transfected cells as determined by flow cytometer (data no shown). This can perhaps partially explain why pGFP-NS1–transfected cells were less sensitive to these caspase inhibitors. Nevertheless, caspase-10 inhibitor clearly was the most effective in inhibiting both GFP-11kDa– and GFP-NS1–induced apoptosis in transfected UT7/Epo-S1 cells.
The inhibitory effects of caspase inhibitors on 11kDa/NS1 transfection– and B19V infection–induced apoptosis. (A-B) Inhibitory effects of caspase inhibitors on apoptosis induced by 11kDa and NS1 transfection. (A) UT7/Epo-S1 cells were transfected with pGFP-11kDa or pGFP-NS1. (B) CD36+EPCs were transfected with pGFP-11kDa and pGFP-NS1, respectively, as shown. Individual caspase inhibitors (at 20μM), caspase-1, -2, -3&7, -4, -6, -8, -9, -10, and -13 inhibitors, as indicated by 1, 2, 3&7, 4, 6, 8, 9, 10, and 13, respectively, and pan-caspase inhibitors, Z-VAD (20μM) and Q-VD (10μM), were applied at the time of transfection. Dimethyl sulfoxide (DMSO) served as a control at 0.5% vol/vol. Apoptosis was measured by annexin V/PI staining at different times after transfection as indicated. The annexin V+/PI+ population is shown as a relative percentage (%) to the DMSO control that is arbitrarily set as 100%. (C) Inhibitory effects of caspase inhibitors on apoptosis induced by B19V infection. CD36+ EPCs were infected with B19V. Caspase inhibitors were applied upon infection at the concentrations described in panel B. TUNEL assay was used to measure apoptosis induced in capsid+ cell population at 48 hours after infection by flow cytometer. The TUNEL+ population is shown as a relative percentage to the DMSO control, arbitrarily set as 100%. All the numbers shown as percentage (%) are averages from at least 2 individual experiments.
The inhibitory effects of caspase inhibitors on 11kDa/NS1 transfection– and B19V infection–induced apoptosis. (A-B) Inhibitory effects of caspase inhibitors on apoptosis induced by 11kDa and NS1 transfection. (A) UT7/Epo-S1 cells were transfected with pGFP-11kDa or pGFP-NS1. (B) CD36+EPCs were transfected with pGFP-11kDa and pGFP-NS1, respectively, as shown. Individual caspase inhibitors (at 20μM), caspase-1, -2, -3&7, -4, -6, -8, -9, -10, and -13 inhibitors, as indicated by 1, 2, 3&7, 4, 6, 8, 9, 10, and 13, respectively, and pan-caspase inhibitors, Z-VAD (20μM) and Q-VD (10μM), were applied at the time of transfection. Dimethyl sulfoxide (DMSO) served as a control at 0.5% vol/vol. Apoptosis was measured by annexin V/PI staining at different times after transfection as indicated. The annexin V+/PI+ population is shown as a relative percentage (%) to the DMSO control that is arbitrarily set as 100%. (C) Inhibitory effects of caspase inhibitors on apoptosis induced by B19V infection. CD36+ EPCs were infected with B19V. Caspase inhibitors were applied upon infection at the concentrations described in panel B. TUNEL assay was used to measure apoptosis induced in capsid+ cell population at 48 hours after infection by flow cytometer. The TUNEL+ population is shown as a relative percentage to the DMSO control, arbitrarily set as 100%. All the numbers shown as percentage (%) are averages from at least 2 individual experiments.
As expected, a similar inhibitory effect of all the caspase inhibitors was observed after transfecting GFP-11kDa and GFP-NS1 in CD36+ EPCs (Figure 6B). Q-VD treatment showed the strongest inhibition in both the GFP-11kDa– and the GFP-NS1–induced annexin V+ cells, followed by Z-VAD and caspase-10 inhibitor. Similar to UT7/Epo-S1 cells, the GFP-NS1–induced annexin V+ cells were less sensitive to inhibition caused by caspase inhibitors. For example, caspase-10 inhibitor reduced the GFP-11kDa–induced annexin V+ population by 62%; however, the NS1-induced annexin V+ population was inhibited by only 45%.
In B19V infection of CD36+ EPCs, Q-VD was also the most effective inhibitor in decreasing the TUNEL+ population (Figure 6C). Treatment with Q-VD at 10μM inhibited B19V infection–induced TUNEL+ population with an efficiency of 70%. Similar to what was observed in the transfection experiments, treatment with caspase-10 inhibitor showed a particularly high potency in inhibiting TUNEL+ population induced by B19V infection compared with treatments with other individual caspase inhibitors. At 20μM, both caspase-10 inhibitor and Z-VAD treatments inhibited B19V infection–induced TUNEL+ population by more than 60%.
Collectively, our results show that caspase-10 inhibitor is the most effective inhibitor besides the 2 pan-caspase inhibitors in GFP-11kDa and GFP-NS1 transfection–induced apoptosis as well as in B19V infection–induced apoptosis.
Caspase-10 is the most active caspase in 11kDa/NS1 transfection– and B19V infection–induced apoptosis
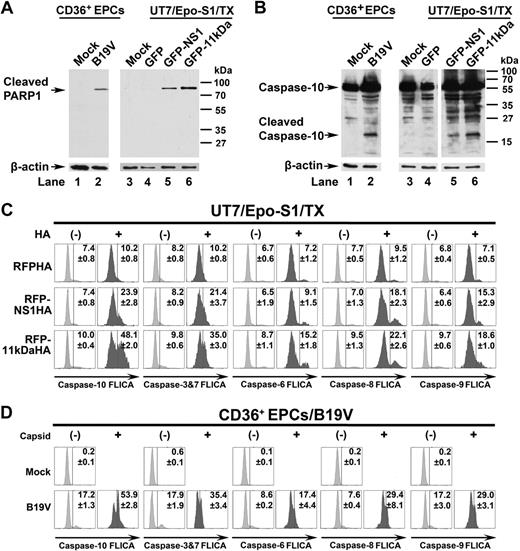
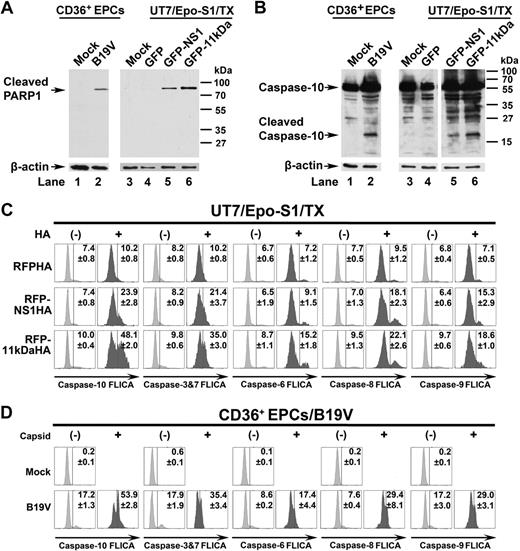
The proteolytic cleavage of poly(adenosine diphosphate–ribose) polymerase-1 (PARP1) is one of the hallmarks of apoptosis.39,40 The cleaved PARP1 band at a size of approximately 85 kDa was specifically detected in pGFP-NS1– and pGFP-11kDa–transfected UT7/Epo-S1 cells (Figure 7A lanes 5-6) as well as in B19V-infected CD36+ EPCs (Figure 7A lane 2), but not in GFP-only–transfected cells and mock cells (Figure 4A lanes 1, 3-4), supporting the apoptotic nature of cell death induced by transfection of the GFP-11kDa and the GFP-NS1 and by B19V infection.
PARP1 is cleaved and caspase-10 is the most active caspase in 11kDa/NS1 transfection– and B19V infection–induced apoptosis. (A-B) Detection of cleaved PARP1 and cleaved caspase-10. CD36+ EPCs were infected with B19V, and capsid+ cells were sorted at 48 hours after infection by flow cytometer. UT7/Epo-S1 cells were transfected with pGFP control, pGFP-11kDa, and pGFP-NS1. At 48 hours after transfection, the GFP+ populations of transfected cells were sorted by flow cytometer. (A) Sorted cells were used for detecting the cleaved PARP1 by Western blot using anti–cleaved PARP1 at a dilution of 1:1000 (Cell Signaling). The blots were reprobed with anti–β-actin. (B) Sorted cells were used for detecting of active caspase-10 by Western blot using anti–caspase-10 at a dilution of 1:1000 (Sigma-Aldrich). Uninfected or pGFP-transfected cells served as mock as shown. The blots were reprobed with anti–β-actin. (C) Detection of activated caspase-3&7, -6, -8, -9, and -10 in 11kDa- and NS1-transfected cells. UT7/Epo-S1 cells were transfected with pRFPHA control, pRFP-11kDaHA, and pRFP-NS1HA. FAM-labeled FLICA peptides, FAM-DEVD-FMK, FAM-VEID-FMK, FAM-LETD-FMK, FAM-LEHD-FMK, and FAM-AEVD-FMK were used to detect active caspase-3/7, caspase-6, caspase-8, caspase-9, and caspase-10, respectively. Individual FLICA staining was performed to determine active caspases at 48 hours after transfection. Transfected cells were selected by intracellular staining of anti-HA tag at 1:100 dilution (clone HA-7; Sigma-Aldrich), shown as HA+ and HA−, and were plotted to FLICA signal detected by flow cytometer. (D) Detection of activated caspase-3&7, -6, -8, -9, and -10 in B19V-infected CD36+ EPCs. CD36+ EPCs were infected with B19V. At 48 hours after infection, cells were used for individual FLICA staining followed by intracellular staining with the antibody against B19V capsid. Both capsid-positive and -negative cells were plotted to FLICA signal detected by flow cytometer. TX indicates transfection.
PARP1 is cleaved and caspase-10 is the most active caspase in 11kDa/NS1 transfection– and B19V infection–induced apoptosis. (A-B) Detection of cleaved PARP1 and cleaved caspase-10. CD36+ EPCs were infected with B19V, and capsid+ cells were sorted at 48 hours after infection by flow cytometer. UT7/Epo-S1 cells were transfected with pGFP control, pGFP-11kDa, and pGFP-NS1. At 48 hours after transfection, the GFP+ populations of transfected cells were sorted by flow cytometer. (A) Sorted cells were used for detecting the cleaved PARP1 by Western blot using anti–cleaved PARP1 at a dilution of 1:1000 (Cell Signaling). The blots were reprobed with anti–β-actin. (B) Sorted cells were used for detecting of active caspase-10 by Western blot using anti–caspase-10 at a dilution of 1:1000 (Sigma-Aldrich). Uninfected or pGFP-transfected cells served as mock as shown. The blots were reprobed with anti–β-actin. (C) Detection of activated caspase-3&7, -6, -8, -9, and -10 in 11kDa- and NS1-transfected cells. UT7/Epo-S1 cells were transfected with pRFPHA control, pRFP-11kDaHA, and pRFP-NS1HA. FAM-labeled FLICA peptides, FAM-DEVD-FMK, FAM-VEID-FMK, FAM-LETD-FMK, FAM-LEHD-FMK, and FAM-AEVD-FMK were used to detect active caspase-3/7, caspase-6, caspase-8, caspase-9, and caspase-10, respectively. Individual FLICA staining was performed to determine active caspases at 48 hours after transfection. Transfected cells were selected by intracellular staining of anti-HA tag at 1:100 dilution (clone HA-7; Sigma-Aldrich), shown as HA+ and HA−, and were plotted to FLICA signal detected by flow cytometer. (D) Detection of activated caspase-3&7, -6, -8, -9, and -10 in B19V-infected CD36+ EPCs. CD36+ EPCs were infected with B19V. At 48 hours after infection, cells were used for individual FLICA staining followed by intracellular staining with the antibody against B19V capsid. Both capsid-positive and -negative cells were plotted to FLICA signal detected by flow cytometer. TX indicates transfection.
Moreover, the cleaved band of caspase-10 was specifically detected in the pGFP-NS1– and the pGFP-11kDa–transfected UT7/Epo-S1 cells (Figure 7B lanes 5 and 6, respectively), as well as in B19V-infected CD36+ EPCs (Figure 7B lane 2), but not in pGFP-transfected control cells (Figure 7B lane 4) and mock cells (Figure 7B lanes 1 and 3), suggesting that caspase-10 is activated in 11kDa/NS1 transfection– and B19V infection–induced apoptosis.
Because caspase-3&7, -6, and -8 were reported active in NS1-expressing cell lines and B19V-infected erythroid progenitor cells,5,14 FLICA was used to further evaluate the importance of the active caspase-10. As GFP and FAM share similar excitation and emission wavelength, we decided to transfect cells with RFP-11kDaHA, RFP-NS1HA, and RFPHA (as a control). Cellular localization and expression level of these RFP fusion proteins were observed to be similar to that of GFP fusion proteins (data not shown). At 48 hours after transfection, RFP-NS1HA and RFP-11kDaHA activated caspase-10 in 24% and 48% of the transfected cells (αHA positive, HA+), respectively; in contrast, only 10% of RFPHA-expressing cells contained active caspase-10 (Figure 7C). Similarly, activation of caspase-10 was detected in more than 53% of B19V-infected CD36+ EPCs (capsid+) at 48 hours after infection (Figure 7D). Not surprisingly, all other analyzed caspases (caspase-3&7, -6, -8, and -9) were also activated, however, at a much lower level, compared with capspase-10 in the RFP-NS1HA– and the RFP-11kDaHA–expressing cells (Figure 7C) and in CD36+ EPCs infected with B19V (Figure 7D). Our results show that caspase-10 is the most active caspase in both 11kDa- and NS1-expressing UT7/Epo-S1 cells and in B19V-infected CD36+ EPCs, and 11kDa is more efficient in activating caspase-10 than NS1.
Discussion
We report here for the first time that B19V 11kDa is a more significant inducer of apoptosis than NS1 during B19V infection of primary erythroid progenitor cells. B19V-11kDa–induced apoptosis is mediated by caspase-10 as an initiator. Strikingly, 11kDa expresses at least 100 times more than NS1 at the protein level during B19V infection of primary erythroid progenitor cells. In contrast with NS1, which localizes exclusively in the nucleus, 11kDa localizes predominately in cytoplasm, where apoptotic inducers usually reside. Although we used GFP-fused 11kDa and NS1 to analyze apoptosis induced in transfected cells, localization of the fused proteins recapitulates their native cellular localization. Moreover, the protein level of 11kDa in transfected cells was approximately 12 times lower than that during B19V infection of erythroid progenitor cells, whereas the level of the NS1 was comparable between transfection and infection. Therefore, the 11kDa-induced apoptosis by transfection closely reproduces apoptosis induced during B19V infection of primary erythroid progenitor cells. In addition, our results have shown that inhibition of 11kDa expression reduces apoptosis during B19V infection of CD36+ EPCs, and thus we conclude that the B19V 11kDa is the major functional protein in destroying erythroid progenitors during B19V infection.
Apoptosis is defined mechanistically as regulated cell death involving the sequential activation of caspases. Activation of caspase-8, -9, and -10, which are believed to be the initiator caspases at the top of the caspase signaling cascade, leads to the activation of downstream caspases, including caspase-3, -6, and -7, which in turn induce apoptosis.41 As has been previously reported, caspase-3&7, -6, and -8 inhibitors can significantly reduce apoptosis induced by NS1 in established NS1-expressing cell lines5,14 as well as by B19V infection of erythroid progenitor cells,14 though at a high concentration of 200μM. At this high concentration, we did observe more than 90% inhibition of cell death in both the transfection and infection systems (data not shown). Instead of using such a “saturated” concentration, however, we applied the inhibitors at a low concentration (20μM) to probe precisely the potency of the individual caspase inhibitor. Using FLICA, we detected a significantly higher level of the active caspase-10 than caspase-3&7, -6, -8, and -9 in 11kDa/NS1 transfection– and B19V infection–induced apoptotic cells, strongly indicating that caspase-10 is the initiator caspase.
Caspase-10, previously considered as the ortholog of caspase-8,42 has been shown to be able to substitute for the function of caspase-8.43,44 However, we found caspase-8 could not be substituted for caspase-10 in our study, as caspase-8 inhibitor was not nearly as effective as caspase-10 inhibitor in counteracting apoptosis induced by 11kDa and NS1 transfection in UT7/Epo-S1 and primary erythroid progenitor cells or induced during B19V infection of primary erythroid progenitor cells. In addition, the activation of caspase-10 is significantly higher than caspase-8 in both 11kDa- and NS1-transfected UT7/Epo-S1 cells and B19V-infected primary erythroid progenitor cells. This finding suggests a potential role of caspase-10 in the proapoptotic pathway that is not directly regulated by caspase-8.
Notably, B19V permissive cells are erythroid or megakaryoblastoid cells that require erythropoietin (Epo) to sustain differentiation and proliferation. Epo positively regulates erythropoiesis by preventing apoptosis and stimulating differentiation and proliferation of erythroid progenitors and erythroblasts.45 We observed that the amount of Epo, ranging from 0.1 to 10 units/mL in B19V infection of erythroid progenitor cells, did not influence the degree of apoptosis significantly (supplemental Figure 1). On other hand, the Fas/Fas ligand pathway has been identified to have an apoptotic role in the regulation of erythropoiesis.46,47 Thus the balance between the apoptosis by the Fas/Fas ligand and the antiapoptotic role in the presence of Epo is important for the homeostasis of erythroid progenitors. Since Epo strongly presents an antiapoptotic stimulation, apoptosis induced during B19V infection may require a high level of a potent inducer that is the 11kDa. We hypothesize that the high level of the 11kDa expression during B19V infection disturbs the balance between the apoptosis by the Fas/Fas ligand and the antiapoptotic role by Epo and, furthermore, disturbs the homeostasis of erythroid progenitors. Thus, the B19V-11kDa–induced apoptosis provides us with a unique model to investigate further the mechanism underlying the caspase-10–dependent apoptosis, especially, in primary erythroid progenitor cells
Although an infectious clone of B19V was established, progeny virus produced from transfection of this clone is apparently limited, and transfection of an 11kDa knockout clone results in only a few assembled particles exclusively localized in the nucleus.9,48 Therefore, we are unable to produce 11kDa knockout virus to examine the role of the 11kDa in causing cell death of erythroid progenitors.
Direct cell death of infected erythroid progenitors results in the disease outcome of B19V infection.13 B19V must express abundant executors to erythroid progenitors during infection, among which the 11kDa is the most significant and abundant executor. Collectively, our data demonstrate that the B19V 11kDa protein is the major protein in executing erythroid progenitor cell death during B19V infection by inducing apoptotic cell death during B19V infection of erythroid progenitor cells that is mediated by activating caspase-10.
An Inside Blood analysis of this article appears at the front of this issue.
The online version of this article contains a data supplement.
The publication costs of this article were defrayed in part by page charge payment. Therefore, and solely to indicate this fact, this article is hereby marked “advertisement” in accordance with 18 USC section 1734.
Acknowledgments
We thank Dr Joyce G. Slusser at the Flow Cytometry Core for valuable discussion.
This work was supported by Public Health Service grant RO1 AI070723 from the National Institute of Allergy and Infectious Diseases and grant P20 RR016443 from the National Center for Research Resources Centers of Biomedical Research Excellence program.
National Institutes of Health
Authorship
Contribution: A.Y.C. designed and performed research and wrote the paper; E.Y.Z. designed and performed research; W.G. and F.C. performed research; S.K. and T.M.Y. designed research; and J.Q. designed research and wrote the paper.
Conflict-of-interest disclosure: The authors declare no competing financial interests.
Correspondence: Jianming Qiu, Department of Microbiology, Molecular Genetics and Immunology, The University of Kansas Medical Center, Mail Stop 3029, 3901 Rainbow Blvd, Kansas City, KS 66160; e-mail: jqiu@kumc.edu.

