Abstract
The function of the intracellular protein hematopoietic cell–specific Lyn substrate-1 (HS1) in B lymphocytes is poorly defined. To investigate its role in migration, trafficking, and homing of leukemic B lymphocytes we have used B cells from HS1−/− mice, the HS1-silenced human chronic lymphocytic leukemia (CLL) MEC1 cell line and primary leukemic B cells from patients with CLL. We have used both in vitro and in vivo models and found that the lack of expression of HS1 causes several important functional effects. In vitro, we observed an impaired cytoskeletal remodeling that resulted in diminished cell migration, abnormal cell adhesion, and increased homotypic aggregation. In vivo, immunodeficient Rag2−/−γc−/− mice injected with HS1-silenced CLL B cells showed a decreased organ infiltration with the notable exception of the bone marrow (BM). The leukemic-prone Eμ-TCL1 transgenic mice crossed with HS1-deficient mice were compared with Eμ-TCL1 mice and showed an earlier disease onset and a reduced survival. These findings show that HS1 is a central regulator of cytoskeleton remodeling that controls lymphocyte trafficking and homing and significantly influences the tissue invasion and infiltration in CLL.
Introduction
Hematopoietic cell–specific Lyn substrate-1 (HS1) is a 75-kDa intracellular protein that is expressed mainly in hematopoietic cells.1,2 On the basis of structural considerations, HS1 may bind actin through a region of 37 amino acid tandem repeats and a coil-coiled region; in addition, it contains an Arp2/3 complex binding domain3 and a proline-rich domain.4 HS1 has been shown to be an important actin regulator at the T-cell immunologic synapse5,6 and also to influence numerous functions of natural killer (NK) cells, including lysis of target cells, cell adhesion, chemotaxis, and actin assembly at the lytic synapse.7 HS1 Tyr phosphorylation has been shown to play a role also in human platelets where it leads to the membrane translocation of the protein and is involved in the cytoskeleton rearrangement triggered by thrombin.8
The function of HS1 in B lymphocytes is far less defined. HS1−/− mice9 showed a role for HS1 in B (as well as T) cell clonal expansion and deletion on antigen (Ag) receptor engagement. HS1 is tyrosine (Tyr) phosphorylated on surface immunoglobulin M cross-linking: the phosphorylation of Tyr378 and Tyr397 requires Syk10 and is a prerequisite for the signal transduction through Src family kinases. The Src family member Lyn binds constitutively and steadily to unphosphorylated HS1 through the interaction between Lyn Src homology domain 3 and HS1 proline-rich domain. After Syk-mediated HS1 phosphorylation, Lyn Src homology domain 2 motif can bind transiently to the phosphorylated Tyr-residues,4,11 causing HS1 hyperphosphorylation. Still, it is unknown how signaling translates into cellular functions.
We have previously demonstrated that in chronic lymphocytic leukemia (CLL) the level of phosphorylation of HS1 in leukemic cells correlates with the clinical prognosis, the HS1 hyperphosphorylation being associated with a worse outcome.12 Further and consistent with its role in actin assembly, we recently found that HS1 binds to several cytoskeleton proteins and adapters in both normal and CLL B cells.13
CLL, the most frequent leukemia in the Western hemisphere, is characterized by the accumulation of monoclonal CD5+ B cells that appear to be Ag-experienced and are responsive to microenvironmental stimuli, including those originating from the B-cell receptor.14 Leukemic CLL cells circulate in the peripheral blood (PB), invade lymphoid organs, and have a preferential homing to the bone marrow (BM).15 Despite a wealth of investigations, the rules that control the trafficking of leukemic B cells are still unclear.
The possibility has been raised that the organization of cytoskeleton components is involved in the trafficking of leukemic CLL cells and may influence the patient's outcome.16,17 CLL cells show impaired cell motility, diminished capping by multivalent ligands, and enhanced susceptibility to microtubule-disrupting drugs.18 They have specific adhesion structures, and their in vitro adhesion capability is marked.19 In addition, immunologic synapses between CLL B and T cells do not form properly because of defects in both B- and T-cell compartments.20 On the T-cell side, these defects are characterized by suppressed F-actin polymerization and by the recruitment of key molecules, such as lymphocyte function antigen-1, T-cell receptor, and Lck, as well as of signaling molecules, including Cdc42, WAS protein, dynamin-2, and filamin A.20 Similar T-cell defects have been confirmed in the Eμ-TCL1 transgenic (tg) mouse,20 an animal model that between 13 and 18 months of age develops a disease resembling the aggressive form of human CLL.21
In the current study, we have analyzed the role of HS1 in migration, trafficking, and homing of leukemic B cells, using in vitro and in vivo models that entail both mouse and human B cells. We demonstrate that HS1 is a central regulator of leukemic B-cell trafficking and homing and that it has a significant effect in the leukemia natural history.
Methods
Human tissue samples and cell purification
Leukemic lymphocytes were obtained from the PB of patients with CLL, diagnosed according to Mulligan et al.22 All tissue samples were obtained with approval of the institutional review board of San Raffaele University Hospital (Milano, Italy). Purity of all preparations was always above 99%, and the cells coexpressed CD19 and CD5 on their cell surfaces as checked by flow cytometry (FC500; Beckman Coulter); preparations were virtually devoid of NK, T lymphocytes, and monocytes with the use of a human B-cell enrichment cocktail (RosetteSep; StemCell Technologies) or column-separated (Miltenyi Biotec).
Generation of stable cell lines expressing green fluorescent protein
We used a BLOCK-iT Pol II miR-RNAi Expression Vector Kit (Invitrogen) for vector-based expression of miRNA according to the manufacturer's instructions.
We generated 4 different double-stranded oligo duplex (supplemental Methods, available on the Blood Web site; see the Supplemental Materials link at the top of the online article) encoding a miRNA target sequence for HS1. Cells were transfected, taking advantage of Nucleofactor technology (AMAXA) with the use of the program X-001, solution V. The pcDNA 6.2-GW/EmGFP-miR vectors expressing anti-HS1 miRNAs and a pcDNA 6.2-GW/EmGFP-miR negative control (CNTR) were used for transfection into MEC1. We generated 2 stable cell lines transfected with 2 different miRNA-containing plasmids, resulting in HS1 KD1 (oligo HS1 1; supplemental Methods) and HS1 KD2 (oligo HS1 2; supplemental Methods).
RNA extraction and real-time polymerase chain reaction
After Trizol (Invitrogen) extraction, 1 μg of total RNA was reverse transcribed into cDNA with the use of random primers oligonucleotides and ThermoScript II (Invitrogen). Real-time polymerase chain reaction (PCR) was performed with a 10-fold dilution of cDNA sample in each reaction. The Applied Biosystems “real-time” version of the assay on the ABI Prism 7900 thermal-cycler and TaqMan Universal PCR MasterMix (Applied Biosystems) was used. Primers, probes, and analysis information are described in supplemental Methods.
Cell lysis and Western blot analysis
Cells were lysed (≅ 30 μg of proteins) with ice-cold Lysis Buffer (NaCl 0.15M; 1% NP40; 1mM EDTA [ethylenediaminetetraacetic acid], pH = 8; 50mM Tris-HCl [tris(hydroxymethyl)aminomethane], pH = 7, 1mM pepstatin, 1mM leupeptin, 10mM phenylmethylsulfonyl fluoride, 2mM sodium orthovanadate, and 1mM NaF). For sodium dodecyl sulfate–polyacrylamide gel electrophoresis (SDS-PAGE), polyacrylamide gels were made with different percentages of acrylamide (7.5%, 10%, or 12%), depending on the molecular weight of the protein to be resolved. Immunoreactivity was shown by incubation with secondary antibodies conjugated with horseradish peroxidase.
Immunoprecipitation
Total cell lysates (≅ 500 μg of proteins) were incubated with the indicated antibody and immobilized on protein G microbeads (Miltenyi Biotec); immunoprecipitated proteins were purified with the use of specific columns according to the manufacturer's instructions (Miltenyi Biotec). Proteins were eluted in Laemmli buffer (50mM Tris HCl pH = 6.8, 1% SDS, 0.005% bromophenol blue, 10% glycerol, 50mM fresh dithiothreitol) and resolved by SDS-PAGE. TrueBlot secondary antibodies were used for the detection.
In vitro migration on transwell
CD19+ cells from the mice spleen were enriched by depletion of non-B cells through the EasySep Negative selection Mouse B cell Enrichment Cocktail on EasySep Magnet (StemCell Technologies), following the manufacturer's indications. Purified B cells (1 × 10⁶) from mice (wild-type [WT], HS1−/−) and CNTR/HS1 KD cells were seeded on a transwell chamber 6.5-mm diameter and 5.0-μm pore size (Corning Incorporated); after 4 hours the cells migrated in the lower part of the chamber were counted at the cytometer (FC500). Spontaneous migration was evaluated as the number of cells collected in the lower chamber and counted by flow cytometer for 1 minute.
Chemokine-mediated migration was evaluated with the addition of 100 ng of human or mouse stromal cell–derived factor 1α (PeproTech) to the lower chamber and the migration index was calculated (no. of cells migrated after chemokine addiction − no. of cells migrated without) × 100/no. of total cells).
Adhesion assay
CNTR, HS1 KD, and purified B cells (EasySep Negative selection) from mice (WT, HS1−/−) were labeled with 1mM Cell Tracker Green (CMFDA; Invitrogen) and added at 5 × 10⁵ cells/well (triplicate) in flat-bottom 96-well plates precoated with phosphate-buffered saline (PBS) or 2% bovine serum albumin (BSA)–PBS (as background) or 4 mg/mL intercellular adhesion molecule 1(ICAM-1)/Fc (R&D Systems) in PBS. Adhesion was quantified after 1 hour of incubation with the use of using VICTOR3 (PerkinElmer) plate reader. For CLL cells, we calculated the mean fluorescence obtained by the subtraction of the background (mean reading for wells coated with PBS only). For murine cells able to adhere to ICAM-1 coating, we calculated the specific adhesion by subtracting background (2% BSA-PBS) adhesion from the reading of each well. The specific adhesion was expressed as a percentage of the total emission before the washing, which is the total cell input.
Polymerization assay
Purified B cells (1 × 10⁶; EasySep Negative selection) from mice (WT, HS1−/−) were prewarmed at 37°C in RPMI without serum. After a 10-minute incubation with anti-IgM the reaction was stopped with 4% paraformaldehyde, and cells were permeabilized with saponine 0.2% on ice. We added Phalloidin Alexa Fluor 633 (1:1000), and we analyzed the percentage of F-actin by flow cytometry (FC500). We finally quantified by flow the F-actin increase as the result of (mean fluorescence intensity after anti-IgM stimulation)/mean fluorescence time zero.
Total internal reflection fluorescence microscopy
CNTR and HS1 KD cells were incubated on poli-L-Ornithine–coated glass-bottom dishes (WillCO-dish) for 2 hours at 37°C and 5% CO2. Cells were fixed with 4% paraformaldehyde, permeabilized with 0.1% Triton-X100 (Sigma), stained for phalloidin Alexa Fluor 633 (1:500), and acquired with a Leica AM total internal reflection fluorescence MC microscope.
Mice
Mice were housed and bred in a specific pathogen-free animal facility, treated in accordance with the European Union guidelines and approval of the Institutional Ethical Committee of the Istituto Scientifico San Raffaele.
Rag2−/−γc−/− mice (background strain BALB/c) were kindly provided by Dr Kawahata (Central Institute for Experimental Animals), HS1−/− mice (background strain C57BL/6) by Dr T. Watanabe (University of Tokyo) and Eμ-TCL1 tg mice (background strain C3HBL/6) by Carlo Croce (University Cancer Center Columbus) and were all expanded in our mouse colony. WT C57BL/6 and C3HBL/6 mice were supplied by Charles River Laboratories. Homozygous Eμ-TCL1 tg (Ttg/tg) were crossed with HS1−/− (H−/−) to obtain age-matched H−/−/Ttg/tg, H−/wt/Ttg/tg, Hwt/wt/Ttg/tg, H−/−/Ttg/wt, H−/wt/Ttg/wt, Hwt/wt/ Ttg/wt, Hwt/wt/Ttg/tg, Hwt/wt/Ttg/wt, and Hwt/wt/Twt/wt mice (F2 progeny). Genotyping was performed on tail DNAs by PCR and real-time PCR with the use of primers described in supplemental Methods. H−/−/Ttg/wt, Hwt/wt/Ttg/wt, H−/−/Twt/wt, and Hwt/wt/Twt/wt were used for the experiments.
Murine cell preparations
Hwt/wt/Ttg/wt mice and H−/−/Ttg/wt mice were bled once a month starting from 2 months of age to monitor the appearance of leukemic lymphocytes in PB by flow cytometry. Hwt/wt/Ttg/wt and H−/−/Ttg/wt mice were killed when they developed at least 30% expansion of CD5+ B cells in PB, together with age-matched Hwt/wt/Ttg/wt littermates and organs (PB, peritoneal exudates [PEs], spleen, and femur) were collected. For immunoglobulin gene rearrangement analysis CD19+ cells from the spleen were enriched by depletion of non-B cells through the EasySep Negative selection. Full counts of white blood cells in each lymphoid compartment were made “on a cell counter” (Coulter). Cells from spleen and BM and cells isolated from the PE and PB (35 μL) were analyzed by flow cytometry (see supplemental Methods) for both surface Ag expression and clonality.
Histopathology and immunohistochemistry
Tissues were fixed in 4% formalin for 12 hours, then embedded and included in paraffin wax. Sections (5-mm thick) were cut and stained with hematoxylin and eosin according to standard protocols. Microscopic specimens were evaluated by a pathologist in a blinded fashion, and mice were defined leukemic when spleen structure was subverted and the white pulp was greatly expanded.
For immunohistochemistry see supplemental Methods.
In vivo migration assay
HS1−/− mice and age-matched WT C57BL/6 mice were used as donors and recipients for in vivo migration experiments. Purified B cells from spleen were labeled with 2 different concentrations (0125μM for WT cell population and 1.25μM for HS1−/− cell population) of 5-(6-) carboxy fluorescein succinimidyl ester (CFSE) according to the manufacturer's instructions (Molecular Probes). A 1:1 mixture of CFSE-high and CFSE-low labeled B cells was prepared and resuspended in PBS. Each recipient mouse, WT or HS1−/−, was injected intravenously with a 1:1 mixture of CFSE-high– and CFSE-low–labeled B lymphocytes 20 × 106 mixed cells in a total volume of 300 μL. The ratio of CFSE-high– and CFSE-low–labeled donor cells before injection was confirmed by flow cytometry. Twenty hours later, recipient mice were killed, and lymphoid organs and blood were recovered. Lymph node (LN) cells were dissociated between 2 lint slides. Cells (2 × 10⁶) isolated from spleen, BM, and LNs, and cells collected from PB (50 μL) and PEs were stained for surface expression of CD19 with the use of phycoerythrin-cyanine 7 rat anti–mouse CD19 (1D3) antibody (BD Biosciences PharMingen) and analyzed by flow cytometry with the use of a FC500 cytometer (Beckman/Coulter) with logarithmic detection of green fluorescence (CFSE) and red fluorescence (phycoerythrin-cyanine 7). 7-amino-actinomycin D (7AAD; Beckman/Coulter) was used to mark and exclude dead cells. Five hundred thousand events were acquired from the spleen, LN, and BM, and 1 500 000 events were acquired from the PB of HS1−/− recipient mice, whereas 250 000 events were acquired from all organs of the WT recipients. The same experimental procedure was used for in vivo migration assay with human B cells from patients with CLL.
Xenograft studies
Eight-week-old Rag2−/−γc−/− male mice were challenged subcutaneously in the left flank with 10 × 106 MEC1 cells expressing green fluorescent protein (GFP; CNTR or HS1 KD) in 0.1 mL of saline through a 27-gauge needle. Animals were monitored twice a week for weight and tumor growth (measuring 3 perpendicular diameters), and the animals were killed when the mean tumor volume reached a dimension of 1000 mm3 or greater. Subcutaneous tumors and organs (spleen, LNs, kidneys, liver, lungs, and femoral BM) were extracted, and tissue sections were prepared for confocal microscopy as described in supplemental Methods.
Statistical analysis
Statistical analyses were performed with the use of the Student t test. Data were expressed as the mean value ± SD, and comparison of growth curves was considered statistically significant for P less than .05. Comparison of survival curves was performed with the use of the log-rank test.
Results
In vitro the absence of HS1 interferes with cytoskeleton remodeling and F-actin polymerization
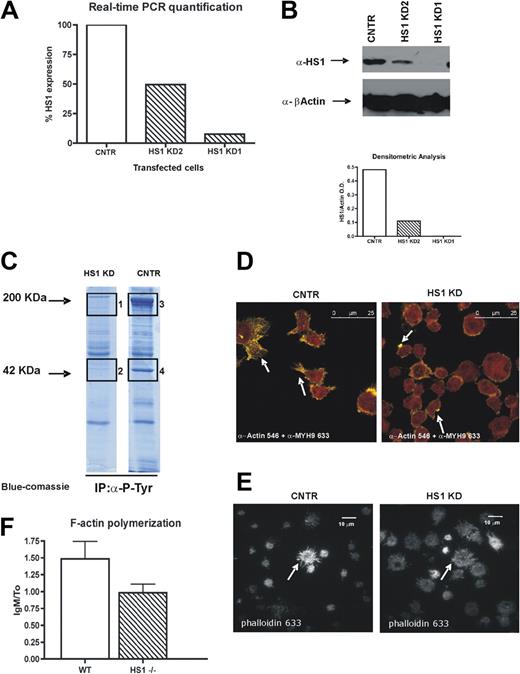
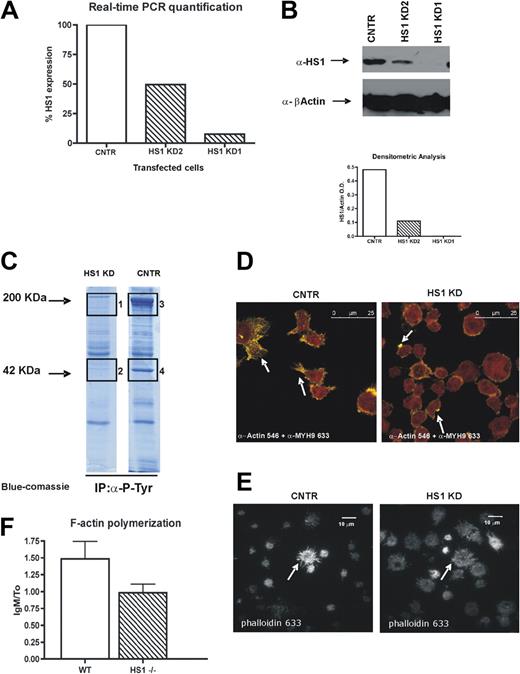
We knocked down HS1 protein in the CLL cell line MEC1,23 and we generated 3 stable cell lines. The first expressed a control plasmid (CNTR), the other 2 were transfected with 2 different miRNA-containing plasmids, resulting in HS1 KD1 and HS1 KD2, which, respectively, expressed 10% and 80% of HS1 mRNA (Figure 1A). Because of the use of a miRNA silencing system, the decrease of the HS1 protein amount in the transfected cells was greater than that of HS1 mRNA (Figure 1B). Because the silencing was more effective in HS1 KD1 cells in further experiments, we used only this cell line that is from now on defined HS1 KD. We did not detect major differences in surface phenotype of the transduced cell lines (see list of CD Ags in supplemental Methods).
HS1 silencing affects F-actin polymerization, distribution, and activation of cytoskeleton components. (A) Relative expression of HS1 evaluated by real-time PCR in 3 stable cell lines obtained from MEC1 cell line, either expressing GFP only (CNTR) or after HS1 silencing (HS1 KD1 and KD2). (B) Western blot analysis for HS1 on silenced cell lines (CNTR, KD1, and KD2); β-actin is used as control. Graph represents the densitometric analysis to quantify the protein expression levels. Because the silencing was more effective in HS1 KD1 cells in further experiments, we used only this cell line that is from now on defined as HS1 KD. (C) Immunoprecipitation experiments for total phosphotyrosine on CNTR and HS1 KD cell protein lysates; the gel is blue-Coomassie stained, and bands 1, 2, 3, and 4 were trypsin digested and analyzed by high-resolution mass spectrometry (see “Results” and Table 1). (D) Confocal analysis of CNTR and HS1 KD cells with anti-actin and anti–myosin heavy chain 9 (MYH9) primary antibodies detected with Alexa Fluor 546 (yellow)– and 633 (red)–conjugated secondary antibodies. White arrows indicate characteristic CNTR cell protrusions and HS1 KD dotted actin accumulation, the overlap between Alexa Fluor 546 and 633 is orange. Images were acquired with a laser scanning confocal microscope (Leica SPS) with the use of an inverted 63× oil objective equipped with a resonant scanner. (E) Total internal reflection fluorescence acquisition after Phalloidin Alexa Fluor 633 staining on CNTR cells and HS1 KD adhered on poli-L-Ornithine coating, arrows indicate the different F-actin distribution. Images were acquired with a TIRF microscope (Leica AM) with the use of a 60× oil objective equipped with an Andor ENCCD camera. (F) F-actin polymerization is represented as the ratio of the flow cytometric mean fluorescence intensity (MFI) values after and before IgM stimulation in WT and HS1−/− mice B splenocytes (6 animals/group).
HS1 silencing affects F-actin polymerization, distribution, and activation of cytoskeleton components. (A) Relative expression of HS1 evaluated by real-time PCR in 3 stable cell lines obtained from MEC1 cell line, either expressing GFP only (CNTR) or after HS1 silencing (HS1 KD1 and KD2). (B) Western blot analysis for HS1 on silenced cell lines (CNTR, KD1, and KD2); β-actin is used as control. Graph represents the densitometric analysis to quantify the protein expression levels. Because the silencing was more effective in HS1 KD1 cells in further experiments, we used only this cell line that is from now on defined as HS1 KD. (C) Immunoprecipitation experiments for total phosphotyrosine on CNTR and HS1 KD cell protein lysates; the gel is blue-Coomassie stained, and bands 1, 2, 3, and 4 were trypsin digested and analyzed by high-resolution mass spectrometry (see “Results” and Table 1). (D) Confocal analysis of CNTR and HS1 KD cells with anti-actin and anti–myosin heavy chain 9 (MYH9) primary antibodies detected with Alexa Fluor 546 (yellow)– and 633 (red)–conjugated secondary antibodies. White arrows indicate characteristic CNTR cell protrusions and HS1 KD dotted actin accumulation, the overlap between Alexa Fluor 546 and 633 is orange. Images were acquired with a laser scanning confocal microscope (Leica SPS) with the use of an inverted 63× oil objective equipped with a resonant scanner. (E) Total internal reflection fluorescence acquisition after Phalloidin Alexa Fluor 633 staining on CNTR cells and HS1 KD adhered on poli-L-Ornithine coating, arrows indicate the different F-actin distribution. Images were acquired with a TIRF microscope (Leica AM) with the use of a 60× oil objective equipped with an Andor ENCCD camera. (F) F-actin polymerization is represented as the ratio of the flow cytometric mean fluorescence intensity (MFI) values after and before IgM stimulation in WT and HS1−/− mice B splenocytes (6 animals/group).
A total antiphosphotyrosine immunoprecipitation showed that the total amount of immunoprecipitated phospho-proteins was lower in HS1 KD cells compared with CNTR (Figure 1C). By nano liquid chromatography tandem mass spectrometry we sequenced in the CNTR sample the 2 bands that were less (if at all) represented in the HS1 KD immunoprecipitation and found actin in the lower band and myosin heavy chains 9 and 10 in the higher band (Table 1). These data suggest that in HS1 KD cells the phospho-immunocomplexes have less actin and myosin, 2 proteins that are fundamental for intracellular signaling activation.24-26 On the basis of these results, we next evaluated the intracellular distribution of actin and myosin by confocal microscopy. We observed that, although myosin is equally distributed in both CNTR and HS1 KD cells, actin fails to form the expected filopodia (Figure 1D) in HS1 KD cells after adhesion to the substrate, rather it tends to accumulate at the plasma membrane. From the total internal reflection fluorescence microscopy that allows a selective visualization of the plasma membrane and the intracellular area immediately adjacent, we were able to confirm the dysregulated F-actin distribution during HS1 KD cell adhesion (Figure 1E). In addition, we observed a trend to impaired actin polymerization activity on anti-IgM stimulation (Figure 1F) in HS1−/− mice B cells that probably explains the failure of filopodia formation as described in different cellular systems.27
In vitro the absence of HS1 results in impaired cell migration, cell adhesion, and increased homotypic aggregation
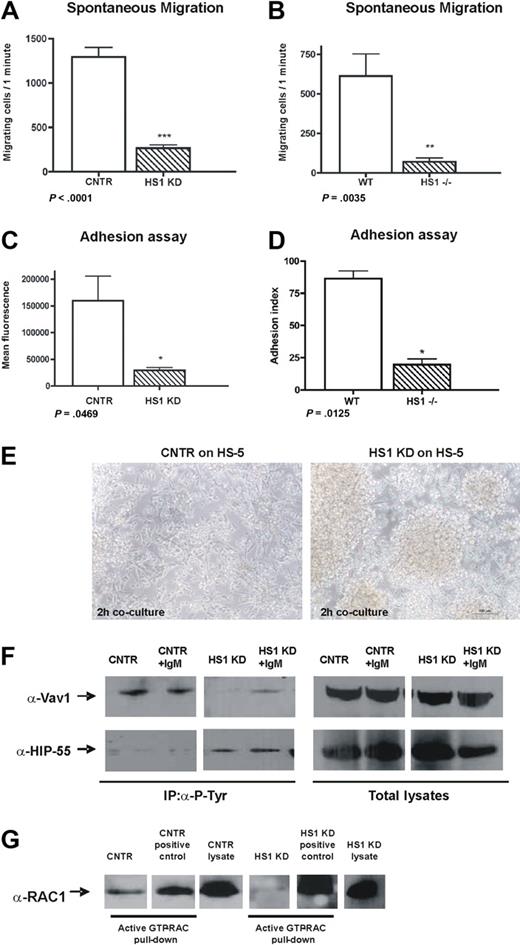
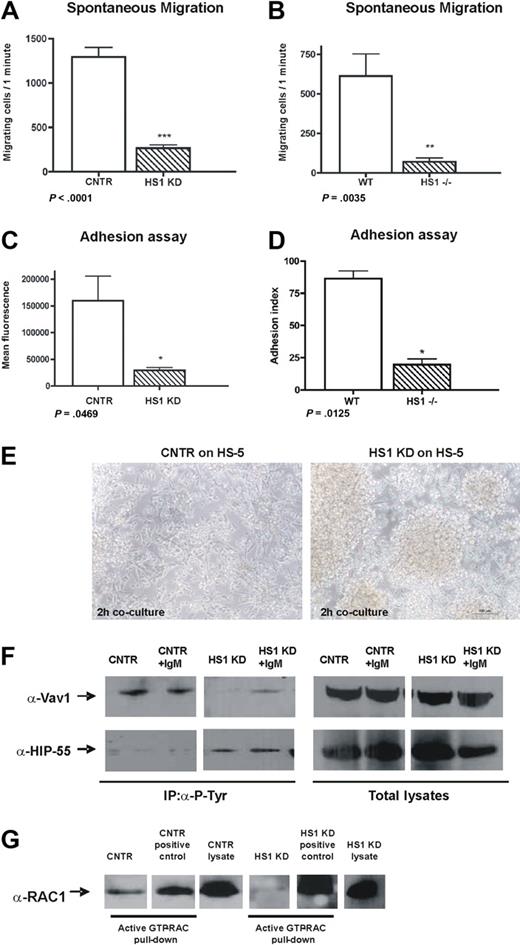
To strengthen the evidence that actin is affected by HS1 down-modulation and to evaluate the functional relevance of the observed differences, we studied in parallel human HS1 KD cells and splenic B cells from HS1−/− mice,9 investigating some of the most important cytoskeletal-related functions. First, we tested the spontaneous migratory capacity of both human HS1 KD and mouse HS1−/− cells. The in vitro spontaneous migration of human HS1 KD cells was significantly decreased (Figure 2A). Similarly the migratory capacity of purified splenic B cells from 2-month-old HS1−/− mice was more than 8-fold lower compared with WT mice (Figure 2B). No differences of CXCR4 receptor expression and no significant variation in stromal cell–derived factor 1 chemokine-mediated migration of HS1 KD and HS1−/− cells compared with CNTR and WT cells were observed (data not shown), suggesting that HS1 is involved in spontaneous rather than in chemokine-mediated migration.
HS1 absence affects migration, adhesion, and homotypic aggregation. (A) Spontaneous migration after 4 hours on transwell (pore size 5.0 μm) of CNTR and HS1 KD cell and (B) WT and HS1−/− mice purified B splenocytes (6 animals/group) is shown (*P ≤ .05; **P ≤ .01; ***P < .001). (C) Adhesion was quantified as mean fluorescence intensity (MFI) values for CNTR and HS1 KD cells and (D) as adhesion index for WT and HS1−/− mice B cells (*P ≤ .05; **P ≤ .01; ***P < .001). (E) CNTR and HS1 KD cells adhesion on a HS-5 stroma cell layer after 2 hours of coculture was acquired with Nikon TS100 microscope with the use of a 10× dry objective. (F) Immunoprecipitation experiments with the use of anti–P-Tyr on CNTR and HS1 KD cells before and after anti-IgM stimulation and WB analysis for Vav1 (top) and HIP-55 (bottom). Total lysates are shown as control. (G) Rac1/2 activation assay was performed as pull-down on CNTR and HS1 KD cells (positive controls were provided with the kit). Total lysates were also used to detect Rac1/2 expression.
HS1 absence affects migration, adhesion, and homotypic aggregation. (A) Spontaneous migration after 4 hours on transwell (pore size 5.0 μm) of CNTR and HS1 KD cell and (B) WT and HS1−/− mice purified B splenocytes (6 animals/group) is shown (*P ≤ .05; **P ≤ .01; ***P < .001). (C) Adhesion was quantified as mean fluorescence intensity (MFI) values for CNTR and HS1 KD cells and (D) as adhesion index for WT and HS1−/− mice B cells (*P ≤ .05; **P ≤ .01; ***P < .001). (E) CNTR and HS1 KD cells adhesion on a HS-5 stroma cell layer after 2 hours of coculture was acquired with Nikon TS100 microscope with the use of a 10× dry objective. (F) Immunoprecipitation experiments with the use of anti–P-Tyr on CNTR and HS1 KD cells before and after anti-IgM stimulation and WB analysis for Vav1 (top) and HIP-55 (bottom). Total lysates are shown as control. (G) Rac1/2 activation assay was performed as pull-down on CNTR and HS1 KD cells (positive controls were provided with the kit). Total lysates were also used to detect Rac1/2 expression.
The adhesion of cells lacking HS1 to basal (BSA) and to ICAM-1 matrices was significantly impaired (Figure 2C-D). HS1 KD cells also failed to adhere individually to a BM stroma layer as shown in a time-lapse experiment (supplemental Videos 1-3). In contrast, the cells tended to clump and increased homotypic aggregation-forming clusters (Figure 2E).
We then reasoned that such functional consequences of HS1 impairment should be paralleled by modifications of molecules involved in intracellular signaling pathways crucial for actin dynamics and cytoskeletal remodeling. We focused our attention on the proteins that are known to be associated with HS1 function, at least in T5 and NK cells.7 Along this reasoning, we were not surprised to observe that Vav1 phosphorylation is absent in HS1 KD cells (Figure 2F) because HS1 and Vav proteins are known to directly interact.28 In clear contrast, the actin-binding protein HIP-55, which is also interacting directly with HS1,13 was found to be constitutively phosphorylated in the absence of HS1 (Figure 2F), implying that the presence of HS1 may interfere with its phosphorylation.
In addition, given the impaired filopodia formation and actin-polymerization in B cells lacking HS1 (Figure 1D-F), we aimed at studying the Rho family members and, in particular, Rac1/2 that are among the regulators of both processes. Not surprisingly, and as already described in Cortactin (HS1 homologous) null cells,29,30 we observed that Rac1/2 was inactive in HS1 KD while it was constitutively active in CNTR cells (Figure 2G).
In vivo the absence of HS1 leads to a distinct pattern of CLL development and tissue localization
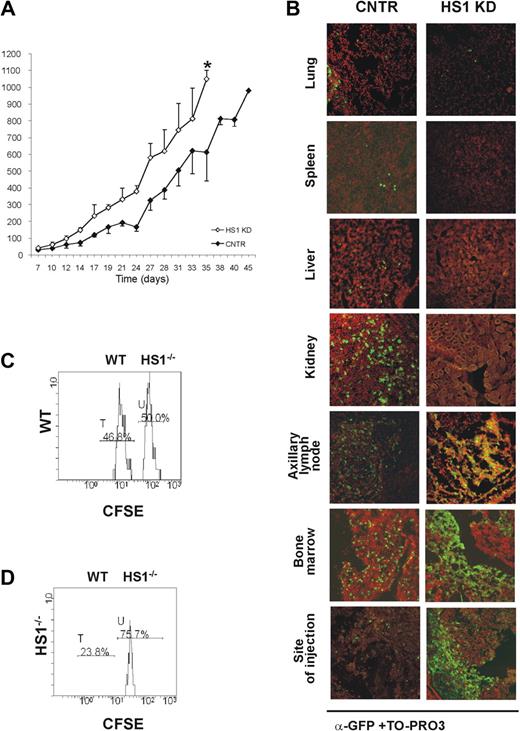
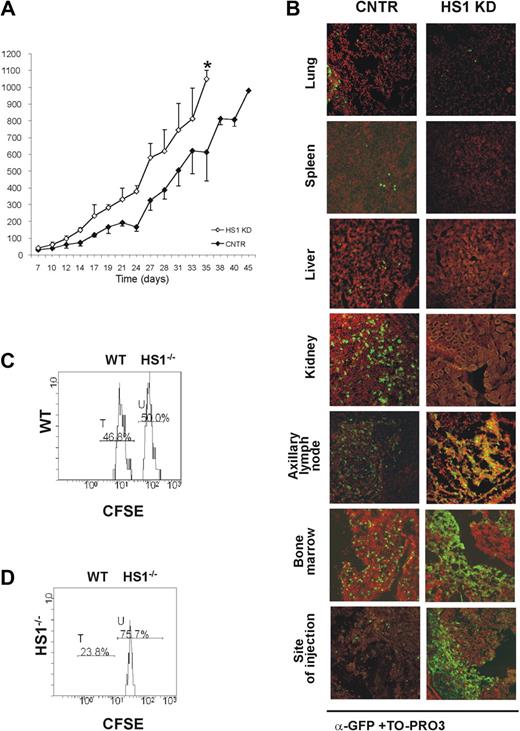
To evaluate the in vivo behavior of HS1 KD in comparison to CNTR cells, 10 × 106 cells of either type were injected subcutaneously into adult Rag2−/−γc−/− mice.31 All animals that received a transplant developed tumors resembling CLL 1 week after injection, but HS1 KD tumors reached a volume of approximately 1000 mm3 10 days earlier than CNTR cells (HS1 KD vs CNTR cells: P = .01; day 35) (Figure 3A). The tissue localization also differed, depending on the presence or the absence of HS1 (Figure 3B). As in CNTR cells (Figure 3B; supplemental Videos 4-5) HS1 KD cells accumulated in the axillary and inguinal LNs draining the site of injection and in the BM as well as in the site of injection (Figure 3B; supplemental Figure 1; supplemental Videos 6-7). In contrast, HS1 KD cells were virtually absent in the spleen, liver, lungs, and kidneys (Figure 3B). The presence of large cellular aggregates closely resembled the clustering adhesion behavior shown in vitro by HS1 KD cells cultured on human BM stroma (Figure 2E; supplemental Videos 1-3). These results suggest a relationship between the expression of HS1 and the capacity to localize in the BM as well as in the lymph nodes.32,33
HS1 KD cells show a distinct in vivo pattern of growth and localization. Rag2−/−γc−/− male mice received a transplant subcutaneously in the left flank with either GFP-expressing HS1 KD or CNTR cells (10 × 106 cells/mouse; n = 4). (A) Tumor volume was evaluated by measuring perpendicular diameters by a caliper. Animals were killed when the tumor volume reached 1000 mm3 (*P ≤ .05; day 35). (B) Cells from lung, spleen, liver, kidney, axillary tumor-draining lymph node, bone marrow, and site of injection were collected. The slides were stained with anti-GFP Alexa Fluor 488 (green) and TO-PRO3 (red) for the nuclear staining (overlap yellow). Slides were analyzed by Radiance 2100 (Bio-Rad Laboratories) dual-laser confocal microscope with the use of an inverted 20× oil objective. The extent and pattern of invasion is shown by the presence of green GFP+ leukemic cells. (C-D) HS1−/− mice (n = 3, repeated twice) and age-matched WT mice (n = 3, repeated twice) were given intravenous injections of a mixture of CFSE-low– and CFSE-high–labeled CD19+ purified splenocytes from WT and HS1−/− mice, respectively. Histogram plots represent flow cytometric analysis of 7AAD− CFSE-low (WT cells, peak T) and CFSE-high (HS1−/− cells, peak U) splenocytes obtained from BM of representative WT (C) and HS1−/−(D) recipient mice killed 20 hours after cell injection. Cells represented in each plot were gated on physical parameters. Numbers show percentages of cells falling in peaks T and U.
HS1 KD cells show a distinct in vivo pattern of growth and localization. Rag2−/−γc−/− male mice received a transplant subcutaneously in the left flank with either GFP-expressing HS1 KD or CNTR cells (10 × 106 cells/mouse; n = 4). (A) Tumor volume was evaluated by measuring perpendicular diameters by a caliper. Animals were killed when the tumor volume reached 1000 mm3 (*P ≤ .05; day 35). (B) Cells from lung, spleen, liver, kidney, axillary tumor-draining lymph node, bone marrow, and site of injection were collected. The slides were stained with anti-GFP Alexa Fluor 488 (green) and TO-PRO3 (red) for the nuclear staining (overlap yellow). Slides were analyzed by Radiance 2100 (Bio-Rad Laboratories) dual-laser confocal microscope with the use of an inverted 20× oil objective. The extent and pattern of invasion is shown by the presence of green GFP+ leukemic cells. (C-D) HS1−/− mice (n = 3, repeated twice) and age-matched WT mice (n = 3, repeated twice) were given intravenous injections of a mixture of CFSE-low– and CFSE-high–labeled CD19+ purified splenocytes from WT and HS1−/− mice, respectively. Histogram plots represent flow cytometric analysis of 7AAD− CFSE-low (WT cells, peak T) and CFSE-high (HS1−/− cells, peak U) splenocytes obtained from BM of representative WT (C) and HS1−/−(D) recipient mice killed 20 hours after cell injection. Cells represented in each plot were gated on physical parameters. Numbers show percentages of cells falling in peaks T and U.
To further substantiate our observations, CD19+ cells were purified from the spleen of 5- to 6-month-old HS1−/− and WT mice, labeled with different concentrations of CFSE, admixed (supplemental Figure 2A) and injected intravenously into 5-month-old HS1−/− and WT recipients. The expression of CFSE fluorescence on 7AAD−-gated lymphocytes confirmed the presence of 2 populations, CFSE-low (WT) and CFSE-high (HS1−/−) labeled cells. No differences were observed in the spleen, mesenteric LNs, PB of both recipient mice (supplemental Figure 2B-C, and in the BM of WT recipient mice (Figure 3C). On the contrary, HS1−/− B lymphocytes preferentially accumulated in the BM of HS1−/− recipient mice, where they represented almost 75% of CFSE+ cells (Figure 3D). These data suggest a preferential homing to the BM that cannot simply be due to the absence of HS1 in leukemic cells but also to the lack of HS1 in still undefined cellular components of the microenvironment.
In vivo propensity of human CLL cells to migrate to the BM correlates with HS1 phosphorylation
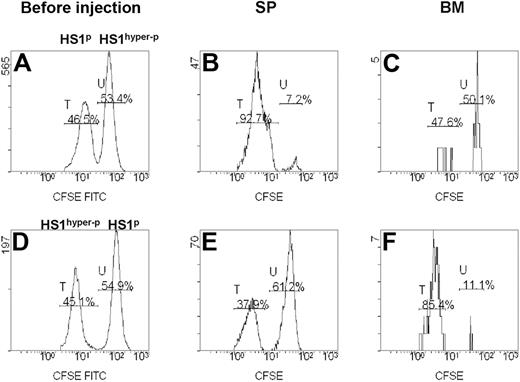
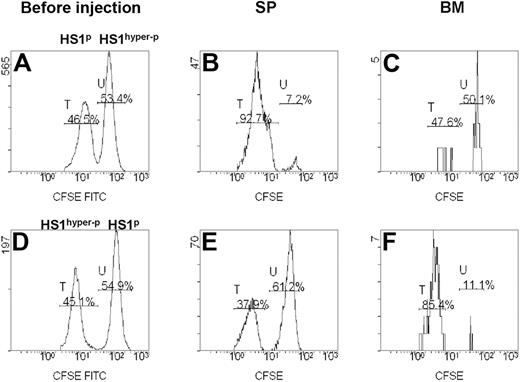
We investigated the homing ability of fresh CLL cells from patients showing different HS1 phosphorylation patterns (Table 2). CD19+ cells purified from 8 patients were paired into 4 couples according to their different HS1 phosphorylation status.12 Each couple included a case with HS1p (phosphorylated HS1) and a case with HS1hyper-p (hyper-phosphorylated HS1) CLL cells. Cells were labeled with different concentrations of CFSE, admixed, and injected intravenously into Rag2−/−γc−/− mice recipients. The expression of CFSE fluorescence on 7AAD−-gated lymphocytes allowed to discriminate 2 distinct populations, phosphorylated (CFSE-low labeled) and hyper-phosphorylated (CFSE-high labeled) HS1 cells (Figure 4A-C). In 3 of 4 couples of differentially phosphorylated paired patients HS1p CLL cells had a consistent homing rate to the spleen (Figure 4B), whereas HS1hyper−p CLL cells had a preferential homing to the BM (Figure 4C). The preferential BM homing of HS1hyper-p CLL was also reproduced when these cells were labeled with low concentrations of CSFE (CFSE-low), indicating that in vivo cell viability and migratory capacity were unaffected by different CFSE levels (Figure 4D-F).
In vivo migration of primary leukemic cells obtained from patients with CLL. Rag2−/−γc−/− mice were injected intravenously with a mixture of CD19+ CFSE-high– and CFSE-low–labeled leukemic B cells from the PB of 8 patients with CLL with a different pattern of HS1 phosphorylation (HS1hyper−p and HS1p). (A,D) Flow cytometric analysis of preinjection samples: percentages of CFSE-low (peak T) and CFSE-high (peak U) cells are indicated. The plots are gated on 7AAD− CFSE+ cells. (B-C) Flow cytometric plots show 7AAD− CFSE-low (peak T, HS1p; patient no. 6 in Table 2) and CFSE-high (peak U, HS1hyper-p; patient no. 7 in Table 2) cells obtained from spleen (SP) and BM of a representative Rag2−/−γc−/− recipient mouse killed 20 hours after cell injection. Percentages of cells falling in fractions T and U are indicated. (E-F) Flow cytometric plots show 7AAD− CFSE-low (peak T, HS1hyper-p; patient no. 1 in Table 2) and CFSE-high (peak U, HS1p; patient no. 4 in Table 2) cells obtained from SP and BM of the Rag2−/−γc−/− recipient mouse killed 20 hours after cell injection. The preferential accumulation of HS1hyper-p cells versus HS1p cells in the BM of mice is not affected by CFSE concentration.
In vivo migration of primary leukemic cells obtained from patients with CLL. Rag2−/−γc−/− mice were injected intravenously with a mixture of CD19+ CFSE-high– and CFSE-low–labeled leukemic B cells from the PB of 8 patients with CLL with a different pattern of HS1 phosphorylation (HS1hyper−p and HS1p). (A,D) Flow cytometric analysis of preinjection samples: percentages of CFSE-low (peak T) and CFSE-high (peak U) cells are indicated. The plots are gated on 7AAD− CFSE+ cells. (B-C) Flow cytometric plots show 7AAD− CFSE-low (peak T, HS1p; patient no. 6 in Table 2) and CFSE-high (peak U, HS1hyper-p; patient no. 7 in Table 2) cells obtained from spleen (SP) and BM of a representative Rag2−/−γc−/− recipient mouse killed 20 hours after cell injection. Percentages of cells falling in fractions T and U are indicated. (E-F) Flow cytometric plots show 7AAD− CFSE-low (peak T, HS1hyper-p; patient no. 1 in Table 2) and CFSE-high (peak U, HS1p; patient no. 4 in Table 2) cells obtained from SP and BM of the Rag2−/−γc−/− recipient mouse killed 20 hours after cell injection. The preferential accumulation of HS1hyper-p cells versus HS1p cells in the BM of mice is not affected by CFSE concentration.
HS1 influences the development and progression of CLL in the Eμ-TCL1 transgenic mouse model
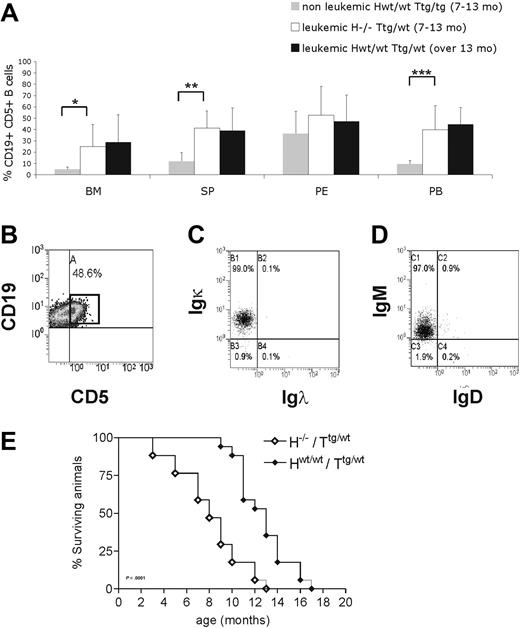
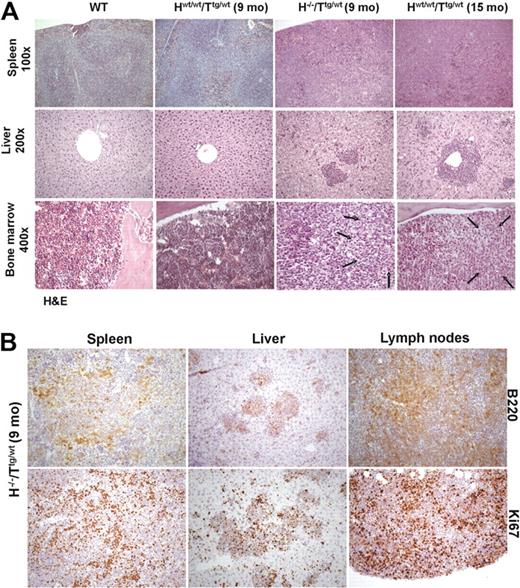
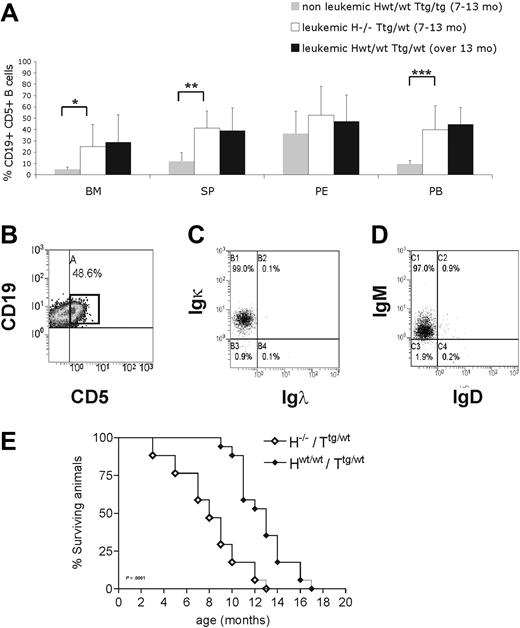
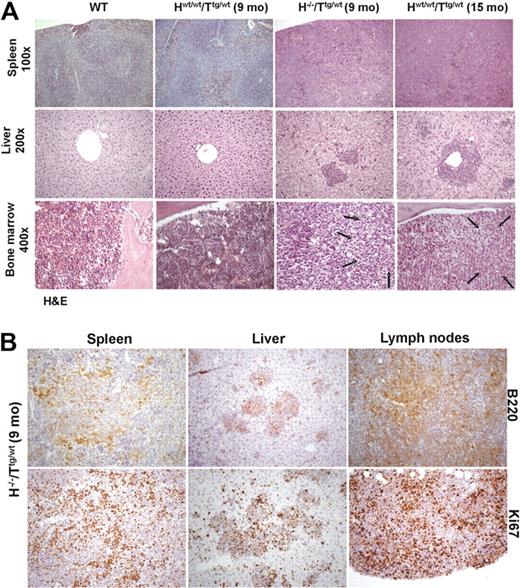
To further investigate the in vivo role of HS1 in CLL onset and progression, we crossed HS1−/− (H−/−) mice with Eμ-TCL1 tg (Ttg/tg) mice and analyzed TCL1 H−/−/Ttg/wt mice. H−/−/Ttg/wt and age-matched Hwt/wt/Ttg/wt, H−/−/Twt/wt, and Hwt/wt/Twt/wt littermates obtained in the F2 progeny were monitored for development of CLL-like disease. H−/−/Ttg/wt mice had a more precocious development of leukemia (7-13 months vs 13-18 months) (Figure 5A) as indicated by an earlier accumulation of CD19+CD5+leukemic B cells in lymphoid organs (spleen, BM, and PB) compared with the Hwt/wt/Ttg/wt mice. As in Hwt/wt/Ttg/wt mice21,34 CD19+CD5+ splenic B cells from H−/−/Ttg/wt mice showed restricted Igκ (Figure 5B-C) and IgM expression (Figure 5B,D), indicating monoclonality. The same IgM and Igκ restriction was observed in CD19+CD5+ cells obtained from the PB, peritoneal cavity, and BM (data not shown). The monoclonal origin of the CD5+Igκ+IgM+ B-cell expansion detected in H−/−/Ttg/wt mice was also confirmed by IGH gene rearrangements with the use of nested PCR followed by DNA sequencing, obtaining identical rearrangements from different tissues of the same mouse (Table 3). The analysis of the IGH gene rearrangement nucleotide sequence showed that all clones expressed unmutated IGHV genes. Histopathologic examination showed earlier accumulation of leukemic B cells in different organs (Figure 6A) of H−/−/Ttg/wt mice similarly to older Hwt/wt/Ttg/wt mice. Immunohistochemical analysis of tissues from H−/−/Ttg/wt mice confirmed that leukemic cells were B220+ and mostly proliferating (Figure 6B). The absence of HS1 had also a significant effect on Eμ-TCL1 mice survival as some mice died already at the age of 3 to 5 months (H−/−/Ttg/wt vs Hwt/wt/Ttg/wt: P < .001; Figure 5E). H−/−/Twt/wt and Hwt/wt/Twt/wt littermates showed normal survival (data not shown).
H−/−/Ttg/wt mice show a premature accumulation of CD19+CD5+ cells. (A) Mice were grouped according to the presence of at least 30% CD19+CD5+ cells in PB (leukemic mice) compared with less than 30% (nonleukemic mice). Nonleukemic Hwt/wt/Ttg/wt mice (7-13 month old; n = 8), age-matched leukemic H−/−/Ttg/wt (n = 6), and leukemic Hwt/wt/Ttg/wt (13-18 month old; n = 5) mice were analyzed by flow cytometry. The mean value ± SD of the relative contribution of CD19+CD5+ cells to the whole B-cell pool in the bone marrow (BM), spleen (SP), peritoneal cavity (PE), and peripheral blood (PB) is shown in the graph. Statistical significance was analyzed by T test. *P ≤ .05; **P ≤ .01; ***P < .001. (B) Flow cytometric plot from a representative leukemic H−/−/Ttg mouse (9 months old) show CD19+CD5+ cells in the spleen. The cells were first gated on physical parameters and then on side scatter (SSC) and CD19. Percentage of leukemic CD19+CD5+ cells is indicated. Flow cytometric plots from a representative leukemic H−/−/Ttg animal (9 months old) showing (C) Igκ and (D) IgM expression on CD19+CD5+ cells from the spleen (B). (E) Kaplan-Meier survival curves of H−/−/Ttg/wt (n = 18) and Hwt/wt/Ttg/wt (n = 17) mice are shown. Mice were included in the analysis after spontaneous death or when killed because of frank leukemia development (presence of ≥ 30% CD19+CD5+ expansion at least in the PB, monoclonal IGH gene rearrangements, tissue infiltration). Statistical analysis between groups was performed with the log-rank test (H−/−/Ttg/wt vs Hwt/wt/Ttg/wt, P < .001).
H−/−/Ttg/wt mice show a premature accumulation of CD19+CD5+ cells. (A) Mice were grouped according to the presence of at least 30% CD19+CD5+ cells in PB (leukemic mice) compared with less than 30% (nonleukemic mice). Nonleukemic Hwt/wt/Ttg/wt mice (7-13 month old; n = 8), age-matched leukemic H−/−/Ttg/wt (n = 6), and leukemic Hwt/wt/Ttg/wt (13-18 month old; n = 5) mice were analyzed by flow cytometry. The mean value ± SD of the relative contribution of CD19+CD5+ cells to the whole B-cell pool in the bone marrow (BM), spleen (SP), peritoneal cavity (PE), and peripheral blood (PB) is shown in the graph. Statistical significance was analyzed by T test. *P ≤ .05; **P ≤ .01; ***P < .001. (B) Flow cytometric plot from a representative leukemic H−/−/Ttg mouse (9 months old) show CD19+CD5+ cells in the spleen. The cells were first gated on physical parameters and then on side scatter (SSC) and CD19. Percentage of leukemic CD19+CD5+ cells is indicated. Flow cytometric plots from a representative leukemic H−/−/Ttg animal (9 months old) showing (C) Igκ and (D) IgM expression on CD19+CD5+ cells from the spleen (B). (E) Kaplan-Meier survival curves of H−/−/Ttg/wt (n = 18) and Hwt/wt/Ttg/wt (n = 17) mice are shown. Mice were included in the analysis after spontaneous death or when killed because of frank leukemia development (presence of ≥ 30% CD19+CD5+ expansion at least in the PB, monoclonal IGH gene rearrangements, tissue infiltration). Statistical analysis between groups was performed with the log-rank test (H−/−/Ttg/wt vs Hwt/wt/Ttg/wt, P < .001).
Histologic analysis of WT, nonleukemic Hwt/wt/Ttg/wt (9 months old), leukemic H−/−/Ttg/wt mice (9 months old), and leukemic Hwt/wt/Ttg/wt (15 months old). (A) Histopathologic examination of lymphoid tissues: in comparison with WT Hwt/wt/Ttg/wt mice (9 months old) showed an early, interfollicular effacement of splenic architecture by medium-sized lymphoid cells that almost completely replaced splenic tissue in Hwt/wt/Ttg/wt (15 months old) and H−/−/Ttg/wt (9 months old) mice. Liver involvement with roughly similar degree of infiltration was noted only in Hwt/wt/Ttg/wt (15 months old) and H−/−/Ttg/wt (9 months old) mice. Areas of BM infiltration by neoplastic lymphocytes, shown by arrows, were restricted to leukemic H−/−/Ttg/wt (9 months old) and Hwt/wt/Ttg/wt (15 months old) mice (hematoxylin-eosin stained sections; 100× magnification for spleen, 200× for liver; 400× for bone marrow). (B) Immunohistochemical stains showed that in H−/−/Ttg/wt mice (9 months old) the majority of leukemic infiltrates in spleen, liver, and mesenteric lymph nodes was B220+ (top panel). The lower panel highlights the different replicative fraction in the evaluated organs, according to Ki-67 immunostaining (200×). Images were acquired with an Axioscop 40 microscope (Zeiss) equipped with an Axiocam MRC camera (Zeiss).
Histologic analysis of WT, nonleukemic Hwt/wt/Ttg/wt (9 months old), leukemic H−/−/Ttg/wt mice (9 months old), and leukemic Hwt/wt/Ttg/wt (15 months old). (A) Histopathologic examination of lymphoid tissues: in comparison with WT Hwt/wt/Ttg/wt mice (9 months old) showed an early, interfollicular effacement of splenic architecture by medium-sized lymphoid cells that almost completely replaced splenic tissue in Hwt/wt/Ttg/wt (15 months old) and H−/−/Ttg/wt (9 months old) mice. Liver involvement with roughly similar degree of infiltration was noted only in Hwt/wt/Ttg/wt (15 months old) and H−/−/Ttg/wt (9 months old) mice. Areas of BM infiltration by neoplastic lymphocytes, shown by arrows, were restricted to leukemic H−/−/Ttg/wt (9 months old) and Hwt/wt/Ttg/wt (15 months old) mice (hematoxylin-eosin stained sections; 100× magnification for spleen, 200× for liver; 400× for bone marrow). (B) Immunohistochemical stains showed that in H−/−/Ttg/wt mice (9 months old) the majority of leukemic infiltrates in spleen, liver, and mesenteric lymph nodes was B220+ (top panel). The lower panel highlights the different replicative fraction in the evaluated organs, according to Ki-67 immunostaining (200×). Images were acquired with an Axioscop 40 microscope (Zeiss) equipped with an Axiocam MRC camera (Zeiss).
Discussion
We have investigated the function of HS1 in normal and leukemic B lymphocytes. We demonstrate that HS1 controls the trafficking and homing of B cells and significantly influences the tissue invasion and especially the BM infiltration that typically occurs in CLL.
The rationale for this study is 3-fold. First, HS1 is an actin regulator of the immune synapse in T cells5 and regulates adhesion, lytic synapse formation, cytolytic activity, and chemotaxis in NK cells,7 although its function in B cells is poorly defined. Second, the phosphorylation level of HS1 relates to the clinical course of patients with CLL, the hyperphosphorylated form of HS1 being associated with a more aggressive disease.12 Third, in both normal and leukemic B cells, HS1 interacts with cytoskeleton adapters involved in cytoskeleton reorganization.13 Taken together, these data indicate that CLL is an attractive model to evaluate the function of HS1 in B cells and to elucidate how it might relate to the leukemia natural history.
To address the issue, we analyzed in parallel B cells from HS1−/− mice, an HS1-silenced human CLL cell line, and primary leukemic B cells from patients with CLL showing different levels of HS1 phosphorylation. All our in vitro results converge to the conclusion that HS1 affects migration, F-actin polymerization, cell adhesion, and homotypic aggregation of B cells, showing that HS1 is involved in the regulation of the B-cell cytoskeleton. This probably leads to an instability of the cytoskeleton cell signaling complex, especially of Vav1, HIP-55, and Rac1/2, and confirms that HS1 is closely linked to actin.13,35 These data suggest that HS1 has a role in the cytoskeleton remodeling to induce the reorganization that allows cellular movements and migration.
To evaluate how HS1 influences the behavior of CLL cells in vivo we took advantage of several mouse models. The in vivo migration analysis of CD19+ splenocytes from HS1−/− mice showed a preferential accumulation of HS1−/− cells in the BM of HS1−/− recipient mice. This observation implies that an important role is also exerted by still undefined microenvironmental components, considering that such preferential localization was not observed when HS1 was absent only in leukemic cells injected into WT animals.
To further investigate the effect derived from the absence of HS1 we also crossed the Eμ-TCL1 tg mice with HS1−/− mice and demonstrated an earlier accumulation of monoclonal CD19+CD5+ cells in the PB and all lymphoid tissues examined. In addition, H−/−/Ttg/wt mice showed a shorter survival because of early disease dissemination in a way that is reminiscent of the pattern observed in patients with aggressive disease. Therefore, the absence of HS1 has profound effects on the development and progression of leukemia in the original Eμ-TCL1 tg mice. The latter have a rather delayed onset of the disease, whereas, in contrast, H−/−/Ttg/wt animals present a large leukemia load already at 7 months of age. Leukemic cells express unmutated IGHV genes and infiltrate all lymphoid tissues, thereby closely recapitulating the aggressive form of human CLL. The early onset of the leukemic cell population in all the lymphoid compartments make H−/−/Ttg/wt mice a significant model for investigating the biology of CLL.
Moving from the mouse models in which HS1 was lacking to human samples, we studied primary CLL cells obtained from patients who express HS1 with a different level of phosphorylation. Interestingly, leukemic cells carrying HS1 in the hyperphosphorylated form showed a lower degree of organ infiltration when injected into Rag2−/−γc−/− mice, but accumulated in the BM indicating that HS1hyperp leukemic cells tend to have a preferential BM homing. These results on the migration and homing of differentially phosphorylated leukemic B cells together with the previous in vitro and in vivo evidence gathered from HS1−/− cells strongly suggest that hyperphosphorylation leads to HS1 inactivation, rather than activation. This is not surprising because inactivation by phosphorylation has been reported for other cytoskeleton-related molecules36,37 and helps to explain the correlation between the hyperphosphorylated form of HS1 and a more aggressive course of the disease.12,38
In conclusion, HS1 emerges as a key molecule that controls B-cell migration and specific organ homing and regulates the leukemic peripheral tissue invasion and dissemination especially to the BM. The regulatory role exerted by HS1 in this context can result in different cell dynamics in vivo. HS1−/− cells or leukemic cells with impaired HS1 activity may preferentially home to the BM in response to local microenvironment cross-talk that might be enhanced in the absence of HS1. Alternatively, cells with defective HS1 activity may be unable to exit the BM once they have entered and continue to accumulate locally. In either case, these cells find the BM a preferential environment for survival and/or a preferential soil for proliferation and expansion. These mechanisms are not mutually exclusive, rather they all underscore the critical effects of tissue microenvironment cross-talk in the progression of leukemia and assign a central significance to HS1.
The online version of this article contains a data supplement.
The publication costs of this article were defrayed in part by page charge payment. Therefore, and solely to indicate this fact, this article is hereby marked “advertisement” in accordance with 18 USC section 1734.
Acknowledgments
We thank Lydia Scarfò, Annalisa Camporale, Miriam Ascani, Lorenzo Piemonti, Barbara Agostino, Moreno Zamai, Mary Anna Venneri, and Stefano Casola for helpful suggestions and technical support. HS1−/− mice were generously provided by T. Watanabe (University of Tokyo). Rag2−/− γc−/− mice were kindly provided by Dr Kawahata (Central Institute for Experimental Animals, Kawasaky, Japan). Eμ-TCL1 tg mice were generously provided by C. Croce (University Cancer Center Columbus) and N. Chiorazzi (The Feinstein Institute for Medical Research).
This work was supported by the Associazione Italiana per la Ricerca sul Cancro (AIRC), Program Molecular Clinicial Oncology-5 per mille number 9965, Fondazione Italiana per la Ricerca sul Cancro (FIRC), “Fondazione Piera, Pietro e Giovanni Ferrero,“ “Fondazione Anna Villa e Felice Rusconi,” EHA Fellowship Program, “CLLGRF US/European Alliance for the Therapy of CLL,” MIUR-FIRB, MIUR-PRIN, Progetti Integrati Oncologia (PIO), and Ministero della Salute.
Authorship
Contribution: C.S. and M.T.S.B. designed the study, performed the experiments, analyzed the data and wrote the manuscript; G.S. performed in vivo experiments and immunoglobulin studies; A.D. designed and performed immunoglobulin studies; E.T.H. performed in vitro experiments; C.F. performed in vivo experiments; M.M. analyzed the data and assisted in writing the manuscript; V.C. performed the microscopy experiments and assisted in writing the manuscript; U.R. and A.B. performed mass spectrometry; M.R. performed histology; M.P. interpreted histology and wrote the manuscript; D.K. provided the HS1−/− mice; and P.G. and F.C.C. analyzed the data and wrote the manuscript.
Conflict-of-interest disclosure: The authors declare no competing financial interests.
Correspondence: Paolo Ghia Università Vita-Salute San Raffaele, Via Olgettina 58, 20132, Milano, Italy; e-mail: ghia.paolo@hsr.it; or Federico Caligaris-Cappio, Università Vita-Salute San Raffaele, Via Olgettina 58, 20132, Milano, Italy; e-mail: ghia.paolo@hsr.it, caligaris.federico@hsr.it.
References
Author notes
C.S. and M.T.S.B. contributed equally to this study.

