Abstract
Abstract 1833
GA101 is the first type II glycoengineered and humanized monoclonal anti-CD20 antibody to enter clinical trials. BO20999 is an open label multicenter, phase I/II study evaluating GA101 safety, tolerability and pharmacokinetics in patients with relapsed/refractory CD20+ NHL/CLL. Phase I results showed an end of treatment response rate (EOR) of 33% in NHL patients (Salles G. et al, Blood [ASH Annual Meeting Abstracts], Nov 2009; 114: 1704). Phase II results recently reported for indolent NHL showed an EOR of 55% and 17% for GA101 monotherapy given at a high dose (HD) and a low dose (LD), respectively supporting a possible dose-response relationship (Salles G. et al, Haematologica 2010; 95[suppl.2]:229, abs. 0558). Here within, we describe the results of analyses exploring GA101 exposure and response in indolent NHL patients.
Phase I Study: 21 patients with CD20+B-lymphoproliferative disorders including [follicular lymphoma (fNHL), mantle cell lymphoma (MCL), diffused large B cell lymphoma (DLBCL), Waldenstrom's macroglobulinemia (WM), small lymphocytic lymphoma (SLL) and lymphoplasmacytoid lymphoma received intravenous GA101 as a flat dose in a safety driven dose escalation 3+3 design (from 50 mg to 2000 mg).
Phase II Study: 40 indolent NHL patients were randomized to receive low dose (LD) GA101 (n=18) or a high dose (HD) (n=22). GA101 was given on d1, d8, d22 and q21 days for a total of 9 infusions as a flat dose. In the LD cohort, GA101 was 400 mg; in the HD cohort, d1 and d8 were 1600 mg and subsequently 800 mg thereafter.
GA101 serum samples were taken prior to and immediately after each infusion, for all eight cycles. Additional serum samples were taken between days 1–21 during cycle 1 and between days 1–25 during cycle 8. Serum levels of GA101 were measured by ELISA.
Phase I GA101 PK data: Although a high degree of variability was observed in the GA101 plasma concentrations, due in part to inter-individual differences, mean GA101 plasma concentration increased with dose.
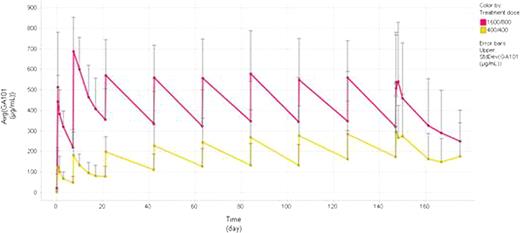
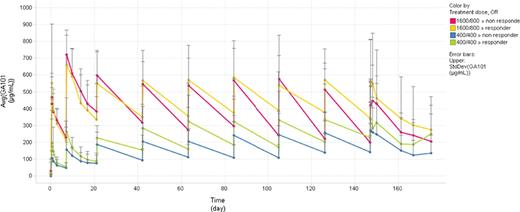
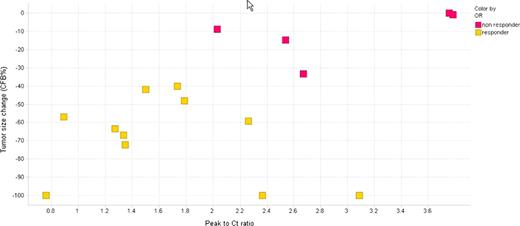
Phase II GA101 PK data: As anticipated, higher GA101 plasma concentrations were observed in the HD group compared to the LD group (Figure 1). In the HD group after cycle 2 mean Cmax and Cmin values plateaued whereas in the LD group both mean Cmax and Cmin values continued to increase between cycles 2 and 8. Given there were some responses (n=3) in the LD group, a dose of 400 mg has some biological effects; however target saturation appears incomplete, whereas the HD group indicates sustained target saturation. Responding patients from both dose groups appeared to have higher plasma concentrations compared to non-responding patients (Figure 2). Interestingly, responding patients showed increased plasma concentrations over time whereas there was a decrease in plasma concentrations in the non-responding patients. Moreover, further analysis in the HD group demonstrated that non-responding patients have the highest peak to trough concentration ratios indicating a higher rate of GA101 elimination compared to the responding patients (Figure 3). Overall, these data indicate that responding patients appear to eliminate GA101 slower compared to non-responding patients.
Overall, GA101 plasma concentrations appeared to increase with dose in both Phase I (dose escalation) and Phase II parts of BO20999. Accumulation of GA101 levels in plasma was observed from 400/800 mg to 1200/2000 mg dose group which was consistent with target saturation.
GA101 plasma profiles indicated that responding iNHL patients appeared to eliminate GA101 slower compared to non-responding iNHL patients.
Mean GA101 concentration time profile in indolent NHL patients receiving low (400 mg) and high (1600/800 mg) doses of GA101 for a total of 9 infusions (phase II)
Mean GA101 concentration time profile in indolent NHL patients receiving low (400 mg) and high (1600/800 mg) doses of GA101 for a total of 9 infusions (phase II)
Mean GA101 concentration time profile in responders and non-responders iNHL patients following administration of low (400 mg) and high (1600/800 mg) doses of GA101 for a total of 9 infusions (phase II)
Mean GA101 concentration time profile in responders and non-responders iNHL patients following administration of low (400 mg) and high (1600/800 mg) doses of GA101 for a total of 9 infusions (phase II)
Individual tumor size reduction as percentage change from baseline (CFB%) versus individual peak to trough concentration (Ct) ratios at cycle 5 in iNHL patients following administration of 1600/800 mg dose regimen (Phase II)
Individual tumor size reduction as percentage change from baseline (CFB%) versus individual peak to trough concentration (Ct) ratios at cycle 5 in iNHL patients following administration of 1600/800 mg dose regimen (Phase II)
Wenger:Roche: Employment. Cartron:Roche: Consultancy, Honoraria; GSK: Honoraria. Morschhauser:Roche: Consultancy, Honoraria. Salles:Roche: Consultancy, Honoraria.
Author notes
Asterisk with author names denotes non-ASH members.


