Abstract
Integration of retroviral vectors in the human genome follows nonrandom patterns that favor insertional deregulation of gene expression and increase the risk of their use in clinical gene therapy. The molecular basis of retroviral target site selection is still poorly understood. We used deep sequencing technology to build genomewide, high-definition maps of > 60 000 integration sites of Moloney murine leukemia virus (MLV)– and HIV-based retroviral vectors in the genome of human CD34+ multipotent hematopoietic progenitor cells (HPCs) and used gene expression profiling, chromatin immunoprecipitation, and bioinformatics to associate integration to genetic and epigenetic features of the HPC genome. Clusters of recurrent MLV integrations identify regulatory elements (alternative promoters, enhancers, evolutionarily conserved noncoding regions) within or around protein-coding genes and microRNAs with crucial functions in HPC growth and differentiation, bearing epigenetic marks of active or poised transcription (H3K4me1, H3K4me2, H3K4me3, H3K9Ac, Pol II) and specialized chromatin configurations (H2A.Z). Overall, we mapped 3500 high-frequency integration clusters, which represent a new resource for the identification of transcriptionally active regulatory elements. High-definition MLV integration maps provide a rational basis for predicting genotoxic risks in gene therapy and a new tool for genomewide identification of promoters and regulatory elements controlling hematopoietic stem and progenitor cell functions.
Introduction
Pioneering clinical studies have shown that transplantation of genetically modified hematopoietic stem cells may cure severe genetic diseases such as severe combined immunodeficiencies (SCID),1,2 chronic granulomatous disease (CGD),3 and lysosomal storage disorders.4 Unfortunately, some of these studies showed also the limitations of retroviral gene transfer technology, which may cause severe and sometimes fatal adverse effects. In particular, insertional activation of proto-oncogenes by vectors derived from the Moloney murine leukemia virus (MLV) caused T-cell lymphoproliferative disorders in patients with X-linked SCID5,6 and premalignant expansion of myeloid progenitors in patients with CGD.3 Preclinical studies showed that HIV-derived lentiviral vectors are less likely to cause insertional gene activation,7,8 although they can still interfere with normal gene expression at the posttranscriptional level, as observed in a clinical trial of gene therapy for β-thalassemia.9 The molecular bases of vector-induced genotoxicity and the influence of vector design, transduction protocols, and the patient's genetic background in inducing severe adverse effects are still poorly understood. A better understanding of the interactions between retroviral vectors and the human genome may provide new cues to explain these phenomena and a rational basis for predicting genotoxic risks in gene therapy.
A large number of studies have focused on the molecular mechanisms by which mammalian retroviruses choose their integration sites in the target cell genome. After entering a cell, retroviral RNA genomes are reverse transcribed into double-stranded DNA and assembled in preintegration complexes (PICs) containing viral and cellular proteins. PICs translocate to the nucleus and associate with the host cell chromatin, where the viral integrase mediates proviral insertion in genomic DNA. Integration is a nonrandom process, whereby PICs of different viruses recognize components or features of the host cell chromatin in a specific fashion.10 For HIV and other lentiviruses, the LEDGF/p75 protein has been identified as the main factor tethering PICs to active chromatin,11 whereas mechanisms underlying integration site selection of other retroviruses remain largely unknown. We recently showed that MLV-derived vectors integrate preferentially in hot spots near genes controlling growth and development of hematopoietic cells and flanked by defined subsets of transcription factor binding sites (TFBSs) and suggested that MLV PICs are tethered to active regulatory regions by basal components of the transcriptional machinery.12,13 The MLV integrase and long terminal repeat enhancer are the main determinants of the selection of TFBS-rich regions of the genome.13,14
We used ligation-mediated polymerase chain reaction (LM-PCR) and pyrosequencing to build a genomewide, high-definition map of > 32 000 MLV integration sites in the genome of human CD34+ hematopoietic progenitor cells (HPCs) and used gene expression profiling, chromatin immunoprecipitation (ChIP), and bioinformatics to associate high-frequency integration clusters to specific features of the HPC genome. Similar maps were built for an HIV-derived lentiviral vector and for random insertions generated in silico and used as controls. We found that MLV integration clusters specifically map to regulatory elements (transcription start sites, promoters, enhancers, and evolutionarily conserved noncoding regions) within or around genes involved in hematopoietic functions and to chromatin regions bearing epigenetic marks of active or poised transcription associated with regulatory elements. We show that known enhancers and alternative promoters of protein-coding genes and microRNAs (miRNAs) with crucial functions in HPC growth and differentiation colocalize with MLV integration clusters. In other cases, the clusters identify elements of unknown function in the introns or flanking regions of hematopoiesis-specific genes, which candidate them as regulators of their transcription.
Methods
Cells and vectors
Human CD34+ HPCs were purified from umbilical cord blood, prestimulated for 24-48 hours in serum-free Iscove modified Dulbecco medium supplemented with serum albumin-insulin-transferrin-serum substitute, thrombopoietin, Flt-3 ligand, interleukin-6, and stem cell factor and transduced with the MFG-GFP γ-retroviral vector or vesicular stomatitis virus glycoprotein–pseudotyped lentiviral vectors in the same medium, as previously described.12 Transduction efficiency was evaluated by flow cytometry for green fluorescent protein (GFP; see supplemental Methods, available on the Blood Web site; see the Supplemental Materials link at the top of the online article).
Amplification, sequencing, and analysis of retroviral insertion sites
Genomic DNA was extracted 10 to 12 days after transduction from GFP-expressing cells enriched by fluorescence-activated cell sorting. 3′–Long terminal repeat vector-genome junctions were amplified by LM-PCR,12 adapted to the GS-FLX Genome Sequencer (Roche/454 Life Sciences) pyrosequencing platform. Crude sequence reads were processed and mapped onto the human genome by an automated bioinformatic pipeline (supplemental Figure 1). All University of California Santa Cruz (UCSC) Known Genes15 having their transcription start site (TSS) at ± 50 kilobase pairs (kb) from an integration site were annotated as targets. Genomic features were annotated when their genomic coordinates overlapped for ≥ 1 nucleotide with a ± 50-kb interval around each integration site. We used UCSC tracks for both cytosine-phosphate-guanosine (CpG) islands and conserved TFBSs. Genomic coordinates of 82 335 mammalian conserved noncoding sequences (CNCs) were described.16 A list of 718 human miRNAs was downloaded from the miRBase.17 A matched, random control dataset was generated as described in supplemental Methods. For all pairwise comparisons, we applied a 2-sample test for equality of proportions with continuity correction with the use of the Rweb 1.03 statistical analysis package (www.math.montana.edu/Rweb/).
Gene expression profiling
The expression profile of CD34+ HPCs was determined by microarray analysis run in triplicate on cells stimulated with cytokines for 72 hours. RNA was extracted from 1-2 × 10⁶ cells, transcribed into biotinylated cRNA, hybridized to Affymetrix HG-U133A + 2.0 Gene Chip arrays, and analyzed as previously described.12 The arrays were reannotated with a set of previously described custom Chip Definition Files and the corresponding Bioconductor libraries.18 To correlate retroviral integration and gene activity, average expression values were classified as absent, low (< 25th percentile in a normalized distribution), intermediate (25th to 75th percentile), and high (> 75th percentile). The microarray data have been deposited in MIAME format on the EMBL-EBI database (http://www.ebi.ac.uk/microarray/) with the accession number E-MEXP-2758.
Functional clustering analysis
Functional clustering of target genes was performed by the DAVID 2.0 Functional Annotation Tool and EASE score, as previously described.12 Gene Ontology (GO) categories were considered overrepresented when yielding an EASE score < 0.05 after Bonferroni correction for multiple testing. Highly targeted genes were also analyzed by the Ingenuity Pathways Analysis tool (Ingenuity Systems). Networks were algorithmically generated on the basis of the direct or indirect interaction between the sole Focus Genes. Network analysis identified the biologic functions or diseases or both that were most significant to the genes in the network (Fisher exact test with Bonferroni correction for multiple testing).
ChIP-on-chip analysis
Chromatin was prepared from CD34+ cells stimulated with cytokines for 72 hours after cross-linking. Nuclear extracts were sonicated to obtain DNA fragments that averaged 200-1500 basepairs (bp). The equivalent of 2 × 10⁶ cells was immunoprecipitated with antibodies described in the supplemental Methods and amplified by LM-PCR. Integrome custom arrays covering ± 1 kb from 1000 random, 829 MLV, and 401 HIV sites13 with 50-60mer tiled oligonucleotides were designed and manufactured by NimbleGen (Roche/NimbleGen Inc). Hybridization peaks were computed by the CARPET Web-based package19 and were assigned to the corresponding integration site.
Results
Generation of MLV and HIV integromes in human CD34+ HPCs
Human CD34+ HPCs (> 90% CD34+ and > 40% CD34+/CD133+) were transduced with ≤ 85% efficiency with MLV- or HIV-derived retroviral vectors (> 8 × 10⁶ HPCs for each vector type; supplemental Table 1). Vector-genome junctions were amplified by LM-PCR and pyrosequenced. MLV (n = 244 879) and HIV (n = 163 755) raw sequence reads were processed through an automated bioinformatic pipeline that eliminated short and redundant sequences, and they were mapped on the UCSC hg18 release15 of the human genome (http://genome.ucsc.edu) to obtain 32 631 and 28 382 unique insertion sites, respectively (supplemental Figure 1). As control dataset, we used 40 000 sites sampled from a library of 11 655 601 weighted, random genomic sequences. The raw sequence reads are available at the GenBank Short Read Archive under the accession number SRA024251.1.
MLV and HIV integration sites are highly clustered in the human genome
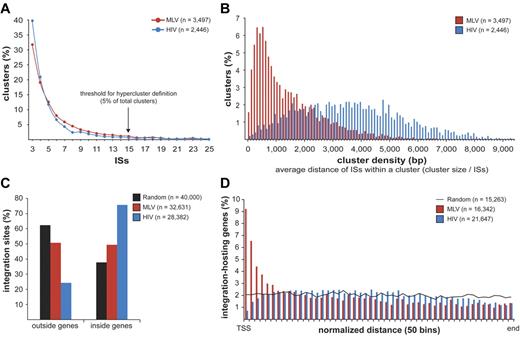
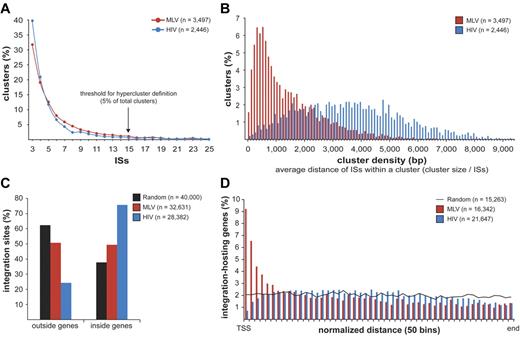
MLV, HIV, and random sites were mapped on human chromosomes in 100 000-bp intervals (supplemental Figure 2). Both MLV and HIV sites were clustered, with integration hot and cold spots. Random sites were uniformly distributed, except for centromeric, repetitive, or poorly defined regions. To give a statistical description of the clustering, we analyzed the distance between consecutive integrations for MLV, HIV, and groups of equal numbers of random sites were resampled from the 11 655 601 sequence set and obtained a threshold for cluster definition of 3 integrations within 12 587 bp for MLV and 14 460 bp for HIV (P < .01; supplemental Figure 3). We identified 3497 clusters for MLV and 2446 for HIV, containing 65.3% (21 307) and 50.6% (14 369) of the total integration sites, respectively. Most clusters contained 3-10 sites, with a similar distribution for MLV and HIV (Figure 1A). The size and density of the clusters were instead different, with an average distance among insertions of 1424 bp for MLV compared with 3593 bp for HIV (Figure 1B).
Retroviral integration clusters in the human genome. (A) Clustered distribution of 32 631 MLV and 28 382 HIV integration sites (ISs) in the genome of human CD34+ HPCs. The minimal requirement for cluster definition was 3 integrations within 12 587 bp for MLV and 14 460 bp for HIV, a threshold statistically associated to a false discovery rate of 0.01 in a control population of random sites of the same size (see supplemental Figure 3 for definition). (n) indicates the total number of clusters identified with this threshold. Clusters belonging to the upper 5% of the distribution, containing ≥ 15 integrations for both MLV and HIV, were named “hyperclusters.” (B) Density distribution plot of MLV and HIV clusters. Cluster density is defined as the average distance between integrations within a cluster, calculated by dividing the cluster size (in bp) by the number of integration sites contained in the cluster. (C) Distribution of MLV, HIV, and random integration sites with respect to Known Genes (UCSC definition). (D) Intragenic distribution of 16 342 MLV and 21 647 HIV integrations along target transcripts from the transcription start site (TSS) to the last nucleotide (end) on a normalized scale arbitrarily broken down in 50 bins. The black line indicates the distribution of 15 263 control random sites.
Retroviral integration clusters in the human genome. (A) Clustered distribution of 32 631 MLV and 28 382 HIV integration sites (ISs) in the genome of human CD34+ HPCs. The minimal requirement for cluster definition was 3 integrations within 12 587 bp for MLV and 14 460 bp for HIV, a threshold statistically associated to a false discovery rate of 0.01 in a control population of random sites of the same size (see supplemental Figure 3 for definition). (n) indicates the total number of clusters identified with this threshold. Clusters belonging to the upper 5% of the distribution, containing ≥ 15 integrations for both MLV and HIV, were named “hyperclusters.” (B) Density distribution plot of MLV and HIV clusters. Cluster density is defined as the average distance between integrations within a cluster, calculated by dividing the cluster size (in bp) by the number of integration sites contained in the cluster. (C) Distribution of MLV, HIV, and random integration sites with respect to Known Genes (UCSC definition). (D) Intragenic distribution of 16 342 MLV and 21 647 HIV integrations along target transcripts from the transcription start site (TSS) to the last nucleotide (end) on a normalized scale arbitrarily broken down in 50 bins. The black line indicates the distribution of 15 263 control random sites.
MLV integration sites cluster around promoters of active genes
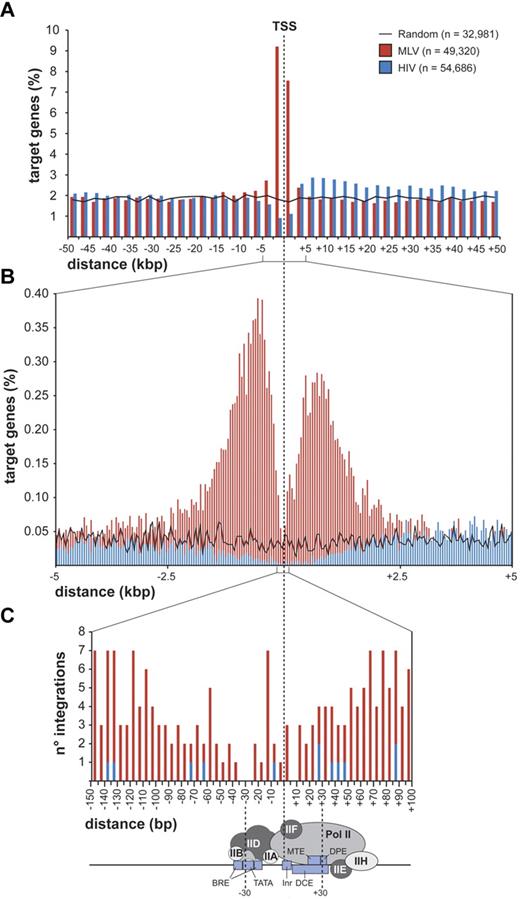
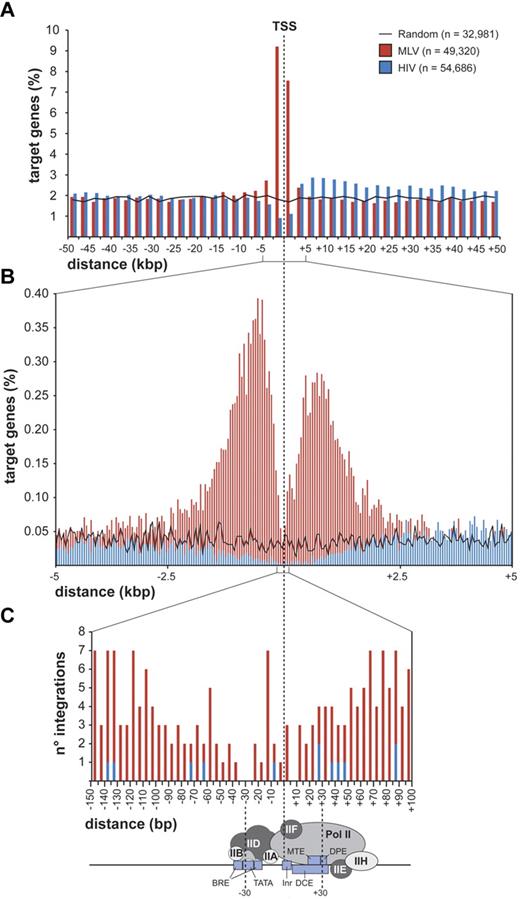
MLV integrations were equally distributed inside (49.4%) and outside (50.6%) genes, whereas 75.7% of the HIV integrations were within genes. Random sites essentially reflected the gene content of the human genome (Figure 1C). MLV integrations were enriched in the first 10% of a normalized gene length distribution, mirrored by underrepresentation of HIV integrations that were instead spread throughout gene bodies (Figure 1D). We annotated all genes (UCSC Known Gene track) having their TSS within 50 kb from each integration/random site in either directions (target genes) and plotted their relative distances in 2.5-kb intervals (Figure 2A). We found that 16.8% of the 49 320 MLV target genes hosted an integration around the TSS, compared with 3.5% of the 32 981 random and 2.0% of the 54 686 HIV target genes, respectively (2-sample test for equality of proportions with continuity correction, P < 10−15 for both comparisons). At 50-bp resolution, MLV sites clustered with a bimodal, asymmetric distribution that spanned ± 1.6 kb around the TSSs of the target genes and dropping in the ± 200-bp region (Figure 2B). HIV sites showed a mirror plot, with a significantly reduced frequency in the same region. At 10-bp resolution, little integration occurred in the −40- to +30-bp region and none in the −35 to −25 and +5 to +10 regions, suggesting occupancy of all MLV-targeted promoters by the basal transcriptional machinery (Figure 2C).
Distribution of retroviral integrations around transcription start sites. Distribution of the distance of MLV and HIV integration sites from the transcription start site (TSS) of targeted genes at 2500-bp (A), 50-bp (B), or 5-bp (C) resolution. The percentage of the total number of targeted genes (n) is plotted on the y-axis (A-B). The actual number of integrations is plotted on the y-axis (C). The black line (A) indicates the distribution of control random sites. A scheme of a classical core promoter engaged by the basal transcriptional machinery is shown in panel C (see Thomas and Chiang20 for details and abbreviations), to visualize the apparent correlation between absence of MLV integration and promoter occupancy by the TFIID complex.
Distribution of retroviral integrations around transcription start sites. Distribution of the distance of MLV and HIV integration sites from the transcription start site (TSS) of targeted genes at 2500-bp (A), 50-bp (B), or 5-bp (C) resolution. The percentage of the total number of targeted genes (n) is plotted on the y-axis (A-B). The actual number of integrations is plotted on the y-axis (C). The black line (A) indicates the distribution of control random sites. A scheme of a classical core promoter engaged by the basal transcriptional machinery is shown in panel C (see Thomas and Chiang20 for details and abbreviations), to visualize the apparent correlation between absence of MLV integration and promoter occupancy by the TFIID complex.
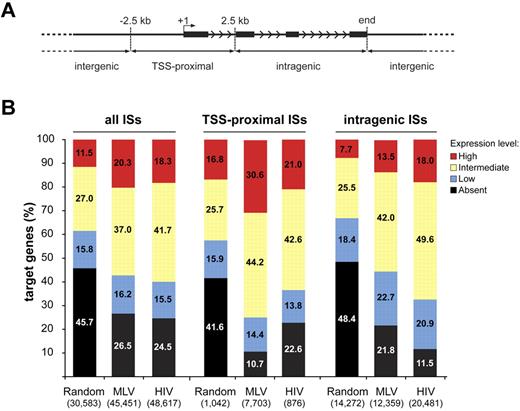
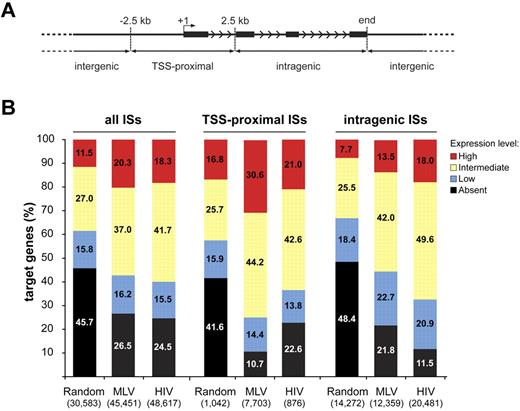
To explore this hypothesis, we determined the expression profile of > 18 900 genes in cytokine-stimulated HPCs. To ensure unequivocal probe-to-gene assignment, we reannotated the Affymetrix HG-U133 + 2.0 microarray probe sets with custom Chip Definition Files, to include only probes unequivocally matching a transcript. Target genes were divided into 3 classes, depending on whether an integration/random site was located ± 2.5 kb from the TSS (TSS-proximal), inside (intragenic), or outside (intergenic) the transcription unit (Figure 3A). Cumulatively, ∼ 75% of either MLV or HIV target genes were scored as active by Affymetrix analysis, compared with ∼ 55% of the randomly targeted genes (P < 10−15; Figure 3B left). Almost 90% of genes hosting an MLV TSS-proximal integration were active, with > 30% of the genes expressed at the highest level (Figure 3B middle). The bimodal distribution around the TSS was apparent for both active and inactive genes (not shown), suggesting promoter occupancy in all cases. Almost 90% of the genes hosting an HIV intragenic integration were active, compared with 78% and 52% of MLV and random targets (P < 10−15 for both comparisons; Figure 3B right).
Association between retroviral integration and gene activity in CD34+ hematopoietic progenitors. (A) MLV, HIV, and random integration sites were annotated as TSS-proximal when located at ± 2.5 kb from a TSS (+1), intragenic when inside a gene at > 2.5 kb from the TSS, and intergenic in any other case. Black bars represent exons of a prototype gene. Arrowheads indicate the direction of transcription. (B) Histogram distribution of expression values from an Affymetrix microarray (HG-U133 + 2.0) analysis of RNA obtained from cytokine-stimulated CD34+ cells. Affymetrix probe sets were reannotated with custom Chip Definition Files to obtain a single expression value for each gene. Expression levels were divided into 4 classes: absent, low (below the 25th percentile of the normalized distribution), intermediate (between the 25th and the 75th percentile), and high (above the 75th percentile). The percentage distribution of the expression values of genes targeted by all integration/random sites (all ISs), TSS-proximal sites (TSS-proximal ISs), and intragenic sites (intragenic ISs) are shown by the left, middle, or right group of bars, respectively. The number of genes belonging to each category is indicated in parentheses under the corresponding bar.
Association between retroviral integration and gene activity in CD34+ hematopoietic progenitors. (A) MLV, HIV, and random integration sites were annotated as TSS-proximal when located at ± 2.5 kb from a TSS (+1), intragenic when inside a gene at > 2.5 kb from the TSS, and intergenic in any other case. Black bars represent exons of a prototype gene. Arrowheads indicate the direction of transcription. (B) Histogram distribution of expression values from an Affymetrix microarray (HG-U133 + 2.0) analysis of RNA obtained from cytokine-stimulated CD34+ cells. Affymetrix probe sets were reannotated with custom Chip Definition Files to obtain a single expression value for each gene. Expression levels were divided into 4 classes: absent, low (below the 25th percentile of the normalized distribution), intermediate (between the 25th and the 75th percentile), and high (above the 75th percentile). The percentage distribution of the expression values of genes targeted by all integration/random sites (all ISs), TSS-proximal sites (TSS-proximal ISs), and intragenic sites (intragenic ISs) are shown by the left, middle, or right group of bars, respectively. The number of genes belonging to each category is indicated in parentheses under the corresponding bar.
MLV integration targets evolutionarily conserved noncoding elements and TFBSs
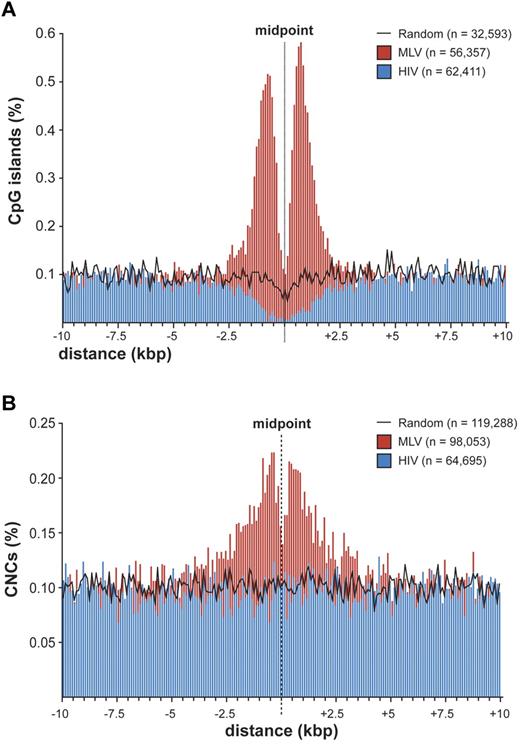
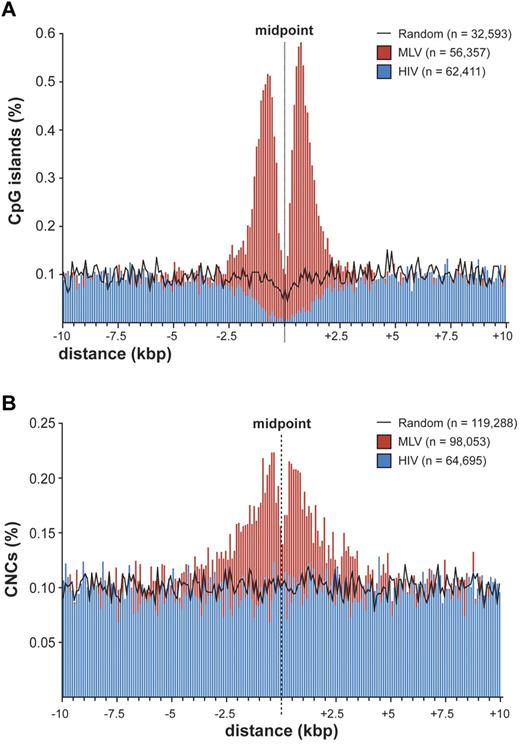
To explore the possibility that MLV integration is directed to regulatory regions different from promoters, we evaluated the association between integration/random sites and cell context-independent annotations identifying putative regulatory regions in the genome, such as CpG islands,21 mammalian CNCs,16 and conserved TFBSs (supplemental Table 2). A strong association was observed between MLV sites and CpG islands, with 22.5% (7345) of the sites located within ± 2.5 kb from ≥ 1 CpG island, compared with 4.1% of HIV and 3.3% of random sites. A high-resolution plot of the distance between CpG islands and MLV integration sites (Figure 4A) showed the same bimodal distribution observed at promoters (Figure 2B), where the CpG island midpoint replaces the TSS. However, almost 80% of these CpG islands overlap a TSS-proximal region, and the bimodal distribution disappeared when considering only intergenic and intragenic integrations (supplemental Figure 4). CpG islands associated to random sites showed the expected distribution for the human genome,22,23 that is, 50% TSS-proximal, 21.6% intragenic, and 27.3% intergenic.
Distribution of retroviral integrations around CpG islands and conserved noncoding sequences. (A) Distribution of the distance of MLV and HIV integration sites from the midpoint of CpG islands at 100-bp resolution. The percentage of the total number of CpG islands (n) is plotted on the y-axis. The black line indicates the distribution of control random sites. (B) Distribution of the distance of MLV and HIV integration sites from the midpoint of mammalian evolutionarily conserved noncoding sequences (CNCs) at 100-bp resolution. The percentage of the total number of CNCs (n) is plotted on the y-axis. The black line indicates the distribution of control random sites.
Distribution of retroviral integrations around CpG islands and conserved noncoding sequences. (A) Distribution of the distance of MLV and HIV integration sites from the midpoint of CpG islands at 100-bp resolution. The percentage of the total number of CpG islands (n) is plotted on the y-axis. The black line indicates the distribution of control random sites. (B) Distribution of the distance of MLV and HIV integration sites from the midpoint of mammalian evolutionarily conserved noncoding sequences (CNCs) at 100-bp resolution. The percentage of the total number of CNCs (n) is plotted on the y-axis. The black line indicates the distribution of control random sites.
CNCs showed a significant overrepresentation at ± 2.5 kb from MLV integrations compared with random sites (17.7% vs 12.4%; P < 10−15) and a significant underrepresentation around HIV sites (8.6%; P < 10−15). The distance of MLV sites from CNCs showed a bimodal distribution around the CNC midpoint (Figure 4B). CNCs were enriched around TSS-proximal, intragenic, and intergenic sites (supplemental Table 2), indicating that chromatin containing these elements is per se attractive for MLV integration.
Evolutionarily conserved TFBSs were significantly overrepresented within ± 1.0 kb from MLV sites (65.7% of the sequences contained ≥ 1 TFBS vs 44.6% for random sites; P < 10−15) and much less around HIV sites (48.8%). As many as 48 of 258 binding motifs were enriched > 2-fold in the 2-kb window around MLV sites compared with random controls. Among these, 10 motifs were enriched > 5-fold, including those for Sp1, AP2, Ets, NFY, Elk, Myc/Max, Myb, CCAAT/enhancer binding protein, and the STAT family (supplemental Table 3). Only one motif was enriched > 2-folds around HIV integrations.
Regulatory regions actively engaged in transcription are targeted by MLV integration
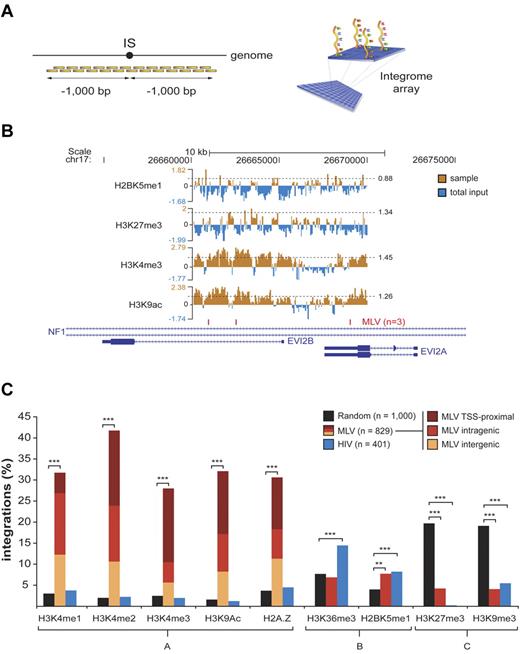
To probe the transcriptional activity of promoters and regulatory regions targeted by MLV, we mapped epigenetic histone modifications by a ChIP-on-chip approach. We designed custom “integrome” chips consisting of tiled oligonucleotides (50-60mers) covering 1 kb of genomic sequence upstream and downstream of 879 MLV, 401 HIV, and 1000 random sites (Figure 5A). To analyze cells at the same stage as those infected by the vectors, chromatin was obtained from HPCs stimulated with cytokines for 72 hours, immunoprecipitated with antibodies recognizing specific histone modifications, and hybridized to the chip. Results for a representative genomic locus (NF1/EVI2A/B) are shown in Figure 5B. Peaks of H3K4me1, H3K4me2, H3K4me3, and H3K9ac and binding of the H2A.Z histone variant were preferentially associated to MLV integrations, with 28.0%-41.7% of the sequences having ≥ 1 peak in the ± 1-kb region, compared with 1.6%-3.7% and 1.3%-4.5% of random and HIV integration sites, respectively (group A in Figure 5C). One hundred thirty-four of 346 (39%) of the MLV target sequences marked by ≥ 1 peak of H3K4me2 did not carry an H3K4me3 mark (not shown). These signatures were found around TSS-proximal, intragenic, and intergenic insertions (Figure 5C). Conversely, histone modifications marking active transcription units (H3K36me3 and H2BK5me1, group B in Figure 5C) were poorly associated to MLV integration (6.9% and 7.7%, respectively, vs 7.7% and 4.0% of random controls) and slightly enriched around HIV sites (14.5% and 8.2%, respectively). Histone modifications characteristic of silent and heterochromatic loci (H3K27me3 and H3K9me3, group C in Figure 5C) were selectively depleted in genomic regions flanking both MLV and HIV sites (∼ 4% and 0.25%-5.5%, respectively, vs > 19% of random sites). Thirteen of the 35 (37.1%) MLV target sequences carrying the H3K27me3 modification also carried the H3K4me3 mark (not shown).
Association between histone modifications and retroviral integrations in CD34+ HPCs. Histone modifications around (± 1000 bp) a subset of retroviral and random integration sites (ISs) were evaluated by ChIP-on-chip technology. (A) Chromatin immunoprecipitated from cytokine-stimulated CD34+ HPCs was amplified, fluorescently labeled, and hybridized to custom-designed “integrome” arrays, where we spotted tiled oligonucleotides (50-60mers) covering 1000 bp upstream and downstream of each insertion site. (B) For each experiment, chromatin immunoprecipitated with the antibody of interest (sample) was cohybridized with an equal amount of chromatin immunoprecipitated with agarose beads only and labeled with a different fluorophore (total input). ChIP peaks were statistically defined starting from sample-to-input raw signal ratios (the threshold for peak definition, set at the 95th percentile of the dataset distribution, is specified for each sample, and indicated by a dashed horizontal line). A representative output of ChIP-on-chip experiments is given for a subset of antibodies (against H2BK5me1, H3K27me3, H3K4me3, and H3K9ac) around 3 MLV integration sites targeting the NF1/EVI2A/B locus on chromosome 17. (C) Percentage of MLV, HIV, and random ISs with ≥ 1 peak of the specified histone modifications in the flanking ± 1-kb region. Epigenetic marks are grouped according to the genomic region they are classically associated to (group A, enhancers and promoters of active genes; group B, promoters and gene bodies of actively transcribed genes; group C, inactive genes and heterochromatic regions). Burgundy, red, and yellow sections inside group-A MLV bars indicate the relative proportion of TSS-proximal, intragenic, and intergenic integrations to the observed enrichment. Asterisks denote the level of overrepresentation or underrepresentation of MLV and HIV ISs with respect to random sites: **P < .005, ***P < .0005 by 2-sample test for equality of proportions with continuity correction.
Association between histone modifications and retroviral integrations in CD34+ HPCs. Histone modifications around (± 1000 bp) a subset of retroviral and random integration sites (ISs) were evaluated by ChIP-on-chip technology. (A) Chromatin immunoprecipitated from cytokine-stimulated CD34+ HPCs was amplified, fluorescently labeled, and hybridized to custom-designed “integrome” arrays, where we spotted tiled oligonucleotides (50-60mers) covering 1000 bp upstream and downstream of each insertion site. (B) For each experiment, chromatin immunoprecipitated with the antibody of interest (sample) was cohybridized with an equal amount of chromatin immunoprecipitated with agarose beads only and labeled with a different fluorophore (total input). ChIP peaks were statistically defined starting from sample-to-input raw signal ratios (the threshold for peak definition, set at the 95th percentile of the dataset distribution, is specified for each sample, and indicated by a dashed horizontal line). A representative output of ChIP-on-chip experiments is given for a subset of antibodies (against H2BK5me1, H3K27me3, H3K4me3, and H3K9ac) around 3 MLV integration sites targeting the NF1/EVI2A/B locus on chromosome 17. (C) Percentage of MLV, HIV, and random ISs with ≥ 1 peak of the specified histone modifications in the flanking ± 1-kb region. Epigenetic marks are grouped according to the genomic region they are classically associated to (group A, enhancers and promoters of active genes; group B, promoters and gene bodies of actively transcribed genes; group C, inactive genes and heterochromatic regions). Burgundy, red, and yellow sections inside group-A MLV bars indicate the relative proportion of TSS-proximal, intragenic, and intergenic integrations to the observed enrichment. Asterisks denote the level of overrepresentation or underrepresentation of MLV and HIV ISs with respect to random sites: **P < .005, ***P < .0005 by 2-sample test for equality of proportions with continuity correction.
We then used a computational approach to associate the entire MLV integration dataset to epigenetic signatures mapped genomewide in CD34+/CD133+ HPCs by ChIP sequencing.24 MLV integrations were strongly associated to H3K4me1, H3K4me3, and Pol II and H2A.Z binding, whereas HIV integrations were specifically associated to H3K36me3 (supplemental Figure 5). Again, H3K9me3 and H3K27me3 modifications were underrepresented around both MLV and HIV integrations.
MLV integration clusters target genes controlling hematopoietic functions
We further analyzed clusters made by ≥ 15 integration sites, corresponding to the 95th percentile of the MLV and HIV cluster distribution (“hyperclusters”; Figure 1A). MLV and HIV hyperclusters contained a comparable 12.1% (3955) and 12.6% (3565) of the total integration sites, targeting 166 genes (supplemental Table 4) and 103 genes, respectively. As controls, we used 197 genes randomly sampled among the targets of the random sites. A GO classification of MLV targets showed a moderate overrepresentation of genes involved in the regulation of biologic processes and intracellular signaling cascades (.005 < P < .05, Fisher exact test with Bonferroni correction for multiple testing). HIV targets were enriched in chromatin organization/remodeling genes and/or transcriptional regulators (P < 10−13; supplemental Table 5). An Ingenuity analysis showed that genes involved in hematologic, immunologic, or inflammatory diseases were significantly enriched among MLV hypercluster targets (10−6 < P < .01; supplemental Figure 6), whereas transcriptional regulation was the only category enriched among HIV targets (P < .001). A functional network analysis showed that 27 of 166 MLV target genes are functionally linked in networks involved in the hematopoietic system development and function (eg, HOXA9, HOXA7, BCL2 and RUNX1; supplemental Figure 7). Instead, 20 of 103 HIV targets control nuclear organization and DNA replication, recombination, and repair, in agreement with the GO analysis. We could detect direct/indirect interaction for only 3 of 197 random targets (not shown), indicating a low background noise for the network analysis. Housekeeping genes (defined in supplemental Methods) accounted for 8.0% of the expressed genes targeted by MLV hyperclusters and 11.5% of those targeted by all clusters versus 11.0% of the random target genes (P < 10−6 and > .1, respectively), indicating that they are not preferentially targeted by MLV despite 85% of them are expressed in HPCs (not shown).
MLV integration clusters identify regulatory regions, alternative promoters, and miRNAs transcriptionally active in HPCs
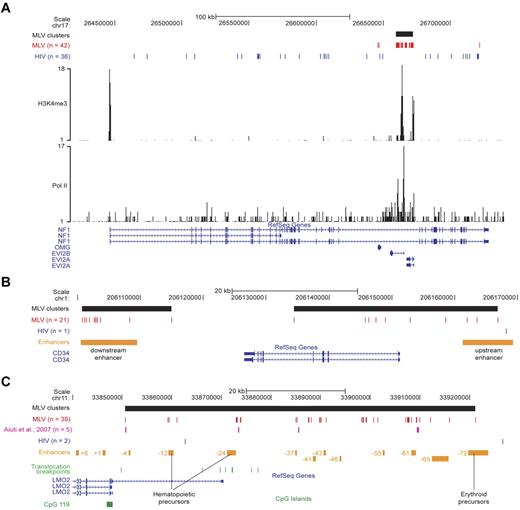
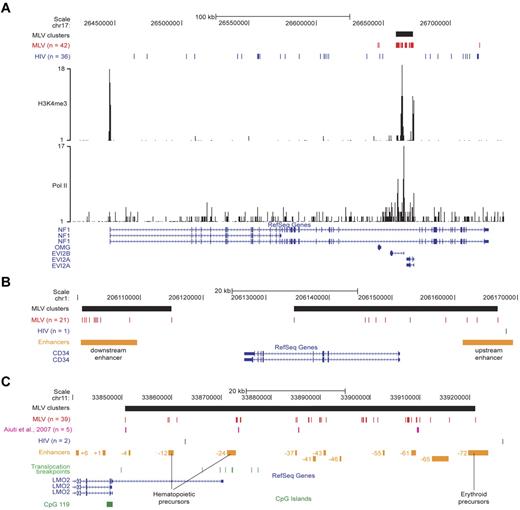
To validate the concept that MLV targets transcriptional regulatory regions, we analyzed in detail single loci targeted by MLV clusters. In the NF1/EVI2A/B locus, 39 MLV integrations are packed in a single cluster spanning ∼ 13 kb in the intron 36 of the NF1 gene, marked by peaks of H3K4me3 and Pol II binding and overlapping the EVI2A and EVI2B promoters. A comparable number (36) of HIV site were instead scattered throughout the NF1 gene, excluding the MLV cluster (Figure 6A).
Single-locus analysis of retroviral integration sites in the genome of CD34+ HPCs. (A) The NF1/EVI2A/B locus. Distribution of MLV (red) and HIV (blue) integrations, and of the MLV integration cluster (black box) along the locus as displayed by the UCSC Genome Browser. The base position feature on the top (scale bar and chromosome number) identifies the genomic coordinates of the displayed region. H3K4me3 and Pol II tracks are those determined by ChIP sequencing in the genome of human CD34+/CD133+ HPCs.24 The RefSeq Genes track shows known human protein-coding and noncoding transcripts taken from the National Center for Biotechnology Information RNA reference sequences collection. (n) indicates the total number of integration sites retrieved in the displayed region. (B) The CD34 locus. MLV and HIV integration sites and clusters are displayed on the locus as described in panel A. The upstream and downstream enhancers (orange boxes) were previously described as critical for CD34 gene expression in vivo.25 (C) The LMO2 locus. MLV and HIV integration sites and clusters are displayed on the locus as described in panel A. The array of upstream enhancers (orange boxes) we reported to cooperate with the distal promoter in regulating LMO2 expression.26 Translocation breakpoints associated to T-cell leukemia are indicated with green bars and were retrieved from the TICdb database of translocation breakpoints in cancer.27 Integrations sites detected in peripheral blood cells of patients with adenosine deaminase–deficient SCID28 are indicated in purple. A CpG island (CpG 119; green box) marking the nonhematopoietic proximal promoter is also shown.
Single-locus analysis of retroviral integration sites in the genome of CD34+ HPCs. (A) The NF1/EVI2A/B locus. Distribution of MLV (red) and HIV (blue) integrations, and of the MLV integration cluster (black box) along the locus as displayed by the UCSC Genome Browser. The base position feature on the top (scale bar and chromosome number) identifies the genomic coordinates of the displayed region. H3K4me3 and Pol II tracks are those determined by ChIP sequencing in the genome of human CD34+/CD133+ HPCs.24 The RefSeq Genes track shows known human protein-coding and noncoding transcripts taken from the National Center for Biotechnology Information RNA reference sequences collection. (n) indicates the total number of integration sites retrieved in the displayed region. (B) The CD34 locus. MLV and HIV integration sites and clusters are displayed on the locus as described in panel A. The upstream and downstream enhancers (orange boxes) were previously described as critical for CD34 gene expression in vivo.25 (C) The LMO2 locus. MLV and HIV integration sites and clusters are displayed on the locus as described in panel A. The array of upstream enhancers (orange boxes) we reported to cooperate with the distal promoter in regulating LMO2 expression.26 Translocation breakpoints associated to T-cell leukemia are indicated with green bars and were retrieved from the TICdb database of translocation breakpoints in cancer.27 Integrations sites detected in peripheral blood cells of patients with adenosine deaminase–deficient SCID28 are indicated in purple. A CpG island (CpG 119; green box) marking the nonhematopoietic proximal promoter is also shown.
In the CD34 gene, 2 clusters of 11 and 10 MLV integrations overlapped the promoter/upstream enhancer and a downstream enhancer functionally defined in transgenic mice.25 The entire locus was targeted by a single HIV integration (Figure 6B).
The LMO2 gene encodes a transcriptional cofactor crucial for HPC development and differentiation, and it is driven by a proximal promoter and several upstream enhancers spanning ∼ 100 kb.26 A large hypercluster (39 integrations) overlapped the entire regulatory region and marked 2 HPC-specific enhancers (−12 and −24) and several of the distal regions, including the −61 element predicted to have hematopoietic-specific activity26 (Figure 6C). The MLV integrations identified in peripheral blood cells of patients with adenosine deaminase–deficient SCID28 map in the same subclusters (Figure 6C).
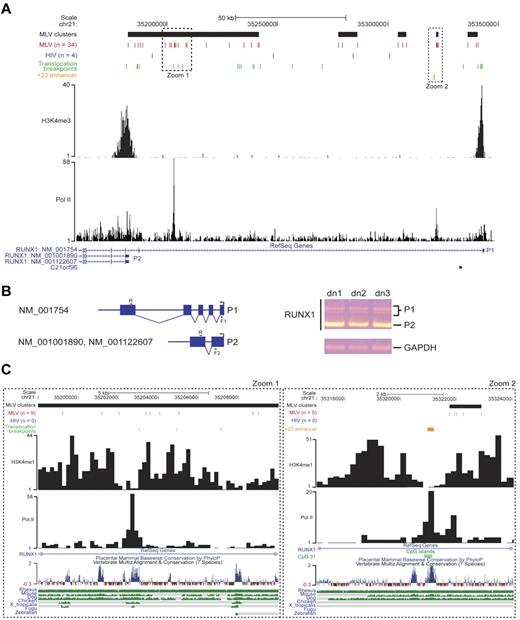
The RUNX1/AML1 gene encodes a pivotal regulator of hematopoiesis driven by 2 alternative, developmentally regulated promoters29 marked by H3K4me3 in human HPCs.24 The promoters and the first intron of the longest isoform (NM_001754) were targeted by 34 MLV integrations grouped in 5 clusters overlapping most of the translocation breakpoints identified in human leukemias (Figure 7A). The hypercluster upstream of the P2 promoter predicts its main role in human HPCs, confirmed by a reverse transcription PCR analysis of the alternative transcript expression (Figure 7B). A tight cluster of 5 integrations mapped 500 bp upstream of a highly conserved, 531-bp enhancer (+23 enhancer in Figure 7) described in both murine and human genomes30 and overlapping a CpG island in a histone-free CNC flanked by H3K4me1 peaks (Figure 7C zoom 2). A peak of Pol II binding suggests an active transcriptional loop between P1 and the +23 enhancer. A similar scenario was found few kilobases upstream of P2 (Figure 7C zoom 1), where 9 MLV insertions marked either sides of a highly conserved, Pol II-bound region flanked by H3K4me1 histones, possibly representing a yet uncharacterized distal element controlling P2 transcription.
Analysis of retroviral integration sites in the RUNX1 locus. (A) MLV and HIV integration sites and clusters are displayed on the locus as described in the legend of Figure 6A. Translocation breakpoints associated to hematopoietic malignancies are indicated with green bars and were retrieved from the TICdb database of translocation breakpoints in cancer.27 The +23 enhancer (orange bar) was functionally defined in the murine and human genome.30 The H3K4me3 track is that determined by ChIP sequencing in the genome of human CD34+/CD133+ HPCs.24 P1 and P2 indicate the distal and the proximal RUNX1 promoters. (B) Schematic representation (left) and experimental results (right) of a reverse transcription PCR on RNA samples retrotranscribed from CD34+ cells from 3 different donors (dn1-dn3). R (5′-CGACAAACCTGAGGTCATT-3′) and F1 (5′-AGCCTGGCAGTGTCAGAAGT-3′) primers identify the longest RUNX1 isoform (NM_001754) together with its splicing variants, indicated by multiple bands (P1) on the agarose gel. The R and F2 (5′-GAGCTGCTTGCTGAAGATCC-3′) primers specifically amplify the P2 transcript. The RNA of the housekeeping glyceraldehyde-3-phosphate dehydrogenase gene (GAPDH) was amplified as a positive control. (C) Zoom-in of the 2 regions of the RUNX1 locus indicated by dotted squares in panel A. H3K4me3 and Pol II tracks are those determined by ChIP sequencing in the genome of human CD34+/CD133+ HPCs.24 A CpG island (CpG 31; green box), marking the +23 enhancer (orange box), is also indicated. The UCSC conservation track at the bottom shows multiple alignments and measurements of evolutionary conservation among all placental mammals and between 7 selected vertebrates (rhesus monkey, mouse, dog, chicken, Xenopus tropicalis, Fugu, and zebrafish; green bars).
Analysis of retroviral integration sites in the RUNX1 locus. (A) MLV and HIV integration sites and clusters are displayed on the locus as described in the legend of Figure 6A. Translocation breakpoints associated to hematopoietic malignancies are indicated with green bars and were retrieved from the TICdb database of translocation breakpoints in cancer.27 The +23 enhancer (orange bar) was functionally defined in the murine and human genome.30 The H3K4me3 track is that determined by ChIP sequencing in the genome of human CD34+/CD133+ HPCs.24 P1 and P2 indicate the distal and the proximal RUNX1 promoters. (B) Schematic representation (left) and experimental results (right) of a reverse transcription PCR on RNA samples retrotranscribed from CD34+ cells from 3 different donors (dn1-dn3). R (5′-CGACAAACCTGAGGTCATT-3′) and F1 (5′-AGCCTGGCAGTGTCAGAAGT-3′) primers identify the longest RUNX1 isoform (NM_001754) together with its splicing variants, indicated by multiple bands (P1) on the agarose gel. The R and F2 (5′-GAGCTGCTTGCTGAAGATCC-3′) primers specifically amplify the P2 transcript. The RNA of the housekeeping glyceraldehyde-3-phosphate dehydrogenase gene (GAPDH) was amplified as a positive control. (C) Zoom-in of the 2 regions of the RUNX1 locus indicated by dotted squares in panel A. H3K4me3 and Pol II tracks are those determined by ChIP sequencing in the genome of human CD34+/CD133+ HPCs.24 A CpG island (CpG 31; green box), marking the +23 enhancer (orange box), is also indicated. The UCSC conservation track at the bottom shows multiple alignments and measurements of evolutionary conservation among all placental mammals and between 7 selected vertebrates (rhesus monkey, mouse, dog, chicken, Xenopus tropicalis, Fugu, and zebrafish; green bars).
The EVI1/MDS1 locus encodes transcription factors involved in leukemogenesis when activated by retroviral insertion or fusion to RUNX1 in mice and humans.31 Two MLV clusters targeted the H3K4me3-labeled EVI1 promoter and an H3K4me1-marked, highly conserved region in an MDS1 intron (supplemental Figure 8A). These clusters coincide with most of the MLV insertions that caused myeloid clonal expansion in patients with CGD,3 and most likely represent crucial regulatory regions for the EVI1 gene.
The ETS family transcription factor ELF1 regulates the expression of pivotal genes in hematopoiesis, such as SCL/TAL1, FLI1, LYL1, RUNX1, and LMO2. Comparative genomics and ChIP-to-chip analysis of the murine Elf1 locus showed a differential activity of a proximal and a distal, −21 promoter in myeloid versus lymphoid cells and identified a lineage-specific, −14 intronic enhancer.32 The SPI1/PU.1 transcription factor binds both the −21 and −14 elements.32 We found a single MLV cluster overlapping the human homologue of the −21 element, marked by a Pol II peak and flanked by H3K4me1 peaks, as observed in the RUNX1 + 23 enhancer, suggesting an active role of this element in human HPCs (supplemental Figure 8B).
MLV integrations did not exclusively target protein-coding genes. Supplemental Figure 8C shows the DQ680071 precursor of miR-223, a hematopoietic-specific miRNA expressed in murine pluripotent and common myeloid progenitors, and up-regulated during granulocytic differentiation.33 H3K4me3 and Pol II binding are consistent with transcription of this locus in human HPCs. Two contradictory reports identified cis-regulatory elements close to the DQ680071 TSS.34,35 We found an 18-integration MLV hypercluster spanning 27 kb upstream of the TSS, suggesting the existence of additional regulatory elements controlling the lineage-specific expression of miR-223.
A genomewide, ChIP-seq study described the transcriptional program controlled by the Scl/Tal1 transcription factor in murine early embryonic hematopoiesis. The study identified 228 binding sites and characterized those located in 11 loci encoding transcription factors controlling hematopoietic development.36 Seven of the human homologous loci are expressed in HPCs (CBFA-2T3, MYB, ERG, GFI1B, MAFK, NFE2, and RUNX2), and in 5 of them we found MLV integration clusters colocalizing with at least one of the mapped Scl binding peaks. Two examples are shown in supplemental Figure 9. In the RUNX2 locus, 2 clusters overlapped the H3K4me3-labeled distal promoter and a Scl binding site marked by peaks of H3K4me1 and Pol II (supplemental Figure 9A). At the NFE2 locus, a single hypercluster encompassed the active, H3K4me3-labeled distal promoter and a Scl binding site again marked by peaks of H3K4me1 and Pol II (supplemental Figure 9B). A comprehensive analysis of the 228 Scl binding sites showed that 104 of 228 peaks (45.6%) were assigned to genes also targeted by MLV clusters, but in most cases the poor sequence homology impaired direct identification of binding sites on the human genome.
Discussion
A high-definition map of MLV integration sites in the genome of human HPCs showed a clustered distribution around TSSs and CNCs and in regions enriched in TFBSs with putative regulatory function. The statistical definition of an integration cluster was a critical aspect of the study. We abandoned the classical definition of “common integration site,” originally developed to define integration-associated oncogenes,37 and adopted a new definition statistically modeled on the size of the dataset. Our procedure entails a variable threshold for cluster definition, proportional to the total number of integration sites and based on a predetermined false-discovery rate, allowing direct comparison between datasets of different size. Applied to > 32 000 MLV integration sites, the procedure identified > 3500 clusters containing 3 to > 30 sites each, which overlapped or flanked promoters and regulatory elements of genes active or poised for transcription in human HPCs. Functional clustering analysis indicates that genes targeted by the densest MLV clusters are regulated during HPC development/differentiation and play a role in the establishment and maintenance of hematopoietic cell identity, whereas housekeeping genes are targeted at lower than random frequency. MLV clusters overlap with experimentally validated alternative promoters and proximal and distal enhancers of key hematopoietic genes (AML1/RUNX1, LMO2, EVI1/MDS1, RUNX2, NFE2, and ELF1) and identify other, yet undefined elements with putative regulatory functions in these and other loci.
The tendency of MLV to integrate close to gene promoters was already known.10 Fine mapping of MLV sites around the TSS of > 8000 genes showed a bimodal distribution, with virtually no insertions in the −38 to +34 region, where the general transcription factors contact the core promoter and recruit Pol II.20 In particular, no integration was detected in the −35 to −25 and +5 to +10 regions, corresponding to the TATA-box and the first component of the tripartite downstream core promoter element. This indicates that basal transcription factors, most likely TFIID, occupy the promoter of all targeted genes and makes it physically inaccessible to retroviral PICs. The promoters of inactive genes are also protected from MLV integration, suggesting that they are poised for transcription although not transcribed at the time of analysis. A bimodal distribution was observed around CNCs, which are often predictive of cis-regulatory modules,38,39 suggesting that the subset of CNCs targeted by MLV is also occupied by DNA-binding complexes. A similar distribution was also observed around CpG islands, already reported as favored by MLV integration.14 However, 80% of MLV insertions near CpG islands were at close distance also from a TSS, whereas CpG islands away from promoters were not targeted. CpG islands are therefore not attractive per se for MLV PICs, but only as a consequence of their overrepresentation in promoter regions.22
The transcriptionally active state of most of the regions targeted by MLV was indicated by a ChIP-on-chip analysis of histone modifications in a ± 1.0-kb region around a subset of the integration sites and a computational association with epigenetic signatures mapped genomewide in CD34+/CD133+ HPCs by ChIP sequencing.24 Epigenetic marks of active promoters and enhancers (H3K4me1, H3K4me2, H3K4me3, H3K9ac, and Pol II binding) were highly enriched around MLV sites, whereas those associated to the body of transcribed genes (H3K36me3 and H2BK5me1) or to heterochromatic and inactive regions (H3K27me3 and H3K9me3) were not enriched or underrepresented compared with random control sites. These associations were not limited to integrations around promoter regions but were present at comparable frequency also in intragenic and intergenic sites, indicating that MLV PICs are targeted to all active regulatory regions and not simply to promoters. This was particularly evident in the case of the H3K4me1 modification, an epigenetic mark strongly associated with cell-specific enhancers40 that was mainly enriched around nonpromotorial integration sites. Interestingly, one-third of the few MLV target regions marked by the H3K27me3 modification carried also an H3K4me3 mark, a “bivalent” chromatin signature characteristic of genes regulated during development and differentiation of stem/progenitor cells.24,41 In addition, 40% of the target sequences marked by the H3K4me2 did not carry an H3K4me3 mark, a signature associated to regulatory elements of genes poised for transcription in hematopoietic progenitors.42
Two of the epigenetic signatures associated to MLV clusters, ie, H3K4me1 and Pol II binding, are typical of transcribed, “activity-regulated” enhancers bound by the CBP transcription factor.43 In addition, we found a strong association between MLV integration and H2AZ, a histone variant enriched at targets of the Polycomb complex that establishes specialized chromatin domains and plays a crucial role in the regulation of lineage commitment and differentiation.44 Enrichment of H2AZ is equally frequent around TSS-proximal, intergenic, and intragenic integrations, again indicating that MLV PICs are attracted to regions marked by specific epigenetic modifications independently from their promoter nature. We may speculate that protein complexes bound to these types of elements mediate tethering of MLV PICs more efficiently than other transcriptional complexes, thus explaining the observed biases in the function of the MLV target genes and the low preference for housekeeping genes. Conserved TFBSs flanking MLV integrations are significantly enriched in binding motifs for transcription factors controlling hematopoietic-specific programs, supporting the concept that MLV PICs are specifically tethered to chromatin regions engaged in the transcription of highly regulated genes.
A variety of high-throughput approaches have been used to define regulatory regions in hematopoietic cells, using nuclease accessibility45 or histone modifications24,46,47 as surrogate markers of transcriptional activity. These studies identified epigenetic signatures characteristic of active or repressed genes and genes in a bivalent or poised state activated during development or differentiation.24,42 Distinct signatures also mark enhancers and promoters of lineage-specific genes, providing important clues for the identification of regulatory regions involved in the control of differentiation.24 High-density MLV integration maps may provide an alternative resource for the identification of regulatory elements controlling stem and progenitor cell functions, with the unique advantage of not requiring prospective isolation of target cells. MLV vectors can transduce rare stem/progenitor cells within mixed populations and permanently label regulatory regions that can be then retrospectively identified in the DNA of a specific progeny.
The preference of MLV for regulatory elements was not shared by HIV. Although similarly clustered, HIV integrations appear to avoid promoters and regulatory elements and prefer instead transcribed regions marked by H3K36me3 and H2BK5me1. These differences have interesting implications in terms of viral evolution. γ-Retroviruses may have evolved a mechanism coupling target site selection to gene regulation to activate or maintain their proviral expression. Integration of a viral enhancer in the proximity of cell-specific growth regulators increases the chance of clonal expansion or transformation by insertional gene activation and ultimately favors viral propagation. Lentiviruses have apparently evolved a different strategy, to target open chromatin regions while minimizing interference with the cell transcriptional machinery. This may favor maintenance of a virus-driven, tight transcriptional regulation and be more permissive for the latent phase of the lentiviral life cycle. These differences have an obvious effect on the safety of gene transfer vectors for clinical applications. The MLV tropism for regulatory regions increases the chances of gene deregulation by enhancer elements carried by the vector, whereas the HIV preference for introns may increase the probability of deregulation by posttranscriptional mechanisms such as alternative splicing or premature polyadenylation. Several loci are targeted at a particularly high frequency by MLV: 12% of the total integration sites hit just 166 loci, with potentially “dangerous” genes such as LMO2 or RUNX1 targeted at a frequency of > 1:1000. Other loci, such as EVI1/MDS1, are targeted at a relatively lower frequency (< 1:3200) that is however high enough to allow rapid clonal selection of cells in which integration causes locus deregulation.3 The value of high-definition integration site maps in gene therapy is in providing expected targeting frequencies for gene loci and for specific elements within each locus. To avoid any bias induced by cell culture,48 integration maps should be obtained as soon as possible after transduction. Comparing these frequencies with those observed ex vivo in follow-up studies allows a more robust definition of clonal imbalance and a more accurate prediction of adverse events caused by premalignant expansion of cells carrying gene deregulating insertions.
The online version of this article contains a data supplement.
The publication costs of this article were defrayed in part by page charge payment. Therefore, and solely to indicate this fact, this article is hereby marked “advertisement” in accordance with 18 USC section 1734.
Acknowledgments
We thank Ivan Dellino and Matteo Cesaroni for their help in the ChIP-on-chip analysis.
This work was supported by grants from the European Commission (PERSIST), Telethon (GGP06101), the Regione Emilia-Romagna, and the Italian Ministry of Research and Education (FIRB NG-Lab RBLA03ER38).
Authorship
Contribution: C.C., G.D.B., and F. Mavilio designed the research and wrote the paper; C.C, E.R., G.M., G.C., F. Miselli, and D.S. performed research and analyzed data; and D.P., A.G., A.A., and C.D.S. designed and performed the bioinformatic analysis.
Conflict-of-interest disclosure: The authors declare no competing financial interests.
The current affiliation for A.G. is Genomnia srl, Lainate, Italy.
Correspondence: Fulvio Mavilio, Center for Regenerative Medicine, University of Modena and Reggio Emilia, Via Gottardi 100, 41125 Modena, Italy; e-mail: fulvio.mavilio@unimore.it.

