Abstract
Hematopoietic stem cell (HSC) niches have been reported at the endosteum or adjacent to bone marrow (BM) vasculature. To investigate functional attributes of these niches, mice were perfused with Hoechst 33342 (Ho) in vivo before BM cell collection in presence of pump inhibitors and antibody stained. We report that the position of phenotypic HSCs, multipotent and myeloid progenitors relative to blood flow, follows a hierarchy reflecting differentiation stage, whereas mesenchymal stromal cells are perivascular. Furthermore, during granulocyte colony-stimulating factor–induced mobilization, HSCs migrated closer to blood flow, whereas stromal cells did not. Interestingly, phenotypic Lin−Sca1+KIT+CD41−CD48−CD150+ HSCs segregated into 2 groups (Honeg or Homed), based on degree of blood/Ho perfusion of their niche. HSCs capable of serial transplantation and long-term bromodeoxyuridine label retention were enriched in Honeg HSCs, whereas Homed HSCs cycled more frequently and only reconstituted a single host. This suggests that the most potent HSC niches are enriched in locally secreted factors and low oxygen tension due to negligible blood flow. Importantly, blood perfusion of niches correlates better with HSC function than absolute distance from vasculature. This technique enables prospective isolation of serially reconstituting HSCs distinct from other less potent HSCs of the same phenotype, based on the in vivo niche in which they reside.
Introduction
Hematopoietic stem cells (HSCs) and lineage-restricted progenitor cells (HPCs) localize in specific microdomains termed “niches” according to their differentiation stage. These specific microenvironments play a critical role in controlling HSC and HPC fate and regulate whether they remain quiescent, self-renew, differentiate, or apoptose.1-3
HSC niches are preferentially located near the endosteum, the interface between bone marrow (BM) and bone,4-6 or on the abluminal side of endothelial sinuses.7,8 Studies that used 3-dimensional live microscopy of long bones recovered from mice that received a transplant with purified labeled HSCs have shown that (1) quiescent long-term reconstituting HSCs preferentially lodge within 2 cell diameters, or on average 10 μm, from the interface with the compact bone, near osteoblasts and their precursors,5,9 and (2) quiescent HSCs are found closer to the endosteum than are actively dividing HSCs.6,10 Functional studies that used transgenic mice with increased osteoblast function11,12 showed increased HSC content in the BM, suggesting that osteoblasts or their precursors support and maintain HSCs in the BM in vivo. Similarly, targeted ablation of osteoblasts in vivo results in loss of HSCs from the BM.13 Thus, it appears that the endosteal region provides a unique environment necessary for HSC survival, self-renewal, and contribution to long-term hematopoiesis and contact with or near osteoblast lineage cells is an essential component of these endosteal niches.
In situ microscopy to observe the location of HSCs in unmanipulated mice has proven to be challenging because multicolor labeling is needed to identify HSCs. Lin−Sca-1+KIT+ (LSK) cells have been observed both at the endosteum near osteoblasts in naive mice that did not receive a transplant8,14 and against sinusoid endothelial cells.8 Similarly, phenotypic long-term reconstituting HSCs (Lin−CD41−CD48−CD150+) have been reported on the abluminal side of BM vasculature.7
Whether these 2 HSC niches are functionally different or overlap is unknown and remains hotly debated, in part because the endosteum is often in close range to endothelial sinuses.3,5,6 It has been proposed that vascular niches, which are perfused in nutrients and oxygen by sinusoidal blood, may represent “proliferative niches,” whereas endosteal niches, poorer in blood nutrients and oxygen, could represent more “quiescent niches.”2,15-18 The presence of 2 types of niches could also explain why “phenotypically homogeneous” HSCs, defined as LSK CD48−CD34−Flt3−CD150+, contain 2 pools of HSCs proliferating at 2 different rates.10
To further explore whether local blood perfusion defines functionally distinct niches for HSCs, we took advantage of in vivo perfusion of the vital fluorescent DNA intercalant Hoechst 33342 (Ho), which enables the measurement of blood perfusion in various normal or malignant tissues,19 including BM.17 By combining in vivo Ho perfusion with arrays of up to 6 fluorescent antibodies for specific cell surface antigens, we have been able to establish a positional hierarchy within the BM between HSCs and lineage-restricted HPCs relative to rapid blood flow, as well as for stromal cells such as endothelial cells, mesenchymal stem cells (MSCs), and osteoblast lineage cells. We report that most HSCs, defined either by LSK CD41−CD48−C150+ or LSK CD41−CD34−FLT3− phenotypes, reside in the least perfused areas of the BM in vivo. Importantly, these phenotypic HSCs could be further divided into Ho-negative (Honeg) and Ho-medium (Homed) populations according to their Ho uptake in vivo. Although both populations could reconstitute primary recipients long term, thus fulfilling the criteria of HSCs, we report that only Honeg phenotypic HSCs were capable of multilineage reconstitution of secondary hosts, clearly defining the most potent HSCs as being located in the BM niches with negligible blood perfusion. Finally, mobilization of HSCs by daily injections of granulocyte colony-stimulating factor (G-CSF) resulted in a large proportion of HSCs and multipoint HPCs migrating to more perfused locations.
Methods
Mice and mobilization
C57BL/6 CD45.2+, congenic B6.SJL CD45.1+, and 129SvJ mice were 9 to 12 weeks of age. All procedures were approved by the University of Queensland Animal Experimentation Ethics Committee. Mice were mobilized by injecting recombinant human G-CSF (Neupogen; Amgen) subcutaneously twice daily at 125 μg/kg per injection for 3 to 6 days. Cyclophosphamide was injected once intraperitoneally at 200 mg/kg.
Ho in vivo perfusion and cell harvesting
Mice were anesthetized with isoflurane before intravenous injection into the right and then left retro-orbital sinuses with 2 doses of 0.8 mg of Ho per 25 g of body weight at exactly 10 and 5 minutes before tissue sampling.17 After cardiac puncture for heparinized blood collection and cervical dislocation, femora, tibiae, and pelvic bones were rapidly removed and crushed in a cold mortar/pestle on ice containing ice-cold phosphate-buffered saline with 2% fetal calf serum, 50μM verapamil, and 5μM reserpine (washing buffer) to block Ho cellular efflux.17 BM cell isolation was complete within 2 minutes of death.
To harvest endosteal cells, crushed bone fragments were washed 3 times with washing buffer to remove BM cells, then incubated 30 minutes at 37°C in the dark with 3 mg/mL collagenase type 1 from Clostridium histolyticum (Worthington Biochemical), 50μM verapamil, and 5μM reserpine. Cells were then filtered (40-μm cell strainer) and washed twice with ice-cold washing buffer.
Ho uptake analysis by flow cytometry
All antibody stains and cell phenotypes were performed in ice-cold washing buffer containing verapamil and reserpine and are described in detail in supplemental Methods (available on the Blood Web site; see the Supplemental Materials link at the top of the online article).
Bromodeoxyuridine retention analysis
Mice were administered bromodeoxyuridine (BrdU) for 14 days in drinking water (0.5 mg/mL), then they were allowed to rest (chase) for 70 days. This tissue sampling treatment labels greater than 95% of HSCs10 (and our unpublished data, I.G.W., V.B., J.-P.L., November 2006). Ho was administered intravenously 10 minutes and again 5 minutes before tissue sampling, and BM cells were harvested and stained for phenotypic HSCs. From each individual mouse, Honeg and Homed BM cells within the Lin−KIT+ gate were sorted, fixed, and stained for BrdU incorporation (supplemental Methods). The percentage of cells that retained BrdU within the LSK CD41−CD48−CD150+ Honeg and Homed populations was analyzed by flow cytometry.
Immunohistochemistry
Tibias were fixed, decalcified, sectioned, and stained for CD31 as described in supplemental Methods. The number of blood vessels/mm2 of BM tissue was then enumerated.
Evans blue determination of blood volume in BM
Mice were injected with exactly 200 μL of 2% Evans blue per 20 g of body weight retro-orbitally 10 minutes before tissue sampling. Blood was collected in heparinized tubes, and plasma was separated after two 1000g centrifugations. Both femurs were flushed into 1 mL of phosphate-buffered saline and centrifuged at 400g to collect BM fluids. Evans blue concentration in cell-free BM fluids and plasma (at 1/50 dilution) were measured by spectrophotometry at 620 nm. The volume of blood plasma per femoral BM was calculated by dividing the concentration of Evans blue in femoral BM fluid by the concentration of Evans blue per microliter of blood plasma.
Long-term reconstitution assays
B6.SJL CD45.1+ mice were retro-orbitally injected with Ho dye, and BM cells were extracted. KIT+ cells were enriched by magnetic-activated cell sorting with the use of CD117 (KIT−) magnetic-activated cell sorting microbeads in the presence of verapamil and reserpine, then stained. Honeg and Homed cells within the LSK CD41−CD48−CD150+ phenotype were sorted, counted on a microscope with the use of a Rosenthal eosinophil counting chamber, and diluted to obtain 50 sorted cells then mixed with 2 × 10⁵ competitive whole BM cells from congenic C57BL/6 CD45.2+ mice in 200-μL aliquots. Each aliquot was injected retro-orbitally into C57BL/6 recipients lethally irradiated 24 hours before with an 11.0-Gy split dose. Multilineage chimerism was measured by flow cytometry 16 weeks after transplantation after staining of blood leukocytes for CD45.1, CD45.2, CD11b, B220, and CD3.
For secondary transplantations, primary recipients were killed by cervical dislocation; BM was harvested from femurs and pooled within each group. Lethally irradiated C57BL/6 recipients were then injected with 2 × 10⁶ whole BM cells from primary recipients. Multilineage chimerism was measured 16 weeks after transplantation.
Results
Positional hierarchy of BM HSCs and HPCs relative to blood flow
By analyzing cell uptake of the fluorescent dye Ho after a 10-minute in vivo perfusion, Parmar et al17 have shown that long-term reconstituting HSCs were enriched in areas of the BM which are the least perfused by blood. However, these investigators could not discriminate between different cell populations or HSCs because Ho uptake analysis was not combined with antibody-based staining to identify these stem and progenitor populations. To overcome this, we injected mice retro-orbitally twice at 10 and 5 minutes before tissue sampling. At that time, blood was sampled by cardiac puncture, and hind limb bones were immediately recovered. BM cells were then stained with cocktails of antibodies for HSCs, myeloid progenitors, and stromal cells. All steps were performed on ice in the presence of reserpine and verapamil to prevent Ho dye efflux by adenosine triphosphate (ATP)–dependent pumps.17
To determine the amount of Ho dye present in the blood (and to delineate a Hobright gate), blood leukocytes were isolated by NH4Cl-mediated red cell lysis with verapamil and reserpine and analyzed for Ho uptake by flow cytometry. In 8 independent experiments with at least 6 mice each, the amount of Ho uptake by viable blood leukocytes was consistently reproducible with standard deviation of less than 10% mean fluorescence intensity. For each experiment, a Ho bright (Hobright) gate corresponding to fluorescence levels from blood leukocytes was assigned (supplemental Figure 1), and then a Ho negative (Honeg) gate was based on leukocytes from control mice that were not perfused was assigned. Between these Hobright and Honeg gates, a third gate, Homed, was established (supplemental Figure 1).
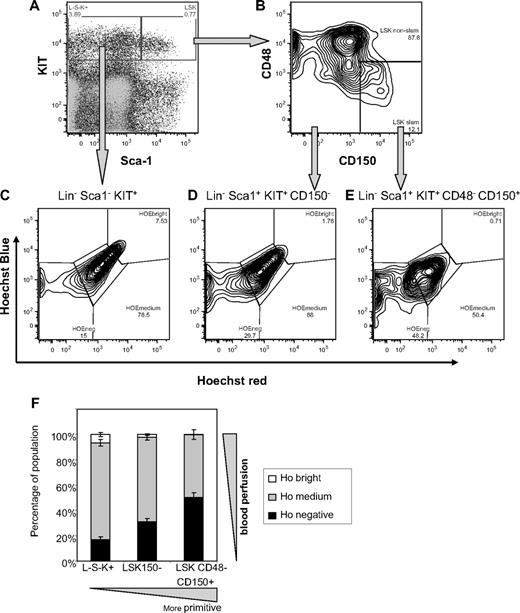
Following this gating strategy, Ho uptake was then analyzed in viable antibody-labeled BM leukocytes. Staining for hematopoietic stem/progenitor cell (HSPC) populations clearly showed that more primitive cells incorporate less Ho in vivo. Specifically, 49.9% (± 3.7%) LSK CD41−CD48−CD150+ HSCs, 30.9% (± 2.4%) LSK CD41−CD150− multipotent progenitors, and 16.7% (± 2.2%) Lin−KIT+Sca-1− lineage-restricted progenitors were negative for Ho incorporation (Figure 1). The proportion of cells within the Honeg gate was significantly different between each pair of cell populations (P < .01; 8 mice per group, 2-way analysis of variance). Conversely, these proportions were inverted in the Hobright gate which maximally incorporated perfused Ho dye (close to blood flow) with only 0.2% (± 0.3%) CD48−CD150+ HSCs, 2.0% (± 0.5%) CD150− multipotent progenitors, and 6.6% (± 0.2%) Sca-1− lineage-restricted progenitors being Hobright. Again, the difference between each pair of cell populations was significant (P < .01).
In vivo Ho uptake by BM HSCs and by multipotent and lineage-restricted progenitor cells according to the SLAM code phenotype. C57BL/6 mice were perfused with Ho dye intravenously 10 and 5 minutes before tissue sampling; BM cells were harvested on ice in the presence of verapamil and reserpine to block ATP-dependent transporters and stained for lineage, CD41, Sca-1, KIT, CD48, and CD150 surface antigens. (A) Representative dot plot of Sca-1 versus KIT expression on viable 7-amino-actinomycin D−Lin−CD41−–gated BM cells. (B) Dot plot of CD48 versus CD150 expression on Lin−CD41−Sca-1+KIT+ cells gated in panel A. (C-E) Representative dot plots of Ho blue fluorescence versus Ho red fluorescence of gated viable Lin−CD41−Sca-1−KIT+ lineage-restricted progenitors, Lin−CD41−Sca-1+KIT+CD150− short-term reconstituting multipotent progenitors, and Lin−CD41−Sca-1+KIT+CD48−CD150+ HSCs, respectively. (F) Distribution of Hoechst bright, medium, and negative cells among Lin−CD41−Sca-1−KIT+ (L−S−K+), Lin−CD41−Sca-1+KIT+CD150− (LSK150−), and Lin−CD41−Sca-1+KIT+CD48−CD150+ (LSK CD48−CD150+) populations. Data are average ± SD from 8 mice.
In vivo Ho uptake by BM HSCs and by multipotent and lineage-restricted progenitor cells according to the SLAM code phenotype. C57BL/6 mice were perfused with Ho dye intravenously 10 and 5 minutes before tissue sampling; BM cells were harvested on ice in the presence of verapamil and reserpine to block ATP-dependent transporters and stained for lineage, CD41, Sca-1, KIT, CD48, and CD150 surface antigens. (A) Representative dot plot of Sca-1 versus KIT expression on viable 7-amino-actinomycin D−Lin−CD41−–gated BM cells. (B) Dot plot of CD48 versus CD150 expression on Lin−CD41−Sca-1+KIT+ cells gated in panel A. (C-E) Representative dot plots of Ho blue fluorescence versus Ho red fluorescence of gated viable Lin−CD41−Sca-1−KIT+ lineage-restricted progenitors, Lin−CD41−Sca-1+KIT+CD150− short-term reconstituting multipotent progenitors, and Lin−CD41−Sca-1+KIT+CD48−CD150+ HSCs, respectively. (F) Distribution of Hoechst bright, medium, and negative cells among Lin−CD41−Sca-1−KIT+ (L−S−K+), Lin−CD41−Sca-1+KIT+CD150− (LSK150−), and Lin−CD41−Sca-1+KIT+CD48−CD150+ (LSK CD48−CD150+) populations. Data are average ± SD from 8 mice.
The differential Ho uptake by BM HSCs and HPCs could be explained by 3 distinct mechanisms: (1) different positioning relative to blood flow, (2) Ho efflux due to expression of ATP-dependent transporters such as Bcrp1/ABCG2,20-22 or (3) different DNA content due to cycling. Because verapamil and reserpine both slow heart rate and blood pressure, these drugs could not be injected together with Ho in vivo. Instead, to confirm that Ho efflux is not involved, BM cells from untreated mice were stained ex vivo with decreasing Ho concentrations for 10 minutes at 37°C in the presence or absence of verapamil and reserpine. Cells were then washed and stained in the presence of verapamil and reserpine exactly as described for cells recovered from mice perfused in vivo and Ho uptake by HSCs and progenitors determined as a function of local Ho dye concentration (supplemental Figure 2). As expected, Ho uptake decreased linearly with Ho concentration in the presence of pump inhibitors. If Ho was significantly effluxed during the initial 10-minute loading period, the slopes of the 2 regressions (with or without inhibitors) would have been significantly different (supplemental Figure 2A); however, it was not the case (P > .4). Moreover, at all concentrations tested, LSK CD41−CD48−CD150+ HSCs were uniformly stained as a single population regardless of inhibitor presence, in sharp contrast to in vivo perfusion that partitioned this phenotype into 2 distinct populations, Honeg and Homed (compare Figure 1E with supplemental Figure 2B). Therefore, the appearance of distinct Honeg and Homed HSC populations after Ho in vivo perfusion cannot be because of differences in dye efflux during the 10 minutes of perfusion. The same observations were made when these analyses were performed on LSK CD41−CD150− and Lin−Sca1−KIT+ lineage-restricted populations which also do not appear to significantly efflux Ho during 10 minutes at 37°C in the absence of inhibitors (supplemental Figure 2A). In summary there is no significant difference in the intensity of Ho staining after 10 minutes of incubation whether pump inhibitors were present or absent (P > .1 in paired t test or comparison of slope regression tests). A similar lack of Ho efflux ability during a 10-minute loading period was also observed for other cell phenotypes, such as myeloid progenitor and stromal cells. Thus, as previously reported on total BM leukocytes,17 the 10-minute period corresponding to the time between Ho injection and BM harvesting is too short to enable significant dye efflux by HSCs in vitro even if verapamil and reserpine are absent. Therefore, efflux by ATP-dependent transporters cannot account for the differential Ho uptake observed in vivo (Figure 1).
Because Ho is a DNA intercalant, another factor that may alter Ho cell uptake by HSCs is cycling and differences in DNA content. We stained BM cells for Lin Sca-1 KIT and CD48, then fixed, permeabilized, and stained for DNA content with DAPI (4′-6′-diamidine-2-phenylindole) and for the nuclear antigen Ki67 (supplemental Figure 3). We found only 10.9% (± 0.8%; n = 4 mice) of LSK CD41−CD48− cells, which include HSCs and multipotent HPCs, were progressing through the S/G2/M phases of the cell cycle with more than 2n DNA, whereas 63.2% (± 1.4%) of the cells were in G0 and 31.9% (± 1.4%) in G1, respectively, in good agreement with recent findings.10 Thus, the higher Ho uptake by 50% of the LSK CD41−CD48−CD150+ HSCs cannot be explained by increased DNA content of cells progressing through the S/G2/M phases. Furthermore, cell division would at the most double Ho staining intensity; thus, it cannot explain the log difference in Ho uptake intensity between Honeg and Homed gates.
Therefore, the difference in Ho uptake by HSCs and HPCs isolated from the BM of mice perfused with Ho in vivo is neither because of differences in Ho efflux nor DNA content but instead to a gradient in their positioning relative to rapid blood flow. Importantly, this relative positioning is reflective of the hematopoietic hierarchy, with LSK CD41−CD48−CD150+ HSCs being most distal to rapid blood flow and with lineage-restricted Lin−Sca1−KIT+ HPCs being closest to blood flow and multipotent and short-term reconstituting progenitors in an intermediate position.
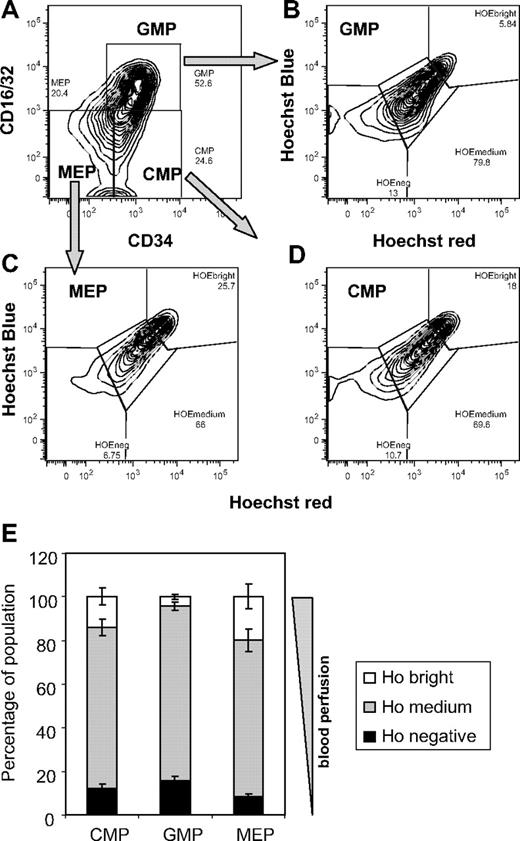
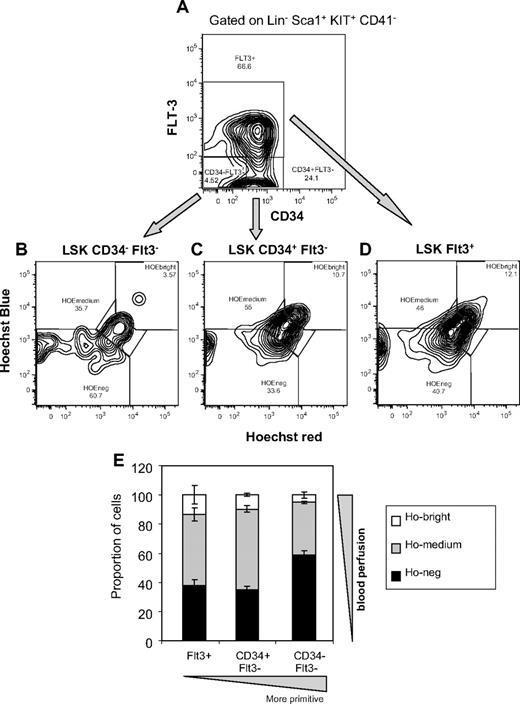
The same approach was used to determine the relative positioning of phenotypic myeloid progenitors common myeloid progenitor, granulocyte/macrophage progenitor, and megakaryocyte/erythrocyte progenitor23 (Figure 2). Significantly each myeloid progenitor population had higher Ho uptake than HSCs and multipotent progenitors. Furthermore each myeloid progenitor population showed distinct levels of Ho uptake reflective of different positioning relative to blood flow in vivo (P < .01; 4 mice per group, 2-way analysis of variance). megakaryocyte/erythrocyte progenitors had the highest proportion of cells with maximal Ho uptake close to blood flow, whereas granulocyte/macrophage progenitors had the lowest proportion of Hobright cells and the highest proportion of Honeg cells furthest from blood flow. To determine whether this positional hierarchy could be generalized to other inbred mouse strains and whether the use of another phenotypic profile for HSCs gives similar result, these experiments were repeated in the 129SvJ strain with the combination of CD34 and FMS-like tyrosine kinase 3 (FLT3) antibodies instead of CD48 and CD150 (Figure 3). Again, the LSK CD41−CD34−FLT3− cells, which comprise all long-term repopulating HSCs,24,25 were found to have the largest proportion of cells with no Ho uptake (Honeg) after in vivo perfusion (58.8% ± 2.8%) compared with LSK CD41−FLT3+ short-term reconstituting lymphoid progenitors (37.6% ± 4.6%) and LSK CD41−CD34+FLT3− short-term reconstituting myeloid progenitors (34.7% ± 2.4%). Conversely, only 5.1% ± 2.2% of CD34−FLT3− HSCs were close to blood flow (in Hobright gate) compared with CD34+FLT3− and CD34+FLT3+ short-term reconstituting progenitors (9.6% ± 1.0% and 13.2% ± 6.4% Hobright, respectively). Therefore, as shown in C57BL/6 mice with the use of the CD48/CD150 phenotype, HSCs defined by the LSK CD34−FLT3− phenotype are also the least perfused by rapid blood flow in the BM of 129SvJ mice.
In vivo Ho uptake by BM myeloid progenitors. C57BL/6 mice were perfused with Ho dye intravenously 10 and 5 minutes before tissue sampling; BM cells were harvested on ice in the presence of verapamil and reserpine to block ATP-dependent transporters and stained for lineage, interleukin-7 receptor α (IL-7Rα), Sca-1, KIT, CD16/32, and CD34 surface antigens. (A) Representative dot plot of CD16/CD34 versus CD34 expression on viable 7-amino-actinomycin D− Lin− IL7-Rα− Sca-1− KIT+–gated BM cells and shows the gates representing common myeloid progenitors (CMPs), granulocyte/macrophage progenitors (GMPs), and megakaryocyte/erythrocyte progenitors (MEPs). (B-D) Representative dot plots of Ho blue fluorescence versus Ho red fluorescence of gated viable GMPs, MEPs, and CMPs, respectively. (E) Distribution of Hoechst bright, medium, and negative cells among CMPs, GMPs, and MEP. Data are average ± SD from 4 mice.
In vivo Ho uptake by BM myeloid progenitors. C57BL/6 mice were perfused with Ho dye intravenously 10 and 5 minutes before tissue sampling; BM cells were harvested on ice in the presence of verapamil and reserpine to block ATP-dependent transporters and stained for lineage, interleukin-7 receptor α (IL-7Rα), Sca-1, KIT, CD16/32, and CD34 surface antigens. (A) Representative dot plot of CD16/CD34 versus CD34 expression on viable 7-amino-actinomycin D− Lin− IL7-Rα− Sca-1− KIT+–gated BM cells and shows the gates representing common myeloid progenitors (CMPs), granulocyte/macrophage progenitors (GMPs), and megakaryocyte/erythrocyte progenitors (MEPs). (B-D) Representative dot plots of Ho blue fluorescence versus Ho red fluorescence of gated viable GMPs, MEPs, and CMPs, respectively. (E) Distribution of Hoechst bright, medium, and negative cells among CMPs, GMPs, and MEP. Data are average ± SD from 4 mice.
In vivo Ho uptake by BM HSCs and multipotent progenitor cells according to their CD34 and FLT3 expression profiles. 129SvJ mice were perfused with Ho dye intravenously 10 and 5 minutes before tissue sampling, and BM was processed exactly as described in Figure 1. BM cells were stained for lineage, CD41, Sca-1, KIT, CD34, and FLT3 surface antigens. (A) Dot plot of CD34 versus FLT3 expression on viable 7-amino-actinomycin D− LSK CD41−Sca-1+KIT+ cells. (B-D) Representative dot plots of Ho blue fluorescence versus Ho red fluorescence of gated viable LSK CD41−CD34−FLT3− long-term reconstituting HSCs, LSK CD41−CD34+FLT3− short-term reconstituting myeloid progenitors, and LSK CD41−FLT3+ short-term reconstituting lymphoid progenitors, respectively. (E) Distribution of Hoechst bright, medium, and negative cells among LSK CD41−CD34−FLT3− (CD34- FLT3-), LSK CD41−CD34+FLT3− (CD34+ FLT3-), and LSK CD41−FLT3+ (FLT3+) populations. Data are average ± SD from 3 mice.
In vivo Ho uptake by BM HSCs and multipotent progenitor cells according to their CD34 and FLT3 expression profiles. 129SvJ mice were perfused with Ho dye intravenously 10 and 5 minutes before tissue sampling, and BM was processed exactly as described in Figure 1. BM cells were stained for lineage, CD41, Sca-1, KIT, CD34, and FLT3 surface antigens. (A) Dot plot of CD34 versus FLT3 expression on viable 7-amino-actinomycin D− LSK CD41−Sca-1+KIT+ cells. (B-D) Representative dot plots of Ho blue fluorescence versus Ho red fluorescence of gated viable LSK CD41−CD34−FLT3− long-term reconstituting HSCs, LSK CD41−CD34+FLT3− short-term reconstituting myeloid progenitors, and LSK CD41−FLT3+ short-term reconstituting lymphoid progenitors, respectively. (E) Distribution of Hoechst bright, medium, and negative cells among LSK CD41−CD34−FLT3− (CD34- FLT3-), LSK CD41−CD34+FLT3− (CD34+ FLT3-), and LSK CD41−FLT3+ (FLT3+) populations. Data are average ± SD from 3 mice.
Positioning of BM stromal cells relative to blood flow
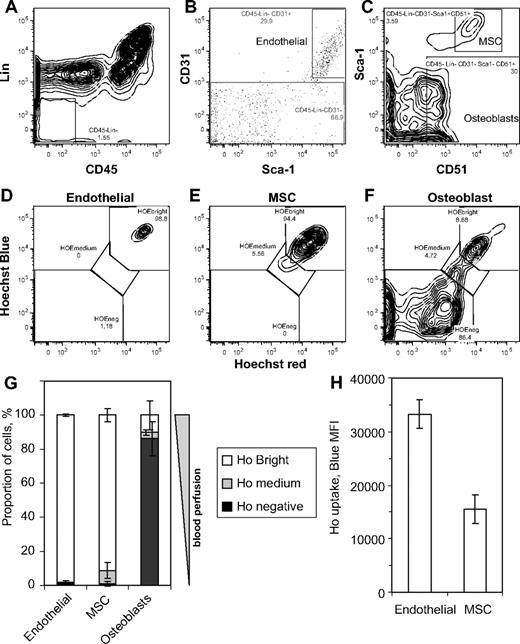
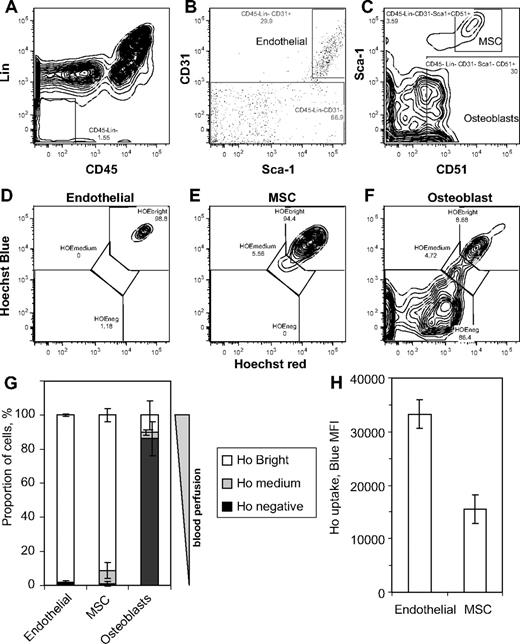
To determine whether this method of in vivo positioning relative to blood flow could also determine in vivo location of nonhematopoietic stromal and endothelial cells, endosteal cells were isolated from washed bone fragments of perfused 129SvJ mice by collagenase treatment and stained to detect Ho uptake in endothelial cells (CD45−Lin−CD31+Sca-1bright), MSCs (CD45−Lin−CD31−Sca-1brightCD51+), and osteoblast-lineage cells (CD45−Lin−CD31−Sca-1−CD51+)26,27 (Figure 4). These phenotypes have been validated by quantitative reverse transcription–polymerase chain reaction in which vascular endothelial–cadherin and E-selectin, 2 endothelial cell–specific markers, were only detected in sorted endothelial cells, whereas osteocalcin and runx2, 2 osteoblast-lineage specific markers, were expressed at high levels in sorted osteoblast-lineage cells but low levels in sorted MSCs and absent from sorted endothelial cells (not shown). Validation in culture of osteoblast-lineage cells and MSCs sorted by these phenotypes has been published elsewhere.27,28 As anticipated, vascular endothelial cells exhibited the greatest Ho uptake in vivo (96% of phenotypic endothelial cells are Hobright), reflecting their in vivo location against blood vessels. Interestingly, most CD45−Lin−CD31−Sca-1brightCD51+ MSCs also exhibited high levels of Ho uptake, with 92% in the Hobright gate albeit at half the level of Ho uptake compared with endothelial cells (Figure 4H), suggesting that these MSCs reside in perivascular regions in the BM29,30 similar to MSCs in other tissues.31 At the other end of the spectrum, phenotypically definable osteoblast-lineage cells had the lowest Ho uptake with 86% (± 10%) in the Honeg gate, possibly reflecting their location at the bone surface, and only 10% (± 2%) in the highly perfused Hobright gate close to rapidly flowing blood, possibly at active sites of bone remodeling.
In vivo Ho uptake by phenotypic BM endothelial cells, MSCs, and osteoblasts. 129SvJ mice were perfused with Ho dye intravenously 10 and 5 minutes before tissue sampling, hind limb bones were taken and crushed on ice in the presence of verapamil and reserpine, and BM cells were removed by several washes. Endosteal cells were then isolated by incubating crushed bones with collagenase in the presence of verapamil and reserpine. Cells were then stained with CD45, lineage, CD31, Sca-1, and CD51 antibodies. (A) Gating of CD45−Lin− nonhematopoietic cells. (B) Gating of CD31bright endothelial cells and CD31− cells from the CD45−Lin− gate in panel A. (C) Gating of Sca-1+CD51+ MSCs and Sca-1−CD51+ osteoblast-lineage cells from the CD45−Lin−CD31− gate defined in panel B. (D-F) Representative dot plots of Ho blue fluorescence versus Ho red fluorescence of gated viable CD45−Lin−CD31brightSca-1bright BM endothelial cells, CD45−Lin−CD31−Sca-1brightCD51+ MSCs, and CD45−Lin−CD31−Sca-1brightCD51+ osteoblast lineage cells, respectively. (G) Distribution of Hoechst bright, medium, and negative cells among BM endothelial cells, MSCs, and osteoblasts and (H) mean fluorescence intensity of Ho blue fluorescence for BM endothelial cells and MSCs. Data are average ± SD from 3 mice.
In vivo Ho uptake by phenotypic BM endothelial cells, MSCs, and osteoblasts. 129SvJ mice were perfused with Ho dye intravenously 10 and 5 minutes before tissue sampling, hind limb bones were taken and crushed on ice in the presence of verapamil and reserpine, and BM cells were removed by several washes. Endosteal cells were then isolated by incubating crushed bones with collagenase in the presence of verapamil and reserpine. Cells were then stained with CD45, lineage, CD31, Sca-1, and CD51 antibodies. (A) Gating of CD45−Lin− nonhematopoietic cells. (B) Gating of CD31bright endothelial cells and CD31− cells from the CD45−Lin− gate in panel A. (C) Gating of Sca-1+CD51+ MSCs and Sca-1−CD51+ osteoblast-lineage cells from the CD45−Lin−CD31− gate defined in panel B. (D-F) Representative dot plots of Ho blue fluorescence versus Ho red fluorescence of gated viable CD45−Lin−CD31brightSca-1bright BM endothelial cells, CD45−Lin−CD31−Sca-1brightCD51+ MSCs, and CD45−Lin−CD31−Sca-1brightCD51+ osteoblast lineage cells, respectively. (G) Distribution of Hoechst bright, medium, and negative cells among BM endothelial cells, MSCs, and osteoblasts and (H) mean fluorescence intensity of Ho blue fluorescence for BM endothelial cells and MSCs. Data are average ± SD from 3 mice.
Ho perfusion prospectively separates phenotypic HSCs capable of serial transplantation from phenotypically identical HSCs able to reconstitute only a single host
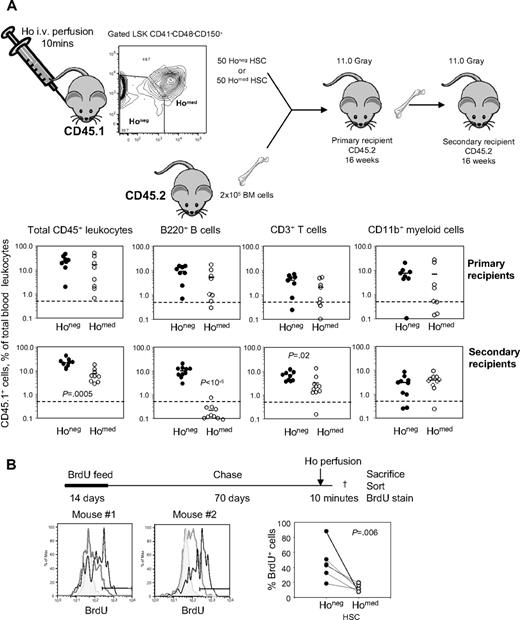
Kiel et al7 have previously reported that 1 in 2 LSK CD41−CD48−CD150+ cells are capable of long-term hematopoietic reconstitution. Remarkably, in our in vivo Ho incorporation experiments, phenotypic HSCs could also be divided into 2 populations or similar size, one Honeg and the other Homed (Figures 1E and 3C). To determine whether this was coincidental or whether the whole HSC activity was contained within the Honeg or Homed populations, these cell populations were sorted from B6.SJL CD45.1+ mice intravenously perfused with Ho for 10 minutes. Fifty sorted LSK CD41−CD48−CD150+Honeg cells or LSK CD41−CD48−CD150+Homed cells were injected together with 2 × 10⁵ competitive whole BM cells from congenic C57BL/6 CD45.2+ mice per lethally irradiated C57BL/6 recipient (Figure 5A). Sixteen weeks after transplantation, blood chimerism was measured in B-cell, T-cell, and myeloid lineages and considered multilineage when the number of donor CD45.1+ leukocytes within each individual lineage was above 0.5% of total blood leukocytes. Six of the 8 primary recipients that received a transplant with Honeg HSCs had multilineage reconstitution compared with 4 of 8 mice that received a transplant with Homed HSCs. This difference in primary transplant blood reconstitution was not significant (P = .36, Fisher exact test; Figure 5). However, because the LSK CD41− CD48−CD150+ phenotype defines very primitive HSCs, we further tested HSC self-renewal potential in more stringent serial transplantation assay. Primary recipients were killed, and 2 × 10⁶ BM cells were transplanted into lethally irradiated C57BL/6 secondary recipients. At 16 weeks after transplantation, 8 of 10 secondary recipients of Honeg HSCs exhibited multilineage chimerism in myeloid, B-cell, and T-cell lineages. In sharp contrast, only 1 of 10 of the secondary recipients of Homed cells showed multilineage CD45.1+ chimerism albeit at a very low level (Figure 5A). Thus, Ho uptake in vivo can prospectively distinguish between phenotypic HSCs able to serially reconstitute (Honeg) and HSCs able to reconstitute a single host only (Homed; P = .003, Fisher exact test).
Serially transplantable and long-term BrdU-retaining HSCs do not uptake Ho in vivo. (A) Donor B6.SJL CD45.1+ mice were retro-orbitally injected with Ho 10 and 5 minutes before tissue sampling, and BM leukocytes were stained for lineage, CD41, Sca-1, KIT, CD48, and CD150 surface antigens. Gated LSK CD41−CD48−CD150+ phenotypic HSCs were sorted according to Ho uptake into Honeg and Homed described in Figure 1E. Each lethally irradiated congenic primary recipient (CD45.2+) was injected retro-orbitally with 50 sorted LSK CD41−CD48−CD150+ Honeg (Honeg) cells or 50 sorted LSK CD41−CD48−CD150+ Homed (Homed) cells together with 200 000 competitive CD45.2+ BM cells. Sixteen weeks after transplantation, CD45.1+ donor contribution was analyzed in blood CD45+ leukocytes, CD11b+ myeloid cells, B220+ B cells, and CD3+ T cells (top). Primary recipients were then killed, and BM leukocytes were harvested. CD45.2+ lethally irradiated secondary recipients were then transplanted with 2 × 10⁶ unmanipulated BM cells from the primary recipients. Sixteen weeks after transplantation, CD45.1+ donor contribution was analyzed in blood CD45+ leukocytes, CD11b+ myeloid cells, B220+ B cells, and CD3+ T cells (bottom). Each dot is the result from one mouse; bars are the average for each group. Significant differences are shown in each panel. (B) Mice were fed for 2 weeks with BrdU and then chased for 70 days. BrdU content was then measured by flow cytometry on sorted LSK CD41−CD48−CD150+ Honeg and LSK CD41−CD48−CD150+ Homed HSCs. The 2 histograms on the left and middle are overlays of BrdU stain on phenotypic LSK CD41−CD48−CD150+ HSCs from a control mouse without BrdU (shaded gray), Honeg (gray), and Homed (black) obtained from a Ho-perfused mouse. The 2 histograms are from 2 representative Ho-perfused mice. The right plot is the percentage of BrdU+ cells among Honeg (●) and Homed (○) LSK CD41−CD48−CD150+ HSCs. Each dot represents a separate mouse.
Serially transplantable and long-term BrdU-retaining HSCs do not uptake Ho in vivo. (A) Donor B6.SJL CD45.1+ mice were retro-orbitally injected with Ho 10 and 5 minutes before tissue sampling, and BM leukocytes were stained for lineage, CD41, Sca-1, KIT, CD48, and CD150 surface antigens. Gated LSK CD41−CD48−CD150+ phenotypic HSCs were sorted according to Ho uptake into Honeg and Homed described in Figure 1E. Each lethally irradiated congenic primary recipient (CD45.2+) was injected retro-orbitally with 50 sorted LSK CD41−CD48−CD150+ Honeg (Honeg) cells or 50 sorted LSK CD41−CD48−CD150+ Homed (Homed) cells together with 200 000 competitive CD45.2+ BM cells. Sixteen weeks after transplantation, CD45.1+ donor contribution was analyzed in blood CD45+ leukocytes, CD11b+ myeloid cells, B220+ B cells, and CD3+ T cells (top). Primary recipients were then killed, and BM leukocytes were harvested. CD45.2+ lethally irradiated secondary recipients were then transplanted with 2 × 10⁶ unmanipulated BM cells from the primary recipients. Sixteen weeks after transplantation, CD45.1+ donor contribution was analyzed in blood CD45+ leukocytes, CD11b+ myeloid cells, B220+ B cells, and CD3+ T cells (bottom). Each dot is the result from one mouse; bars are the average for each group. Significant differences are shown in each panel. (B) Mice were fed for 2 weeks with BrdU and then chased for 70 days. BrdU content was then measured by flow cytometry on sorted LSK CD41−CD48−CD150+ Honeg and LSK CD41−CD48−CD150+ Homed HSCs. The 2 histograms on the left and middle are overlays of BrdU stain on phenotypic LSK CD41−CD48−CD150+ HSCs from a control mouse without BrdU (shaded gray), Honeg (gray), and Homed (black) obtained from a Ho-perfused mouse. The 2 histograms are from 2 representative Ho-perfused mice. The right plot is the percentage of BrdU+ cells among Honeg (●) and Homed (○) LSK CD41−CD48−CD150+ HSCs. Each dot represents a separate mouse.
To confirm that Ho incorporation does not affect subsequent engraftment and reconstitution, total BM cells were incubated for 10 minutes at 37°C with or without 200μM Ho, washed in buffer with verapamil and reserpine, and then transplanted in a competitive reconstitution assay. No difference in reconstitution at 16 weeks after transplantation between BM cells treated with Ho or not was observed (supplemental Figure 4). Thus, the differences observed are not because of Ho toxicity on HSCs.
BrdU label–retaining HSCs are enriched in the Honeg gate
Serially reconstituting HSCs divide less frequently than HSCs able to reconstitute a single host only.10 To confirm that HSCs residing furthest from blood flow (Honeg HSCs) cycled less frequently than Homed HSCs, mice were administered BrdU for 2 weeks to label greater than 95% HSCs then rested (BrdU chase) for 70 days. Mice were then perfused with Ho for 10 minutes, and BrdU content in sorted LSK CD41−CD48−CD150+Honeg and Homed cells was determined. Indeed, after a 70-day chase, BrdU long-term label-retaining HSCs were 3.7-fold more frequent among LSK CD41−CD48−CD150+ Honeg cells than among the more perfused Homed HSCs (P = .006; Figure 5B). Of note, the more proliferative Lin−Sca1−KIT+ and LSK CD41−CD48+ cell populations had no BrdU label retention activity (containing < 0.04% BrdU+ cells, no different from control mice not fed with BrdU).
Collectively, these data show that the most potent HSCs able to serially transplant and with the highest BrdU label retention (slowest cell cycle activity) are contained within the LSK CD41−CD48−CD150+Honeg population. Thus, the most primitive HSCs reside in niches with negligible blood perfusion. Furthermore, our data show that Ho perfusion is a technique able to prospectively distinguish between deeply quiescent HSCs capable of multilineage reconstitution in serial transplants (with greatest BrdU label retention) from phenotypically identical but less potent HSCs able to reconstitute a single recipient only, which cycle more rapidly.
Effect of G-CSF administration on the positioning of BM cells relative to blood flow
Daily administration of G-CSF is routinely used in the clinical setting to mobilize large numbers of HSCs and HPCs into peripheral circulation, facilitating recovery of cells that can be used for hematopoietic reconstitution.32,33 The mobilization process involves the dislodgement of HSCs and HPCs from their BM niches and their migration to BM endothelial sinuses where they are flushed into the circulation.34,35 In a last set of experiments, the effect of daily administration of G-CSF on the relative positioning of hematopoietic and nonhematopoietic progenitor cells in the BM relative to rapid blood flow was investigated. 129SvJ mice were injected with saline (control mice) or G-CSF (mobilized mice) twice daily for 6 days and then perfused with Ho before tissue sampling. Analysis of Ho fluorescence showed that Ho uptake by LSK CD41−CD34−FLT3− HSCs and LSK CD41−CD34+FLT3− and FLT3+ multipotent progenitors was significantly increased in the BM of G-CSF–mobilized mice with the proportion of phenotypic HSCs close to the blood flow (Hobright) increasing from 4.5% (± 1.9%) to 32.6% (± 6.0%; Figure 6). In sharp contrast, Ho uptake by myeloid progenitors, MSCs, BM endothelial cells, and osteoblasts remained unchanged, suggesting that the overall perfusion rate of the BM tissue is not significantly altered. The increased Ho uptake by HSCs and multipotent HPCs in mobilized BM in vivo could be because of either their migration to more highly perfused areas of the BM or an increase in vascular density or permeability, a possibility underpinned by our previous finding that mobilization with G-CSF increases expression of vascular endothelial growth factor A within the BM.16
Relocation of HSCs and multipotent progenitors from nonperfused areas to highly perfused areas of the BM during G-CSF–induced mobilization of HSCs. 129SvJ mice were injected twice daily with saline (Sal) or G-CSF (G6) for 6 days. Ten and 5 minutes before tissue sampling, mice were perfused with Ho intravenously. After sampling, BM cells and endosteal cells were isolated and stained in the presence of verapamil and reserpine and analyzed for Ho dye uptake with the use of the previously defined gating strategies. Data show for each cell type the proportion of cells with maximal (Hobright, □), intermediate (Homed,  ), and negative (Honeg, ■) Ho dye uptake. Data are mean ± SD of 3 mice for the saline group and 4 mice for the G-CSF group; ***P < .001 and *P < .05.
Relocation of HSCs and multipotent progenitors from nonperfused areas to highly perfused areas of the BM during G-CSF–induced mobilization of HSCs. 129SvJ mice were injected twice daily with saline (Sal) or G-CSF (G6) for 6 days. Ten and 5 minutes before tissue sampling, mice were perfused with Ho intravenously. After sampling, BM cells and endosteal cells were isolated and stained in the presence of verapamil and reserpine and analyzed for Ho dye uptake with the use of the previously defined gating strategies. Data show for each cell type the proportion of cells with maximal (Hobright, □), intermediate (Homed,  ), and negative (Honeg, ■) Ho dye uptake. Data are mean ± SD of 3 mice for the saline group and 4 mice for the G-CSF group; ***P < .001 and *P < .05.
Effect of G-CSF on vascular density and leakage in the BM
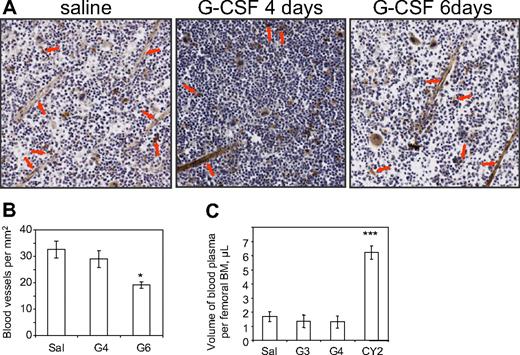
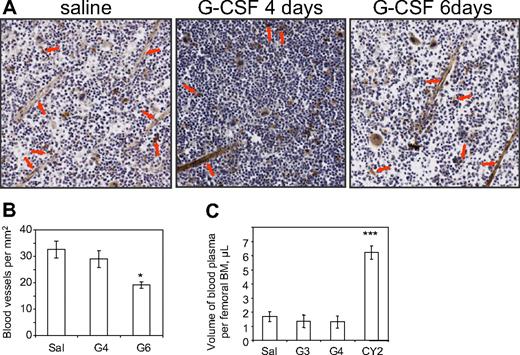
To investigate whether BM vascularization was increased during G-CSF treatment, femoral BM sections were stained for CD31+ endothelial cells (Figure 7A). After microscopic enumeration of the number of blood vessels per mm2 of BM section, blood vessel density was significantly reduced by 40% after 6 days of G-CSF treatment but not significantly altered after only 4 days of G-CSF compared with saline controls (Figure 7B).
G-CSF treatment does not increase BM vasculature density or permeability. (A) CD31 immunostaining on femoral sections of 129SvJ mice injected with saline for 6 days (Sal) or G-CSF for 4 (G4) or 6 days (G6). Images were captured on a Nanozoomer Digital Pathology C9600-02 scanner (Hamamatsu Photonics) using a 20×/0.7 numeric objective in air and NDP Scan U10074-01 image acquisition software (Hamamatsu). Image analysis was performed in ImageJ software Version 1.41o. (B) Quantification of BM microvascular density showing the number of blood vessels per mm2 of BM tissue. Arrows show typical vessels surrounded by CD31+ endothelial cells. Data are average ± SD of 4 mice per group. (C) Partition of Evans blue between BM fluid and blood plasma from 129SvJ mice treated with saline for 4 days (Sal), G-CSF for 3 (G3) or 4 (G4) days, or 2 days after a single injection of cyclophosphamide (CY2). Mice were injected retro-orbitally with 2% Evans blue 10 minutes before tissue sampling. Optical density at 620 nm was measured on femoral BM fluids and blood plasma to determine Evans blue concentrations in femoral BM fluids and blood plasma. Volume of blood plasma per femoral BM was then calculated for each individual mouse. Data are average ± SD of 4 mice per group. ***P < .001; *P < .05.
G-CSF treatment does not increase BM vasculature density or permeability. (A) CD31 immunostaining on femoral sections of 129SvJ mice injected with saline for 6 days (Sal) or G-CSF for 4 (G4) or 6 days (G6). Images were captured on a Nanozoomer Digital Pathology C9600-02 scanner (Hamamatsu Photonics) using a 20×/0.7 numeric objective in air and NDP Scan U10074-01 image acquisition software (Hamamatsu). Image analysis was performed in ImageJ software Version 1.41o. (B) Quantification of BM microvascular density showing the number of blood vessels per mm2 of BM tissue. Arrows show typical vessels surrounded by CD31+ endothelial cells. Data are average ± SD of 4 mice per group. (C) Partition of Evans blue between BM fluid and blood plasma from 129SvJ mice treated with saline for 4 days (Sal), G-CSF for 3 (G3) or 4 (G4) days, or 2 days after a single injection of cyclophosphamide (CY2). Mice were injected retro-orbitally with 2% Evans blue 10 minutes before tissue sampling. Optical density at 620 nm was measured on femoral BM fluids and blood plasma to determine Evans blue concentrations in femoral BM fluids and blood plasma. Volume of blood plasma per femoral BM was then calculated for each individual mouse. Data are average ± SD of 4 mice per group. ***P < .001; *P < .05.
In a complementary experiment to determine whether G-CSF treatment alters the volume of blood in the BM, mice were injected with a precise amount of Evans blue 10 minutes before tissue sampling, then blood plasma and the fluid from flushed femoral BM were collected for analysis. Evans blue binds with high affinity to serum albumin. Because of its large size, this complex does not cross intact vascular endothelium. In humans, Evans blue injection and determination of its blood plasma concentration, are a standard assay to calculate total blood plasma volume and loss.36 In mice, we injected Evans blue 10 minutes before tissue sampling and measured its concentration in blood plasma and femoral BM to calculate the volume of blood plasma per femoral BM. We found that femoral BM contained 3.7-fold more blood plasma when collected from mice 2 days after cyclophosphamide administration compared with control mice (Figure 7C), in good agreement with previous studies showing that the BM endothelial barrier is disrupted with high vascular leakage during the myeloablative phase that immediately follows cyclophosphamide injection.37,38 However, the volume of blood plasma in femoral BM actually decreased by 20% after 3 or 4 days of treatment with G-CSF (Figure 7C), suggesting a slight reduction in BM blood flow consistent with the reduced vasculature density observed in Figure 7B. Collectively, these results show that G-CSF (1) does not increase BM vascular density or permeability and (2) induces the migration of 33% of HSCs and multipotent HPCs toward perivascular locations.
Discussion
This simple and rapid method appears to identify 2 functional populations of HSCs, each residing in separate niches as defined by blood perfusion. Importantly, only those phenotypic HSCs residing in niches with negligible blood perfusion (Honeg) were able to serially reconstitute all blood lineages in more than one host and were enriched in long-term BrdU label–retaining HSCs. Therefore, Honeg HSCs may be similar to the recently described dormant HSCs10 that (1) are also able to serially reconstitute more than one host, (2) also represent a subpopulation within the LSK CD41−CD48−CD34−Flt3−CD150+ phenotype, and (3) also have extremely slow turnover rate, because they can retain BrdU label over a 70-day chase in vivo.10 This is in contrast to more “active” HSCs within the same phenotype, because one that cycles more rapidly (possibly every 35 days) and are only capable of reconstituting a single host.10 We have also found a less potent HSC population (Homed) only capable of single host reconstitution, which cycles faster (lower BrdU label retention) and resides in BM niches slightly more perfused by blood. Thus, it appears that HSCs can readily be divided into 2 functionally distinct groups, with the most dormant/primitive HSCs residing in a distinct BM niche characterized by negligible blood perfusion. Whether a HSC must leave the Honeg niche to cycle remains an interesting question and relevant to the dramatic changes in HSC location we observe after the administration of mobilizing agents such as G-CSF, which forces the majority of HSCs into cycle.10
Mobilizing agents such as G-CSF are used to move HSCs into the blood where they can be collected for transplantation. However, it was unclear (1) whether these mobilizing agents actually triggered active HSC migration from their niches to more perivascular locations then into the blood or (2) whether mobilizing agents acted primarily by increasing BM vascular permeability resulting in the “flushing” of HSCs from perivascular regions. In both scenarios, the accumulation of activated myeloid cells in response to G-CSF or chemotherapy and subsequent protease-mediated down-regulation of chemokines and cell adhesion molecules would contribute to “loosening” HSCs from these niches.26,37,39-42 Our data show that, although vascular endothelial growth factor A increases in the BM of mobilized mice,16 BM vascular density and permeability are not increased (and even trend downward) during mobilization. Thus, HSC mobilization appears to induce a significant migration of HSCs and multipotent HPCs to alternative BM niches which are better perfused by the blood. Because it is reported that HSCs undergo cell division within the BM in response to G-CSF before entering the circulation,10 it is tempting to speculate that this migration of HSCs into more perfused niches after G-CSF administration coincides with their entry into cycle.
Our data are also consistent with the hypothesis that the most dormant HSCs reside in hypoxic areas of the BM.2,17,18,43 We find that serially reconstituting HSCs are in the least perfused areas of the BM and display an Ho uptake profile similar to that of phenotypic osteoblast lineage cells. Remarkably, we found only a very low proportion (< 1%) of LSK CD41−CD48−CD150+ HSCs are Hobright, thus close to rapidly flowing blood. In the femoral BM, afferent blood is brought by a central artery which branches into arterioles, capillaries, and ultimately thin-walled sinusoids with a progressive drop in blood velocity and oxygenation.44 Direct measurements at the endosteum of the rabbit fibula have shown that sinusoidal blood flow is only one-tenth of that in capillaries.45 In addition, mathematic modeling predicts that a layer of 3 myeloid progenitors is sufficient to deplete most oxygen provided by a nearby BM sinusoid.46 It is therefore possible that the blood velocity in these sinusoids is so low that phenotypic HSCs need not be located very far away from these sinusoids to be Honeg and in hypoxia. Thus, exposure to blood perfusion may determine HSC function and niche characteristics more than absolute distance from the vasculature. Low blood velocity in BM sinusoids may therefore reconcile the observations that (1) most long-term reconstituting HSCs reside in hypoxic17 and poorly perfused areas of the BM and (2) phenotypic HSCs are also observed in proximity to blood sinusoids.7,8
From these observations it is tempting to speculate that the most dormant and primitive HSCs reside in unique niches with very low blood perfusion. These niches would be characterized by (1) greater concentration of locally secreted factors/mediators produced by support cells of the niche (factors/mediators diluted by the blood flow in more perfused/less dormant niches) and (2) very low concentrations of bloodborne nutrients and oxygen.
Our conclusion is that negligible blood perfusion, resulting in elevated concentrations of locally secreted niche factors, together with low oxygenation and low supply of bloodborne nutrients is probably a central characteristic of BM niches containing the most dormant and primitive HSCs able to reconstitute serial hosts, from phenotypically similar but less potent and more rapidly cycling HSCs. Furthermore, we can now use this simple and rapid method to prospectively isolate distinct HSC populations based on the blood perfusion characteristics of their in vivo niche to identify molecular components unique to serially reconstituting HSCs from other phenotypically identical but less potent HSCs.
An Inside Blood analysis of this article appears at the front of this issue.
The online version of this article contains a data supplement.
The publication costs of this article were defrayed in part by page charge payment. Therefore, and solely to indicate this fact, this article is hereby marked “advertisement” in accordance with 18 USC section 1734.
Acknowledgment
We thank Dr C. Walkley for insightful discussions and critical reading.
This work was supported by the National Health and Medical Research Council (grants 288701 and 434515). I.G.W. is a Research Fellow of the National Health and Medical Research Council. J.-P.L. is a Senior Research Fellow of the Cancer Council of Queensland. Recombinant human G-CSF was kindly donated by Amgen.
Authorship
Contribution: I.G.W., V.B., and J.-P.L. performed most of the experiments; R.W., S.W., and A.Z. performed some experiments; I.G.W. and J.-P.L. conceived the work, planned the experiments, and wrote the manuscript; and A.Z. wrote the corresponding parts and edited the manuscript.
Conflict-of-interest disclosure: The authors declare no competing financial interests.
Correspondence: Jean-Pierre Lévesque, Haematopoietic Stem Cell Laboratory, Mater Medical Research Institute, Aubigny Pl, Raymond Terr, South Brisbane, QLD 4101, Australia; e-mail: jplevesque@mmri.mater.org.au.





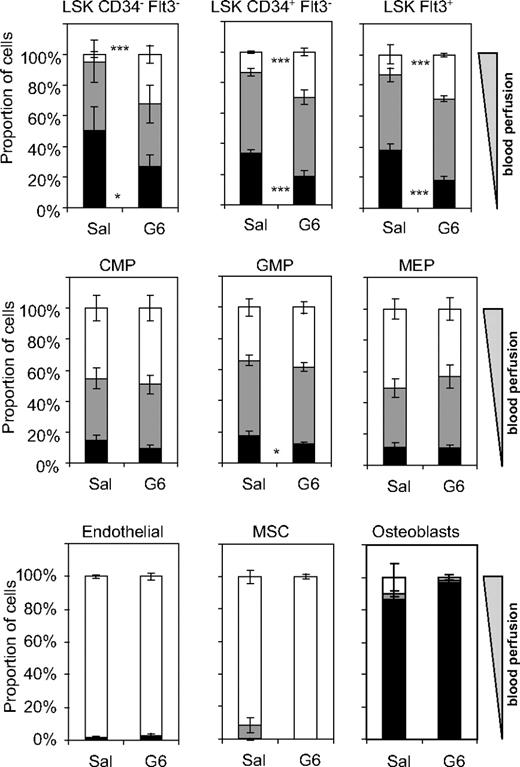
 ), and negative (Honeg, ■) Ho dye uptake. Data are mean ± SD of 3 mice for the saline group and 4 mice for the G-CSF group; ***P < .001 and *P < .05.