Abstract
Chronic lymphocytic leukemia (CLL) is an incurable adult disease of unknown etiology. Understanding the biology of CLL cells, particularly cell maturation and growth in vivo, has been impeded by lack of a reproducible adoptive transfer model. We report a simple, reproducible system in which primary CLL cells proliferate in nonobese diabetes/severe combined immunodeficiency/γcnull mice under the influence of activated CLL-derived T lymphocytes. By cotransferring autologous T lymphocytes, activated in vivo by alloantigens, the survival and growth of primary CFSE-labeled CLL cells in vivo is achieved and quantified. Using this approach, we have identified key roles for CD4+ T cells in CLL expansion, a direct link between CD38 expression by leukemic B cells and their activation, and support for CLL cells preferentially proliferating in secondary lymphoid tissues. The model should simplify analyzing kinetics of CLL cells in vivo, deciphering involvement of nonleukemic elements and nongenetic factors promoting CLL cell growth, identifying and characterizing potential leukemic stem cells, and permitting preclinical studies of novel therapeutics. Because autologous activated T lymphocytes are 2-edged swords, generating unwanted graph-versus-host and possibly autologous antitumor reactions, the model may also facilitate analyses of T-cell populations involved in immune surveillance relevant to hematopoietic transplantation and tumor cytoxicity.
Introduction
The most common leukemia among white adults, B-cell chronic lymphocytic leukemia (CLL), remains incurable and its pathogenesis poorly defined.1 Currently no system permits differentiation and long-term growth of CLL cells in vitro; therefore, an in vivo animal model that reproducibly supports engraftment and growth of human CLL cells would help elucidate key features of CLL cell biology and lead to better treatments.
Previous attempts to engraft human CLL cells into mice have been hampered for 2 reasons. First, xenogeneic recipients were not sufficiently immune deficient to prevent human cell rejection.2-5 Although Dürig et al5 successfully transferred CLL cells into nonobese diabetes/severe combined immunodeficiency (NOD/SCID) mice, apparently the level of CLL cell growth was not sufficient to correlate kinetics with essential interactions with different cell subpopulations. Second, optimal engraftment and growth may have been impaired by the inability of a murine microenvironment to support CLL cells in vivo. Indeed, in vitro studies suggest at least 3 cell lineages are involved in CLL survival and growth: lymphoid (T cells6,7 ), myeloid (monocytes and monocyte-derived nurse-like cells8 ), and mesenchymal (“stromal cells”9,10 ).
To provide a more physiologic microenvironment for CLL cells within highly immune incompetent recipients, we introduced precursors of human hematopoietic and mesenchymal lineages into NOD/Shi-scid,γcnull (NSG) mice, a NOD/SCID-derived strain that lacks the IL-2 family common cytokine receptor gamma chain gene (γc), rendering animals completely deficient in lymphocytes, including natural killer (NK) cells. We found activated autologous T cells were essential for leukemia cells to successfully engraft, survive, and proliferate in vivo and to recapitulate cardinal features of human CLL cells: kinetics, CD38 expression, and growth in secondary lymphoid tissues. This adoptive transfer model may facilitate the definition of leukemic and nonleukemic elements involved in the interactions and kinetics of CLL cells in patients.
Methods
Patients and samples
The Institutional Review Board and the Institutional Animal Care and Utilization Committee of the North Shore-LIJ Health System sanctioned these studies. After obtaining informed consent, in accordance with the Declaration of Helsinki, we collected blood from 37 CLL patients for whom clinical information, laboratory data, and immunoglobulin heavy chain (IGH) and immunoglobulin light chain variable region gene DNA sequences11 were available. PBMCs were isolated by density gradient centrifugation (Ficoll-Hypaque; Pharmacia LKB Biotechnology).
Carboxyfluorescein succinimidyl ester labeling
Cells (2 × 10⁷/mL) were incubated 10 minutes at 37°C with carboxyfluorescein succinimidyl ester (CFSE, 10μM; Invitrogen) and washed before injection into irradiated mice.
Isolation of human cord blood CD34+ cells
Anonymous, fresh samples were collected at North Shore University Hospital by The New York Blood Center. CD34+ cells were enriched with the use of the CD34 Progenitor Cell Isolation Kit (Miltenyi Biotec Inc), cryopreserved, and stored in liquid nitrogen until used.
Isolation of mature human antigen-presenting cells
Leukocyte-enriched blood from healthy volunteers (Long Island Blood Services) were selected for CD14+ and CD19+ cells with CD14 and CD19 MicroBeads (Miltenyi Biotec Inc); in some experiments, CD14+ cells were negatively selected with the RosetteSep custom cocktail (StemCell Technologies) containing anti-CD19, -CD3, and -CD56 mAbs. Isolated cells were cryopreserved.
Human BM-derived mesenchymal stromal cells
Human mesenchymal stromal cells (MSCs) were purchased (Lonza Walkersville Inc) and cultured with low-glucose DMEM supplemented with 20% FBS (Gemini Bio Products), 2M l-glutamine, 1000 U/mL penicillin, and 100 U/mL streptomycin (Invitrogen). Cells were used before the 6th passage.
Xenogeneic mouse transplantation
Four- to eight-week-old NSG mice (The Jackson Laboratory) were γ-irradiated (220 cGy) within 24 hours of intrabone or intravenous injection of human cord blood–derived hCD34+ cells (105), hMSCs (106), or mature antigen-presenting cells (APCs; CD14+ or CD19+, 2 × 10⁷). After anesthesia (tribromoethanol, 400 μg/g body weight), mice received CFSE-labeled PBMCs (50-100 × 106) either intrabone (20 μL) into lateral condyles of both tibiae or intravenously (50-100 μL) into retro-orbital plexus. Some mice received intraperitoneal injections twice weekly of 20 μg anti-CD3 mAb (clone OKT3; Ortho Biotech), anti-CD4 mAb (OKT4), or anti-CD8 mAb (OKT8).
Flow cytometric analyses
PB samples were analyzed biweekly for CFSE+ cells coexpressing markers by the use of antihuman -CD45AmCyn, -CD3APCcy7, -CD5PerCPcy5.5, -CD38PEcy7 (Becton Dickinson), and -CD19Pacific Blue (eBioscience). In some instances, CFSE+ cells were also analyzed for ROR1 expression with the use of the murine 2A2 mAb12 plus goat antimouse IgG-FITC. CountBright beads (Invitrogen) were used for absolute cell counts. When mice succumbed or were killed, BM, spleen and PB were collected for analysis.
Histology and immunohistochemistry
Antigen retrieval was performed on formalin-fixed, paraffin-embedded spleen and liver slices (5 μm) in 10mM citrate buffer with a high-pressure decloaking chamber. After incubation with primary antibodies (anti–human -CD20, -IgG, -IgM, -κ, and -λ antibodies; Dako), binding was detected with the DAKO EnVision system. For detection of ROR1 (mAb clone 1D813 ), antigen retrieval was not used. Immunofluorescent confocal microscopy was performed as described.7
SNP analysis
Genomic DNA (∼ 200 ng) was genotyped with the Illumina Human Linkage-12 beadchip containing 6090 single-nucleotide polymorphisms (SNPs) or a custom iSelect Infinium beadchip of 12 108 SNPs. Samples were processed according to manufacturer's instruction and imaged on Illumina Bead Array Reader. Normalized bead intensities were converted into SNP genotypes by Illumina Beadstudio.
Single-cell IGH variable region gene sequences
CD19+CD5+CFSE+ or CD19+CD5−CFSE− lymphocytes were sorted (FACS Aria; BD Bioscience) as single cells as reported.14 After an initial amplification with CH-specific and VH family-specific FR1 primers,11 IGH cDNA was reamplified by seminested PCR with the same VH family-specific primers and a JH consensus primer (5′ctga(ag)gagac(ag)gtgacc3′). Resulting products were sequenced.
EBV detection
The presence of EBV episomal DNA or RNA was identified in mouse PB and spleen as reported.15
Statistical analyses
Differences in CD38 expression and CLL cell numbers in mouse blood were found by use of the Wilcoxon 1-sample sign rank test. Significance of infiltration of CLL cells in BM and spleen was calculated with the Mann-Whitney U test.
Results
Human allogeneic hematopoietic elements support survival and proliferation of CLL cells. Previous attempts to adoptively transfer CLL cells into mice were possibly suboptimal because recipient animals were not sufficiently immune deficient to prevent rejection and the murine microenvironment was not adequate to support survival and growth of leukemic cells. Therefore, we created a human microenvironment in NSG mice that lacks all lymphocytes, including NK cells, by transferring 105 normal human cord blood–derived hCD34+ cells and 106 normal hBM-derived hMSCs, either by intravenous or by intrabone injection.
After transfer, human hematopoietic engraftment was considered adequate if 1%-10% hCD45-expressing cells were detected in the PB by flow cytometry. At this point, we injected 108 CLL PBMCs either into the same tibiae for mice preconditioned by intrabone injection or into the systemic circulation for mice preconditioned intravenously. Animals were bled every 2 weeks after the injection of leukemic cells to document CLL cell engraftment and division. PBMCs were transferred to retain nonleukemic elements that might facilitate CLL cell engraftment.
CD5+ is not a reliable marker for CLL cells in this model because normal human B cells developing from hCD34+ cells in NSG mice are mainly CD5+.16 Therefore, discriminate normal from leukemic cells and quantify cell divisions, patient PBMCs were labeled before injection with CFSE. We defined CLL cells as hCD45+hCD3−hCD19+hCD5+CFSE+ cells.
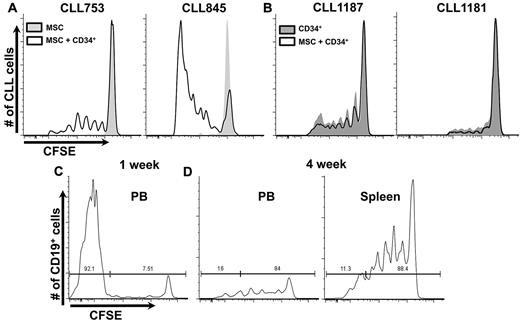
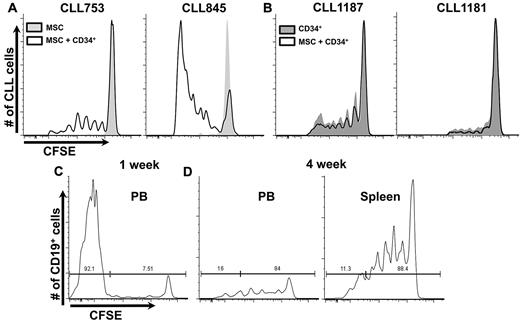
First we compared survival and growth of CLL cells in mice reconstituted intrabone solely with hMSCs to those receiving hMSCs plus hCD34+. With one exception, proliferation occurred only in animals receiving hCD34+ cells (9 CLL samples; supplemental Table 2, available on the Blood Web site; see the Supplemental Materials link at the top of the online article). The number of dividing cells and their divisions varied between samples, with cells from some patients dividing at least 6 times, after which CFSE fluorescence was too dim to distinguish positive cells (Figure 1A). Although proliferative responses were consistent for each CLL sample, the interval between CLL cell injection and the start of proliferation varied, perhaps because of differences in the microenvironment. Mice receiving both hCD34+ cells and hMSCs had more leukemic cells at first bleeding (2.4 ± 1.8-fold, P < .0001). Because most cells in the samples had not yet divided, proliferation was not responsible for differences in leukemic cell numbers. These studies indicated hMSCs were not necessary for CLL proliferation (Figure 1B), suggesting the murine mesenchymal environment could support human CLL cell growth as well as transferred hMSCs.
CLL proliferation in NSG mice. (A) Retro-orbital sinus bleeding was done at 2-week intervals. CLL cells only proliferate in presence of human hematopoietic elements. Representative example of 9 CLL samples, with a minimum of 29 mice per group (supplemental Table 2). Histograms only show CFSE+ cells. (B) hMSCs are not necessary for CLL proliferation because virtually identical CFSE dilution patterns are seen in the presence or absence of transferred hMSCs. Representative example of 4 CLL samples with a minimum of 10 mice per group (supplemental Table 2) is shown. (C) Early after CLL transfer, most B cells in PB are CFSE−, deriving from transplanted hCD34+ cells (supplemental Figure 2). (D) Late after CLL transfer, a relatively selective loss of CFSE− B cells occurs; remaining B cells are mostly CFSE+ and of leukemic origin (supplemental Figure 2).
CLL proliferation in NSG mice. (A) Retro-orbital sinus bleeding was done at 2-week intervals. CLL cells only proliferate in presence of human hematopoietic elements. Representative example of 9 CLL samples, with a minimum of 29 mice per group (supplemental Table 2). Histograms only show CFSE+ cells. (B) hMSCs are not necessary for CLL proliferation because virtually identical CFSE dilution patterns are seen in the presence or absence of transferred hMSCs. Representative example of 4 CLL samples with a minimum of 10 mice per group (supplemental Table 2) is shown. (C) Early after CLL transfer, most B cells in PB are CFSE−, deriving from transplanted hCD34+ cells (supplemental Figure 2). (D) Late after CLL transfer, a relatively selective loss of CFSE− B cells occurs; remaining B cells are mostly CFSE+ and of leukemic origin (supplemental Figure 2).
Finally, we tested whether intrabone injection was optimal for CD34+ cell and CLL cell engraftment. Despite variability, there was no evidence for superiority of intrabone over an intravenous route of injection (supplemental Figure 2). However, there were differences in the degree of autologous T-cell expansion and subsequent CLL cell proliferation occurring in the absence of allogeneic cells; with intrabone injection, only 1 of 10 cases exhibited T-cell expansion, whereas T-cell expansion occurred in 7 of 10 experiments after intravenous injection (not shown). With either route, CLL proliferation was ∼ 2- to 3-fold less in mice not receiving allogeneic cells. Notably, there was no obvious difference in CLL cell numbers or proliferation when fresh or frozen PBMCs were used.
Proliferating human B lymphocytes are leukemic in origin
Cells proliferating in vivo expressed a hCD45+hCD3−hCD19+hCD5+CFSE+ phenotype, indicating they derived from the CLL PBMC inoculum. In some experiments, expression of ROR1 further supported a CLL origin (supplemental Figure 2). Finally, sequence identity of the IGHV/D/J rearrangements from single CD19+CD5+CFSE+ cells with the CLL clone assured that the dividing human B cells were leukemic (supplemental Figure 3).
Autologous T lymphocytes are necessary for CLL cell survival and proliferation
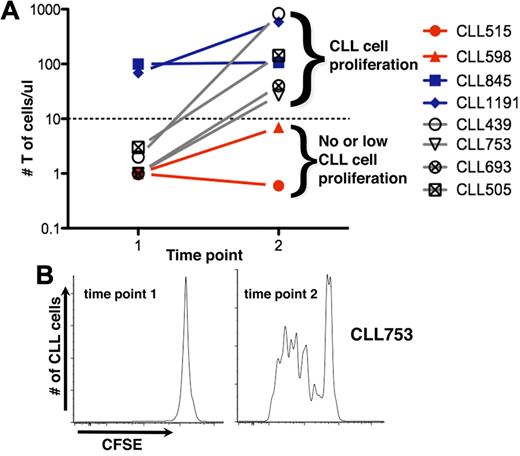
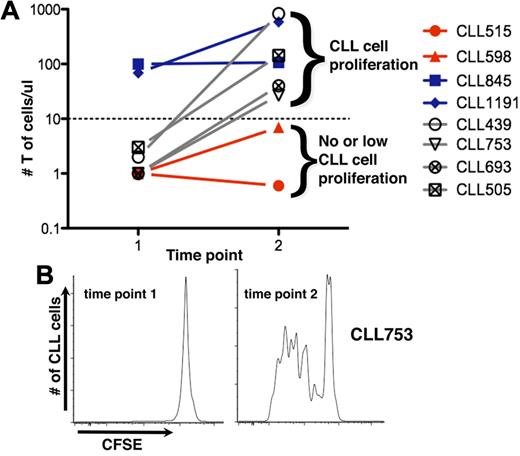
We sought to identify the hematopoietic element(s) that enabled CLL cells to efficiently engraft and grow in NSG mice. There was a direct correlation between T-cell levels in mouse blood and leukemic cell proliferation (Figure 2A). Animals with circulating T cells exceeding a threshold exhibited more robust CLL cell proliferation than animals with low T-cell numbers. In animals without T-cell expansion, CLL cell proliferation was not observed (CLL 515 and 598; Figure 2A); in animals in which T-cell numbers were initially low but subsequently increased, CLL cell division was not evident until T-cell expansion occurred (CLL 439, 505, and 639, Figure 2A; CLL753, Figure 2A-B).
T-cell expansion influences propagation of CLL cells. (A) Mean numbers of circulating T cells at 2-week intervals. CLL cells proliferate only when circulating T cells exceed a threshold (solid line); above this, additional T cells do not influence extent of CLL cell proliferation. For some cases, T-cell numbers exceed the threshold early (time point 1); for others, it takes much longer; and some the threshold is never exceeded. (B) CLL 753 as an example indicating that CLL proliferation only occurs when the threshold number is exceeded, at time point 2 (see also Figure 5D).
T-cell expansion influences propagation of CLL cells. (A) Mean numbers of circulating T cells at 2-week intervals. CLL cells proliferate only when circulating T cells exceed a threshold (solid line); above this, additional T cells do not influence extent of CLL cell proliferation. For some cases, T-cell numbers exceed the threshold early (time point 1); for others, it takes much longer; and some the threshold is never exceeded. (B) CLL 753 as an example indicating that CLL proliferation only occurs when the threshold number is exceeded, at time point 2 (see also Figure 5D).
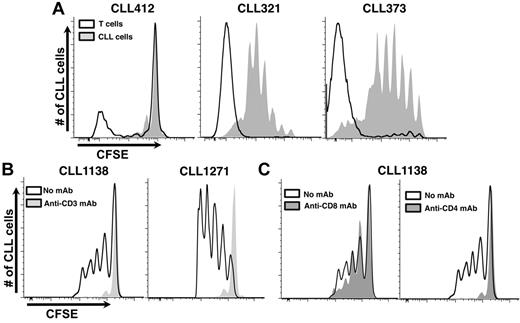
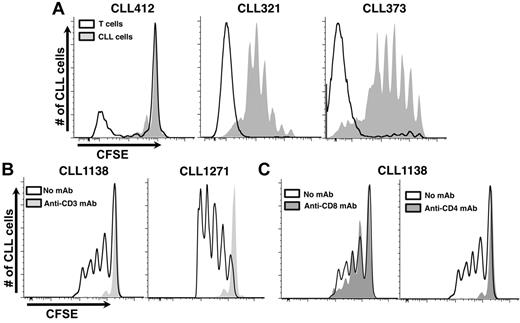
To directly document T-cell proliferation in vivo and to relate this to CLL cell expansion, we simultaneously analyzed CFSE dilution among CD3+ cells and CD5+CD19+ cells from mice receiving CLL cells from distinct donors (Figure 3A). This step could be accomplished because CFSE labeling was performed with CLL PBMCs that contained both CLL cells and autologous T cells. CLL cell proliferation was consistently preceded and accompanied by T-cell division (Figure 3A), indicating a direct correlation between them and suggesting that the relevant T cells were derived from the leukemic inoculum. SNP marker panel analyses confirmed that these T cells were indeed of patient origin and had not differentiated from hCD34+ cells. This assay, which detected T-cell populations if they exceeded 5% of the total, indicated that the majority of T lymphocytes sorted from recipient mice were patient-derived (5 different CLLs; supplemental Table 3).
Growth of CLL cells in NSG mice is T-cell dependent. (A) Simultaneous analysis of autologous T-cell and CLL-cell proliferation in vivo. Because PBMCs containing both T and B cells were labeled before transfer, the dilution of CFSE fluorescence, as an indicator of cell division, could be measured at the same time. Three representative examples are provided: CLL412 at 2 weeks after transfer and CLL321 and 373 at 4 weeks after transfer. (B) Eliminating T cells with an anti–human CD3 mAb inhibits CLL cell growth (2 representative examples from 15 CLL samples with 118 mice, minimum 55 per group). Negligible numbers of T cells were detected in the blood by immunofluorescence at the time of cell transfer/mAb treatment. (C) Eliminating CD4+ T cells aborts CLL proliferation and impairs CD8+ cell growth; eliminating CD8+ T cells does not impair CLL cell proliferation (representative example from 6 CLL samples, 60 mice, minimum 10 per group).
Growth of CLL cells in NSG mice is T-cell dependent. (A) Simultaneous analysis of autologous T-cell and CLL-cell proliferation in vivo. Because PBMCs containing both T and B cells were labeled before transfer, the dilution of CFSE fluorescence, as an indicator of cell division, could be measured at the same time. Three representative examples are provided: CLL412 at 2 weeks after transfer and CLL321 and 373 at 4 weeks after transfer. (B) Eliminating T cells with an anti–human CD3 mAb inhibits CLL cell growth (2 representative examples from 15 CLL samples with 118 mice, minimum 55 per group). Negligible numbers of T cells were detected in the blood by immunofluorescence at the time of cell transfer/mAb treatment. (C) Eliminating CD4+ T cells aborts CLL proliferation and impairs CD8+ cell growth; eliminating CD8+ T cells does not impair CLL cell proliferation (representative example from 6 CLL samples, 60 mice, minimum 10 per group).
In vivo elimination of CD3+ or CD4+ cells abrogates CLL cell survival and proliferation
To prove that T cells were crucial in the model, animals were treated with anti-CD3 mAbs at the time of CLL PBMC injection. For 15 samples (supplemental Table 2), leukemic cell proliferation did not occur in animals receiving anti-CD3 mAbs (Figure 3B). In 3 samples (CLL 321, 505, and 1281), proliferation occurred after T-cell depletion, although cell outgrowth required more time than samples with adequate numbers of T lymphocytes, and these samples came from patients with more aggressive disease (supplemental Table 1). Administration of anti-CD4 mAbs also completely aborted CLL cell growth, whereas anti-CD8 mAbs had little effect (Figure 3C).
Cotransfer of mature allogeneic APCs supports CLL proliferation
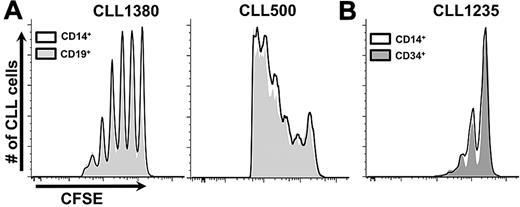
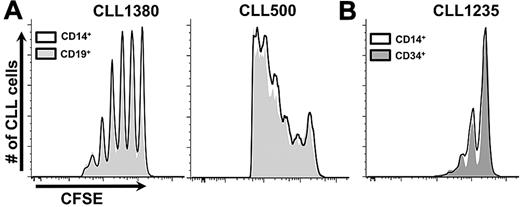
We reasoned that autologous T lymphocytes were activated in vivo to provide “help” for B-cell proliferation and that this activation resulted from stimulation by allogeneic APCs arising from hCD34+ cells that matured down myelomonocytic or B-cell lineage pathways.16,17 To test this and to define necessary normal allogeneic hematopoietic element(s), we transferred normal mature allogeneic APCs (CD14+ or CD19+ cells) simultaneously with patient PBMCs. Coadministration of normal mature monocytes or B cells with CLL PBMCs supported robust leukemic cell proliferation (Figure 4A).
Coinfusion of mature CD14+ or CD19+ cells and CLL cells obviate necessity for preconditioning with hCD34+ cells. (A) Two examples shown (7 CLL samples, in 37 mice with at least 10 per group). See “Cotransfer of mature allogenic APCs supports CLL proliferation” for experimental details. (B) CLL 1235 as an example of preconditioning with hCD34+ cells or CD14+ cells from the same CB sample equally supporting CLL growth (3 CLL samples, minimum 6 mice per group).
Coinfusion of mature CD14+ or CD19+ cells and CLL cells obviate necessity for preconditioning with hCD34+ cells. (A) Two examples shown (7 CLL samples, in 37 mice with at least 10 per group). See “Cotransfer of mature allogenic APCs supports CLL proliferation” for experimental details. (B) CLL 1235 as an example of preconditioning with hCD34+ cells or CD14+ cells from the same CB sample equally supporting CLL growth (3 CLL samples, minimum 6 mice per group).
We next compared mice reconstituted with immature hCD34+ cells to those receiving mature monocytes at the time of CLL cell injection. Both hCD34+ cells and mature CD14+ cells were isolated from the same CB sample, with the hCD34+ fraction transferred immediately into NSG animals and the CD14+ fraction used ∼4 weeks later. In addition, the same CLL PBMC sample was inoculated into the 2 sets of mice. Because injection of CLL cells into each set of animals was performed at the same time, a temporal comparison of CLL cell engraftment and growth between the conditions was made. CLL engraftment and growth were almost indistinguishable between the 2 sets of animals (Figure 4B).
To ensure that CLL cells were not dividing because of in vivo growth of patient B cells latently infected with EBV,3 we searched for EBV DNA in spleen cells from 35 mice (26 receiving hCD34+ cells and 9 allo-APCs) reconstituted with 14 different patient samples. EBV DNA was found in only 5 mice, and 2 of these had CD5− B-cell expansions (not shown).
Finally to define which cell fractions contained EBV, we searched for EBV RNA in CD5+ and CD5− splenic B-cell populations from 27 mice (6 receiving hCD34+ cells and 21 allo-APCs) given 14 different patients' PBMCs (not those mentioned). EBV RNA was not found in any CD5+ B cells; EBV transcripts were identified in CD5− B cells from 1 mouse that had received hCD34+ cells (not shown).
Thus, the key to CLL cell survival and expansion in this model was activation of autologous T lymphocytes apparently resulting from recognition of allogeneic APCs that either developed in vivo after preconditioning animals with hCD34+ cells or were transferred as mature cells.
CD38 expression on CLL cells in the murine circulation reflects that in patient's blood
CD38 expression by CLL clones has prognostic and physiologic importance; patients with more circulating CD38+ cells follow a more aggressive clinical course,18 possibly because of signaling through CD38.19 Consistent with this, the CD38+ fraction of CLL clones is enriched in cells expressing proliferation markers.20,21
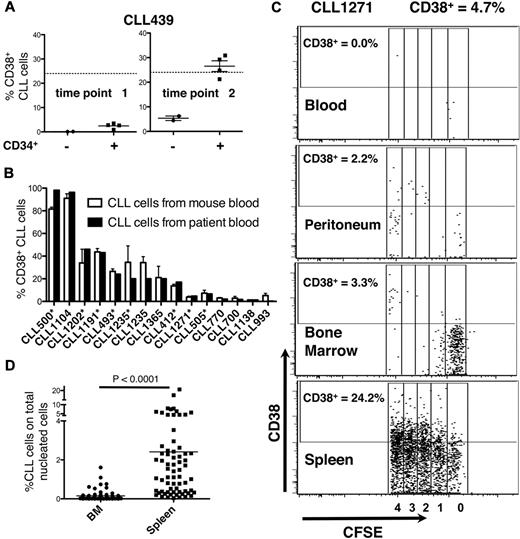
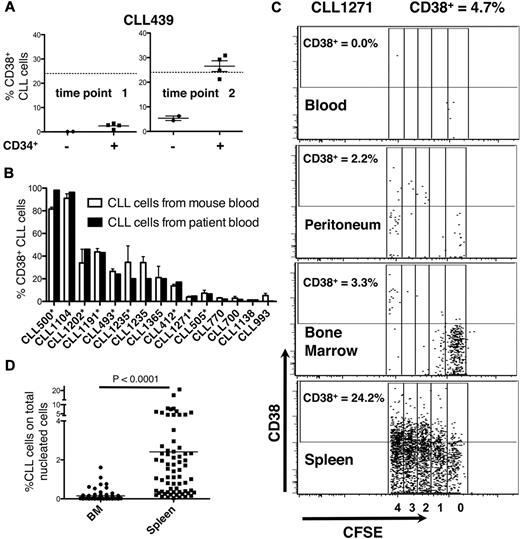
We therefore studied CD38 expression on CLL cells in mouse blood. The greatest amounts of CD38+ cells were found in animals reconstituted with conditions promoting CLL proliferation in vivo (Figure 5), whereas the lowest were in mice in whom division never occurred or before the onset of CLL cell division (Figure 5A). Remarkably, the percentage of circulating CD38+ CLL cells in mice closely approximated that in patient's blood (Figure 5B). Both of these findings were similar in mice preconditioned with hCD34+ cells or given mature APCs at the time of transfer (supplemental Table 1).
Expression of CD38. (A) The number of CD38+ cells in murine blood relates to CLL cell proliferation. At the first time point, CLL cells do not divide and the number of CD38+ leukemic cells is low. CD38-expressing CLL cells reach maximal levels at the second time point when CLL cells have divided, approximating that in donor patient's blood (solid line). (B) The percent of CD38-expressing cells in mouse blood correlates closely with that in patient's blood (10 CLL samples, 42 mice). Asterisks indicate experiments in which hCD34+ cells were administered. Note that the levels of CD38-expressing cells are similar between murine and human blood regardless of the system (hCD34+ cells or mature alloAPCs) used to permit CLL cell expansion in vivo. (C) Note that the activation states of CLL cells differ on the basis of anatomic location. Although there is considerable leukemic cell proliferation occurring in the spleen and 24.2% cells express CD38, there is negligible division occurring in PB, peritoneum, and BM. Data collected at death or time of sacrifice. (D) CLL (CD19+CD5+CFSE+) cells in the spleen far outnumber those in BM.
Expression of CD38. (A) The number of CD38+ cells in murine blood relates to CLL cell proliferation. At the first time point, CLL cells do not divide and the number of CD38+ leukemic cells is low. CD38-expressing CLL cells reach maximal levels at the second time point when CLL cells have divided, approximating that in donor patient's blood (solid line). (B) The percent of CD38-expressing cells in mouse blood correlates closely with that in patient's blood (10 CLL samples, 42 mice). Asterisks indicate experiments in which hCD34+ cells were administered. Note that the levels of CD38-expressing cells are similar between murine and human blood regardless of the system (hCD34+ cells or mature alloAPCs) used to permit CLL cell expansion in vivo. (C) Note that the activation states of CLL cells differ on the basis of anatomic location. Although there is considerable leukemic cell proliferation occurring in the spleen and 24.2% cells express CD38, there is negligible division occurring in PB, peritoneum, and BM. Data collected at death or time of sacrifice. (D) CLL (CD19+CD5+CFSE+) cells in the spleen far outnumber those in BM.
Comparison of circulating and tissue-bound leukemic cell activation and proliferation
In patients, clonal proliferation occurs primarily in solid lymphoid tissues within structures known as proliferation centers (PCs)22 ; these are aggregates of larger CLL cells with denser CD38 expression admixed with activated T lymphocytes.7 We compared levels of proliferation and CD38 expression of cells in mouse BM, spleen, and peritoneal cavity with those in mouse blood (Figure 5C). Proliferation (measured by CFSE dilution) and activation (measured by CD38 expression) of circulating CLL cells were often significantly less than in solid tissues (Figure 5C). There was a hierarchy in proliferation and CD38 expression in the various sites (spleen > BM > peritoneum and PB; Figure 5C), although occasionally more CD38+ cells were found in BM than spleen.
Localization and characterization of CLL cells in solid tissues
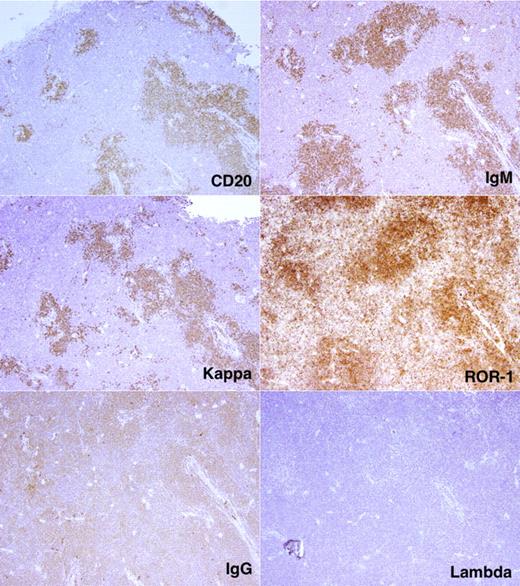
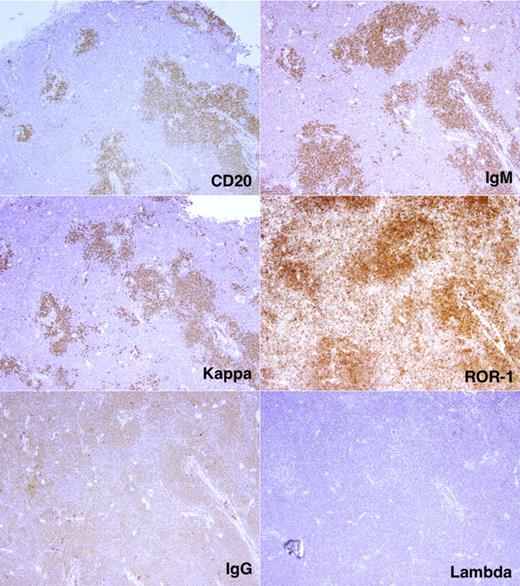
By using flow cytometry, we found many more CD19+CD5+CFSE+ cells among the total nucleated cells in spleen than BM (23.6 ± 19.3-fold; P < .0001; Figure 5D). To correlate CFSE+ cell numbers by flow cytometry with immunohistochemical findings, we divided tissues into 2 fragments and performed flow cytometry on dissociated cells from one fragment and immunohistochemistry on the nondissociated fragment. In this way, we identified follicular structures, composed of CD20+ cells, in mouse spleens. These cellular accumulations, which were usually in close proximity to blood vessels and contained monotypic L chain aggregates expressing the same IgH chain, were confirmed as CLL-derived by IHC analyses that documented ROR1 expression (Figure 6), a marker expressed almost exclusively on human CLL cells.23-25 CD20+ lymphocytes were also interspersed in the tissue and outside of the follicular structures, but these cells usually contained more Ig than those in the follicular structures and expressed IgM or IgG as well as κ and λ L chains; these were presumably residual normal B and plasma cells. Finally, T lymphocytes were found in and around follicular structures (Figure 7), further suggesting a role for T cells in CLL growth in these animals.
Localization and characterization of CLL cells in NSG spleen. CD20+ cells with monotypic IGH (μ) and immunoglobulin light (κ) chains form follicular structures in the spleen. These cells are also ROR1+. Note the intimate relationship between the follicular structures and blood vessels.
Localization and characterization of CLL cells in NSG spleen. CD20+ cells with monotypic IGH (μ) and immunoglobulin light (κ) chains form follicular structures in the spleen. These cells are also ROR1+. Note the intimate relationship between the follicular structures and blood vessels.
T cells localize preferentially in follicular structures found in the spleen. Spleen tissue with follicular structures stained with anti-CD20 (green) and anti-CD3 (red) mAbs. Images were taken with an Olympus IX70 confocal microscope, at 25°C, with the use of UPlanAPO 10×/0.40 objective. Antibodies were labeled with DyLight 488 and 649 (Jackson ImmunoResearch Laboratories Inc) excited with one 30-mW argon laser at 488 nm and one 5-mW helium-neon laser exciting at 633 nm. Samples were mounted in SlowFade Gold antifade reagent and data acquired with proprietary image acquisition software (Olympus).
T cells localize preferentially in follicular structures found in the spleen. Spleen tissue with follicular structures stained with anti-CD20 (green) and anti-CD3 (red) mAbs. Images were taken with an Olympus IX70 confocal microscope, at 25°C, with the use of UPlanAPO 10×/0.40 objective. Antibodies were labeled with DyLight 488 and 649 (Jackson ImmunoResearch Laboratories Inc) excited with one 30-mW argon laser at 488 nm and one 5-mW helium-neon laser exciting at 633 nm. Samples were mounted in SlowFade Gold antifade reagent and data acquired with proprietary image acquisition software (Olympus).
T-cell expansion is eventually associated with GVHD and B-cell elimination
Although T-cell expansion was virtually required for CLL cell survival and proliferation, eventually all human B cells disappeared from recipient mice. This loss was seen initially among normal CFSE− cells (Figure 1C) and subsequently among CFSE+ CLL cells. Animals succumbed within ∼ 12 weeks of CLL cell injection. Before death, mice exhibited lethargy, weight loss, hunched posture, ruffled fur, and hair loss. Postmortem examination revealed marked liver infiltration by human T cells (not shown), consistent with a graft-versus-host reaction.26
Discussion
In this study, we set out to develop a reproducible adoptive transfer model for engraftment and growth of human CLL cells in alymphoid NSG mice, immunologically inert recipients that allow growth of human cells.27 By a series of exclusionary experiments, we identified minimal conditions from those we originally considered optimal for CLL cell growth, ie, a human microenvironment of mesenchymal and hematopoietic elements.
We determined that the murine mesenchymal microenvironment was adequate because CLL cells grew well in mice with an endogenous murine BM microenvironment (Figure 1B). This finding is consistent with in vitro findings that murine stroma and cell lines support CLL cell survival28 and suggest that trophic signals between CLL cells and biochemical and cellular elements within the BM are evolutionarily conserved between mice and humans.
We also found that 2 distinct human hematopoietic cell types facilitated growth of CLL cells in vivo. One of these was an autologous element—T lymphocytes from the CLL patient (Figures 2 and 3). Although they represented a minor component of the transferred PBMCs (supplemental Table 1), autologous T lymphocytes were key mediators of leukemic cell growth. Derivation of these cells from the patient inoculum was documented by SNP analyses and by transferring only mature allogeneic CD14+ cells with CLL PBMCs. There was a direct correlation between T-cell levels (Figure 2) and their level of proliferation (Figure 3A) and CLL cell division in vivo; also selective depletion of CD3+CD4+ cells aborted CLL proliferation (Figure 3B-C).
These findings appear at variance with those of Shimoni et al4 and Dürig et al,5 who found that transfer of CLL PBMCs from early-stage (Rai 04 or Binet A5) stable patients did not lead to significant CLL cell growth but rather to T-cell expansion, suggesting T lymphocytes prevented outgrowth of leukemic clones. However, when these investigators transferred PBMCs from patients with advanced stages (Rai III and IV4 or Binet C5) and more aggressive disease, there were greater numbers of CLL cells than T cells, implying that a T-cell–mediated regulatory capacity was lost. Furthermore, Shimoni et al4 found that elimination of T cells by anti-CD3 mAb led to enhanced engraftment and survival. However, the duration of these studies was short (∼ 2 weeks), analysis of CLL clone distribution limited (only peritoneal cavity), and evidence for CLL cell growth (as opposed to survival) lacking. In contrast, our data suggest a virtual requirement for T cells for CLL cell proliferation and up-regulation of CD38. Moreover, although these investigators found a correlation between the aggressiveness of CLL and clonal engraftment,4,5 we did not see a statistically significant relationship between markers of clonal aggressiveness (CD38, ZAP-70, and IGHV mutation status) and growth of CLL cells in a total of 37 cases (supplemental Table 1).
Discrepancies with these studies may relate to differences in experimental conditions. Because the T-cell effects in our model are biphasic (advantageous initially and then disadvantageous), differences between models may be technical on the basis of T-cell numbers and subsets at various points in time. Indeed, preliminary data suggest that the CD4/CD8 ratios of T cells in the blood change over time and that those in the spleen can be opposite those in the blood (supplemental Figure 4). In addition, strains used in the former studies were γc+/+; hence, those mice could have developed murine NK cells that might have influenced the biology of human leukemic and nonleukemic cells in vivo.
The other human hematopoietic cell type that facilitated growth of CLL cells in vivo was allogeneic—APCs (CD14+ or CD19+ cells; Figure 4). Recognition of allo-determinants on APCs led to autologous T-cell activation which permitted CLL cell growth. Thus, adoptive cotransfer of CLL PBMCs, either intravenously or intrabone, with normal APCs from an unrelated normal subject (preferably CD14+ that do not contain B lymphocytes that might confuse subsequent analyses) led to reproducible survival and proliferation of CLL cells in vivo.
Because autologous T-cell expansion occurred reproducibly in animals in whom allogeneic non-T cells were present, an allogeneic mixed lymphocyte reaction likely occurred in vivo, with responding T cells being CLL-derived and stimulating APCs derived from allogeneic hCD34+ cells or from mature allogeneic APCs. Presentation of xenoantigens to CLL T cells could also initiate T-cell responses.
Collectively, these findings raise several intriguing possibilities. First, from a technical point of view, alloreactivity is unlikely the only T-cell stimulus permitting CLL growth after transfer. If other in vivo or in vitro autologous T-cell activation methods suffice (eg, prestimulation with autologous nurse-like cells or by mitogens and antigens), allogeneic APCs may be unnecessary. In addition, because T-cell activation leading to CLL cell growth occurs with a single injection of mature APCs (Figure 4), the stimulatory “agent” may not need to be present for a prolonged time because it is unlikely that many allogeneic monocytes or B cells survive long after adoptive transfer because the initial numbers transferred were relatively small, their mature state would not be conducive to self-renewal and irradiation of APCs did not affect B-cell stimulation (data not shown). Thus, the duration of CLL T-cell activation to initiate CLL expansion could be short or such activation might be unnecessary in some instances as it could arise via a xeno-mixed lymphocyte reaction; finding that intravenous injection of CLL cells occasionally led to T-cell expansion in the absence of allogeneic APCs is consistent with this and supports a key role for CLL T-cell activation, initiated by any stimulus.
Second, a role for autologous T cells may exist in the human disease. Although we1 and others29 have suggested that at least a subset of CLL clones (especially those with unmutated IGHV) are driven through the transformation process by T-cell–independent, nonprotein microbial and autoantigens, these in vivo data suggest that T-cell stimulation, either directly by cell contact or indirectly by release of cytokines and chemokines, is critical for the growth of CLL cells, regardless of IGHV mutation status. Other data support roles for T cells and natural killer cells in CLL, including in situ studies of lymphoid tissues.6,7,28
Finally, our results suggest alloreactivity reenergizes patient-derived T cells, which usually do not help generate effective cytotoxic T cells against the leukemic clone or for B-cell differentiation, deficiencies that might relate to defective T-cell/B-cell synapse formation.30 This finding is consistent with the loss of normal and leukemic B lymphocytes as autologous T-cell expansion advanced. Of note, the disappearance of human B cells initially occurred primarily among CFSE− (most likely CD34-derived) cells and then extended to CFSE+ CLL cells (Figure 1C), suggesting that graft-versus-tumor effects may take longer to evolve than graft-versus-host responses; this delay is consistent with the T-cell compartment in CLL often being ineffective at recognizing and reacting to leukemic cells, at least in vitro,31 and with CLL B cells having poor antigen-presenting capacities.32
The B-cell expansions we observed were rarely EBV-driven. EBV DNA was found in human B cells from the spleens of only 5 of 35 mice that received 6 different patient samples and cells from 2 of these were only CD5−. Furthermore, when CD5+ and CD5− B cells from 27 different mice that received 9 different patients' PBMCs were searched for EBV RNA, viral transcription was only found in CD5− B cells of one animal. It is known that EBV infection of normal B lymphocytes down-regulates CD5,33 and EBV+ CLL cell lines (eg, MEC1 and 234 ) and normal human B-cell lines35 do not express CD5. The absence of EBV-driven clonal growth in this model is different from that found in other settings3 and may reflect a reenergized CLL T-cell compartment that eliminates EBV+ clones as they emerge.
Because CLL cells were labeled with CFSE, we could quantify cell division, at least within ∼ 6 cycles (Figure 1) and determine relative birth rates in blood, BM, and spleen (Figure 5C). It was clear that many more CLL cells completed the cell cycle in solid tissues. Furthermore, CLL cells in spleen were organized in nodular structures resembling PCs seen in patient LNs and BMs22 ; finding T cells in and around these structures (as in human CLL6,7,28 ) reinforces their playing an active role in CLL cell growth in the model (Figure 7) and possibly in patients.
The number of CD38+ leukemic cells in the blood of animals was negligible unless CLL cell division occurred (Figure 5), suggesting that CD38+ cells initially transferred either lost CD38 expression, died, or were retained in extravascular areas (solid tissues or peritoneal cavity) and could not circulate. There was a hierarchy of CD38-expressing and -proliferating cells in the model: spleen ≥ BM ≫ peritoneum and peripheral blood (Figure 5C-D), reminiscent of that in patients (LN > BM > blood36 ).
On the basis of CD38 expression, extent of proliferation, and infiltration of analyzed tissues, the spleen appears to be a preferential site for CLL cell survival and division in the model; this was especially obvious when CLL cells were injected directly into BM cavities. Although spleen is not necessarily a major site of proliferation in the human disease, this finding is in line with recent kinetic studies suggesting CLL cells proliferate more vigorously in LNs than BM.37 Because NSG mice do not develop LNs, the only secondary lymphoid tissue available is spleen, although this organ can serve as a hematopoietic organ in mice. Alternatively and not mutually exclusive, trafficking of CLL cells may differ in the model from that in patients. CLL cells, which can differ from normal human B lymphocytes in LFA-1 expression, home more effectively to spleen than other lymphoid organs when injected intravenously into immune-deficient NOD/SCID mice.38 This could reflect reduced surface levels38 or differential glycosylation39 of LFA-1.
Finally, we were struck by the concordance in the percentage of CD38+ leukemic cells circulating in mouse blood with that in patients' blood (Figure 5A-B). How the circulatory capacity of CD38-expressing cells is controlled so accurately, regardless of the species in which CLL cells reside, is unclear. This may be an intrinsic property of individual leukemic clones that is influenced by differences in the stoichiometric relationship between CXCR4 and CD38 on CLL cell surface40 or the consequence of engagement of CD38 with its ligand, CD31, on endothelial cells.19
This model has several advantages over those described previously. Most importantly, it uses primary CLL cells, not normal,41 transgenic42,43 murine cells, or immortalized CLL cell lines,44 and therefore may more faithfully reflect the biologic capacities of CLL cells in patients. In addition, because CLL cells are labeled with dye that partitions in daughter cells with each division, the number and extent of cell division is quantifiable. In addition, the model may be helpful in conducting preclinical tests on novel therapeutic agents, as suggested by preliminary experiments with transferred normal cord blood-derived NK cells.45 Finally, the model infers an importance for T cells in human CLL. When normal T cells are activated in vivo, they foster expansion of B lymphocytes and generation of cytotoxic T cells. The former may be an unappreciated variable in the growth of CLL clones in patients. Although as a whole the T-cell compartment in CLL may be tolerized, activated T lymphocytes localized to PCs in patients' LNs and BMs appear competent, and these may lead to survival and expansion of the leukemic clone in patients.28 In this model, CLL T-cell competence is restored and possibly exaggerated by alloantigen and to a lesser extent xenoantigen stimulation. Identification and characterization of the T-cell subsets involved in CLL cell growth (and elimination) and their level of receptor diversity are currently under study.
The apparent requirement for T-cell help may relate to certain clinical observations. In patients receiving allogeneic stem cells, persistence of autologous T cells (“mixed T-cell chimerism”) associates with diminished benefit, possibly because of trophic effects on leukemia cells. In addition, T-cell help for CLL cell survival and growth might relate to the effectiveness of nucleoside analog therapy and anti-CD52 immunotherapy, which effectively eliminate T cells and thereby any support they could provide to leukemic cells. Regarding T-cell immune surveillance, our model suggests that, after activation, CLL T cells respond not only to xeno- and allo-antigens. Because CLL cells are eventually eliminated, autologous T cells may also respond to antigens expressed on CLL cells (“autologous GVHD”).46 This might relate to findings that injection of autologous CLL cells transduced with CD40L leads to T-cell activation and CLL cell elimination,47 that administration of lenalidomide affects the quality of T/B-cell interactions and T-cell competency,38 and to the uncommon, spontaneous regression/ disappearance of CLL48 that can occur after antigenic challenges from infection, onset of autoimmune phenomena,49 or a second malignancy.50 Finally, activated autologous T cells are 2-edged swords in the model. Because the T-cell compartment in human CLL is not activated globally (but mainly in PCs), the cycling fraction is likely small. In this model, in which a major fraction of the T-cell compartment is activated, the natural history of human CLL is recapitulated but at an accelerated rate. Furthermore, heightened T-cell activation leads to an apparent graft-versus-host reaction that eventually leads to death of the animals. To circumvent these problems, studies are currently underway to control or replace autologous T cells or T-cell subsets.
Despite these limitations, the present model uses relatively simple conditions to make adoptive transfer and clonal expansion of CLL cells in NSG mice possible, straightforward, and convenient. Its use may help understand normal and abnormal aspects of CLL biology.
An Inside Blood analysis of this article appears at the front of this issue.
The online version of this article contains a data supplement.
The publication costs of this article were defrayed in part by page charge payment. Therefore, and solely to indicate this fact, this article is hereby marked “advertisement” in accordance with 18 USC section 1734.
Acknowledgments
These studies were supported in part by The Karches Foundation, The Prince Foundation, The Marks Foundation, The Jerome Levy Foundation, The Leon Levy Foundation, the Tebil Foundation Inc, and the Joseph Eletto Leukemia Research Fund. D.B. was an Ambassador Felix Schnyder Postdoctoral Research Fellow of the Lauri Strauss Leukemia Foundation. P.P. is supported by Leukemia and Lymphoma Research, UK.
Authorship
Contribution: D.B., C.C., S.M., P.P., R.S., X.Y.J, A.L., and P.K.G. designed research, performed research, analyzed data, and wrote the paper; M.K., S.L.A., J.E.K., S.B., C.R., H.M., H.R., and K.R.R. contributed vital reagents and reviewed the paper; P.C. performed research and reviewed the paper; and N.C. designed research, analyzed data, and wrote the paper.
Conflict-of-interest disclosure: The authors declare no competing financial interests.
Correspondence: Nicholas Chiorazzi, The Feinstein Institute for Medical Research, 350 Community Dr, Manhasset, NY 11030; e-mail: NChizzi@NSHS.edu.

