Abstract
The ZMYM2-FGFR1 (formerly known as ZNF198-FGFR1) fusion kinase induces stem cell leukemia–lymphoma syndrome (SCLL), a hematologic malignancy characterized by rapid transformation to acute myeloid leukemia and T-lymphoblastic lymphoma. In the present study, we demonstrate frequent, constitutive activation of Notch1 and its downstream target genes in T-cell lymphomas that arose in a murine model of ZMYM2-FGFR1 SCLL. Notch up-regulation was also demonstrated in human SCLL- and FGFR1OP2-FGFR1-expressing KG-1 cells. To study the role of Notch in T-cell lymphomagenesis, we developed a highly tumorigenic cell line from ZMYM2-FGFR1–expressing cells. Pharmacologic inhibition of Notch signaling in these cells using γ-secretase inhibitors significantly delayed leukemogenesis in vivo. shRNA targeting of Notch1, as well as c-promoter–binding factor 1 (CBF1) and mastermind-like 1 (MAML1), 2 essential cofactors involved in transcriptional activation of Notch target genes, also significantly delayed or inhibited tumorigenesis in vivo. Mutation analysis demonstrated that 5′ promoter deletions and alternative promoter usage were responsible for constitutive activation of Notch1 in all T-cell lymphomas. These data demonstrate the importance of Notch signaling in the etiology of SCLL, and suggest that targeting this pathway could provide a novel strategy for molecular therapies to treat SCLL patients.
Introduction
Stem cell leukemia–lymphoma syndrome (SCLL)1 is an atypical myeloproliferative disease–associated lymphoma.2 Hepatosplenomegaly is common in SCLL patients, and, except for some cases with B-cell acute lymphoblastic lymphoma,3 most patients exhibit T-lymphoblastic lymphoma. The clinical course for SCLL is aggressive, with rapid transformation to acute myeloid leukemia (AML) and lymphoblastic lymphoma of common T-cell origin.3-5 Conventional chemotherapy is often not effective,3 making early allogeneic transplantation the only treatment.6 The characteristic 8;13 reciprocal chromosome translocation7 results in a chimeric protein consistently involving the fibroblast growth factor receptor-1 (FGFR1).5 To date, ∼ 10 different gene partners have been shown to fuse to FGFR1, including ZMYM2,4,7 CEP110,8 and FGFR1OP,9 among other more rare combinations.10 In all cases, the fusion partner provides a dimerization domain for constitutive activation of FGFR1. ZMYM2-FGFR1 is the most common translocation, in which the zinc-finger–containing N-terminal part of ZMYM2 enables dimerization of FGFR1.4 The FGFR1 rearrangement can be found in both myeloid and lymphoid cells in SCLL patients, suggesting a multipotent hematopoietic progenitor cell origin. Constitutive activation and mislocalization of the FGFR1 kinase leads to abnormal phosphorylation of downstream proteins such as PLCγ, PI3K, and various members of the STAT family of transcription factors.11-13
We described previously a mouse model of ZMYM2-FGFR1 SCLL that closely resembles the clinical characteristics of patients with the ZMYM2-FGFR1 translocation, having a distinct myeloproliferative disorder and severe T-lymphoblastic leukemia. The constitutive and ligand-independent activation of the FGFR1 signal transduction pathway is believed to be essential for disease pathogenesis.13,14 Evidence of tumor oligoclonality and normal differentiation of thymocytes in these animals, however, indicates that additional genetic alterations are required for disease development and progression. Array comparative genomic hybridization demonstrated Tcra and Tcrd gene deletion in leukemic cells in these animals. Lymphomas were CD4+/CD8+ double-positive (DP), representing an arrest in the late stages of T-cell development, because rearrangement of Tcra is critical for these final maturation stages. However, because Tcra-null mice do not develop T-cell lymphoma,15,16 it is clear that deletion of Tcra in itself is also not sufficient to induce T-lymphoblastic lymphoma, suggesting that ZMYM2-FGFR1–induced tumorigenesis requires additional genetic or epigenetic changes.
We have undertaken a genome-wide gene-expression analysis of the tumors that arise in lymphoid organs in this animal model, in which a consistent observation has been the up-regulation of the Notch pathway. This pathway has been shown to play a pivotal role in the development of T-cell acute lymphoblastic leukemia (T-ALL) in both humans and mice.17 Notch1 encodes a transmembrane receptor that is expressed on HSCs and T cells. Four mammalian Notch receptors, Notch1-4, and 5 Notch ligands, Jagged 1 (Jag1) and Jag2 and Delta-like 1 (DLL1), DLL3, and DLL4, have been identified. Ligand receptor binding causes a series of proteolytic cleavages that release the intracellular portion of Notch (ICN), which then translocates to the nucleus, where it binds to CBF1 transcription factor. In the absence of ICN, CBF1 represses transcription by interacting with various corepressors. When ICN binds to CBF1, it recruits the mastermind-like 1 (MAML1) coactivator, which binds to ICN, thereby converting the CSL complex into a transcriptional activator.17 Modulation of Notch signaling can be achieved pharmacologically using γ-secretase inhibitors (GSIs), which effectively prevent activation of all Notch receptors by inhibiting their proteolytic cleavage.18
In the present study, we show that pharmacologic inhibition of γ-secretase leads to reduced levels of activated Notch1, which results in a concomitant down-regulation of Notch1 target genes in cells derived from ZMYM2-FGFR1 lymphomas. Furthermore, treatment with the GSI N-[N-(3,5-difluorophenacetyl)-L-alanyl]-S-phenylglycine t-butyl ester (DAPT) prolongs survival of syngeneically transplanted mice, and transcriptional knock-down of either Notch1 or MAML1 can also delay—and in some cases prevent—leukemogenesis.
Methods
Cell cultures and proliferation assay
ZNF112 and KG-1 cells were cultured in RPMI medium (Invitrogen) plus 10% FBS (Hyclone), at 37°C in 10% CO2. For drug treatments, 40 000 cells/well were seeded in 96-well plates, incubated overnight, and then treated with DAPT (Alexis Biochemicals), Comp E (Calbiochem), or ethanol (control) at concentrations defined by the experiments. Cell viability was determined using Cell Titer-Glo luminescence cell viability kits (Promega) and a SpectraMax M5e (Molecular Probes) luminescence plate reader. Coculture of ZNF112 cells with OP9-DLL1 and control OP9-GFP stromal cell lines was as described previously.19 To assess cell proliferation, PKH26 (Sigma) was added and cells were fixed for flow cytometric analysis.
Molecular cytogenetic analysis
Flow cytometric analysis and cell sorting
Homogenized tissues were passed through a cell strainer (BD Biosciences) to generate single-cell suspensions. Bone marrow cells were isolated by flushing mouse femurs with PBS and stained using specific conjugated monoclonal antibodies (supplemental Table 1, available on the Blood Web site; see the Supplemental Materials link at the top of the online article). Flow analysis and cell sorting of normal HSCs (Lin−Sca-1+c-Kit+), leukemic stem cells (LSCs; Lin−Sca-1+c-Kit+GFP+), or DP (CD4+CD8+) thymocytes were as described previously.22
Molecular analyses
Western blot analysis used standard protocols with the respective primary antibodies (supplemental Table 1). RNA was isolated using TRIzol (Invitrogen) and complementary DNA was generated using SuperScript (Invitrogen). Amplification was performed using standard PCR (New England Biolabs) in combination with the specific primers and conditions described in supplemental Table 2. Real-time quantitative RT-PCR was performed using an iCycler (Bio-Rad) with iQ SYBR Green Super Mix (Bio-Rad) and the same primers used in the standard PCR. The transcription levels were normalized to GAPDH. Expression values were calculated using the 2−ΔΔCt method relative to the GAPDH gene.
Gene-expression profile analysis
RNA was isolated from HSCs (Lin−Sca-1+c-kit+) and LSCs based on the GFP+Lin−Sca-1+c-kit+ markers described previously.22 To minimize biologic variability, each HSC-sorting experiment used bone marrow cells from 5 normal female Balb/c mice. LSCs were obtained from bone marrow or spleen cells from 2-3 leukemic mice. Gene-expression profiles of T-lymphoma and Thy1+ DP cells were obtained from 3 independently sorted Thy1+ DP cell samples (each sample was derived from thymuses from 3 normal Balb/c mice). The T-lymphoma samples were derived from the third serially transplanted diseased mice, in which > 90% of cells were GFP+Thy1+DP. To investigate whether the sorting process influenced gene expression, one T-lymphoma sample was sorted for GFP+Thy1+ DP cells. RNA was amplified using a GeneChip Two-Cycle Target Labeling and Control Reagents kit (Affymetrix), and cRNA was hybridized to the Affymetrix Mouse 430 2.0 arrays.
Raw .CEL files were processed using robust multiarray averaging (http://genepattern.broadinstitute.org). MetaCore (GeneGo; www.genego.com) was used for pathway analyses, and gene set enrichment analysis (GSEA) was performed as outlined on the Broad Institute website (http://www.broadinstitute.org/gsea/index.jsp). Differential expression was analyzed using GenePattern (http://genepattern.broadinstitute.org/gp/pages/index.jsf). The data processing is described in more detail in the supplemental Methods. All microarray data are available at the Gene Expression Omnibus under accession number GSE28823.
shRNA knock-down of Notch1 and its coactivators
Retroviral shRNAs (Open Biosystems); Notch1 (one target sequence), MAML1 (3 target sequences), shRNA-luciferase control vector, and shCBF1 constructs were from Dr Nicholas Gaiano (Johns Hopkins University, Baltimore, MD). Retroviral supernatants (≥ 5 × 10⁶ CFU/μL) were generated and introduced into cells as described previously,22 followed by puromycin selection. shCBF1-infected cells were sorted for RFP.
Animals and treatment schedule
Six- to 8-week-old Balb/c mice (Taconic) were injected through the tail vein.22 One week after injection 5 mice each were randomized to treatment with vehicle control or DAPT (Alexis Biochemicals). DAPT was reconstituted with 100% ethanol and stored in aliquots as a stock solution (20 mg/mL) at −20°C. Each day, fresh stock solution was diluted into a mixture of corn oil and ethanol to a final concentration of 5% ethanol. DAPT was given at a dose of 4 mg/kg/d by IP injection.23 All treatments were performed 6 days per week for 4 weeks. This experiment was independently replicated. In a second experiment, DAPT was given at a dose of 8 mg/kg with no significantly different effect on survival. Because both doses gave the same results, we pooled the data in the final analysis. Mice were evaluated daily for signs of morbidity, weight loss, failure to thrive, and splenomegaly. All animal experiments were carried out under protocols approved by the Institutional Animal Care and Use Committee of the Medical College of Georgia.
Human SCLL analysis
Normal and BCR-ABL–positive human blood lymphocytes and bone marrow samples were obtained from the Medical College of Georgia Tumor Bank under approved institutional review board protocols. The SCLL blood sample was obtained as described previously.24 Samples were first thawed and cultured in 20% FBS RPMI medium for 2 hours before performing flow cytometric analysis. Human antibodies are listed in supplemental Table 3.
Mutation detection
Results
ZMYM2-FGFR1 induces aggressive T-cell leukemia/lymphoma with high Notch1 expression.
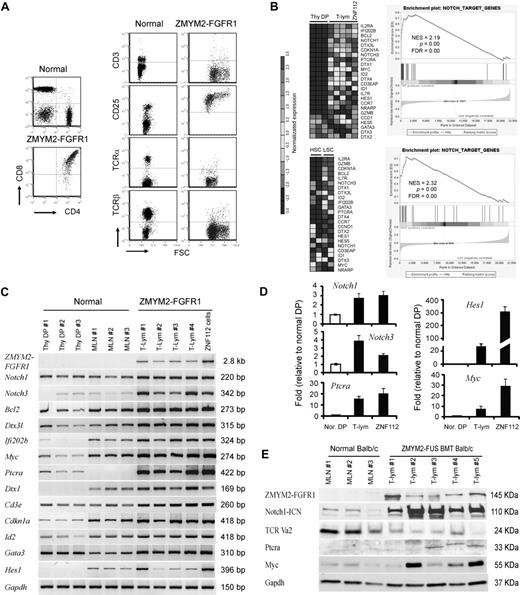
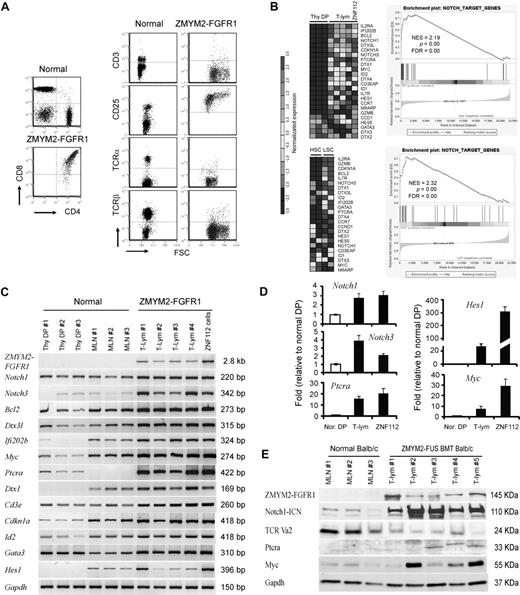
ZMYM2-FGFR1 induces both myeloproliferative disorder and T-lymphoblastic leukemia in Balb/c mice after retroviral transduction of bone marrow cells.22 Serial transplantation of the bone marrow cells from these primary recipients resulted in a more severe T-lymphoblastic lymphoma in successive transplants. All tumor cells expressed Ptera, were CD4+/CD8+, and displayed persistent expression of CD25+. Consistent with those results, in the present study, deletion of Tcra resulted in a loss of cell-surface TCRβ and CD3 in tumor cells (Figure 1A), suggesting a block in T-cell differentiation at the final maturation stage in which CD4+ or CD8+ single-positive cells would be generated through positive and negative T-cell selection.
Notch1 and its direct target genes are up-regulated in T-lymphomas from ZMYM2-FGFR1–transduced mice. (A) The immunophenotype of lymphocytes from the diseased mice shows that the majority are CD4+CD8+ with high CD25 expression. Relatively few cells expressed cell-surface TCRα, TCRβ, or CD3. (B) Heat map (left panel) showing up-regulation (P < .05) of transcript levels of Notch1 and its direct target genes in sorted LSCs (GFP+Lin-Sca-1+c-kit+) compared with sorted normal HSCs (Lin-Sca-1+c-kit+) and Thy1+ DP thymocytes (Thy DP) from normal Balb/c mice. GSEA (right panel) showed that most Notch1 direct target genes are highly up-regulated in T-lymphoma (for further details, see the supplemental Methods). (C) Semiquantitative RT-PCR analysis of Notch1 and its direct target genes in sorted, normal DP thymocytes (Thy DP), unsorted normal Balb/c mesenteric lymph node cells (LN), and lymphomas from individual diseased founders (T-lym) and ZNF112 cells, confirms the microarray observations. (D) Real-time RT-PCR confirmation of up-regulation of several well-characterized Notch1 target genes. (E) Western blot analysis showing that the protein levels of both activated Notch1 (intracellular domain) and its downstream target genes, Ptera and Myc, are significantly increased in T-cell lymphoma (T-lym) compared with cells from normal Balb/c mesenteric lymph nodes (MLN).
Notch1 and its direct target genes are up-regulated in T-lymphomas from ZMYM2-FGFR1–transduced mice. (A) The immunophenotype of lymphocytes from the diseased mice shows that the majority are CD4+CD8+ with high CD25 expression. Relatively few cells expressed cell-surface TCRα, TCRβ, or CD3. (B) Heat map (left panel) showing up-regulation (P < .05) of transcript levels of Notch1 and its direct target genes in sorted LSCs (GFP+Lin-Sca-1+c-kit+) compared with sorted normal HSCs (Lin-Sca-1+c-kit+) and Thy1+ DP thymocytes (Thy DP) from normal Balb/c mice. GSEA (right panel) showed that most Notch1 direct target genes are highly up-regulated in T-lymphoma (for further details, see the supplemental Methods). (C) Semiquantitative RT-PCR analysis of Notch1 and its direct target genes in sorted, normal DP thymocytes (Thy DP), unsorted normal Balb/c mesenteric lymph node cells (LN), and lymphomas from individual diseased founders (T-lym) and ZNF112 cells, confirms the microarray observations. (D) Real-time RT-PCR confirmation of up-regulation of several well-characterized Notch1 target genes. (E) Western blot analysis showing that the protein levels of both activated Notch1 (intracellular domain) and its downstream target genes, Ptera and Myc, are significantly increased in T-cell lymphoma (T-lym) compared with cells from normal Balb/c mesenteric lymph nodes (MLN).
We undertook a global gene-expression analysis of leukemic T cells from the animal model compared with Thy1+ DP cells isolated from normal Balb/c thymuses. The primary analysis used cells derived from lymph nodes from third in vivo passage animals that were shown to be > 90% Thy1+/GFP+/DP by flow analysis. Pathways significantly dysregulated by ZMYM2-FGFR1 were analyzed using the Metacore (GeneGo) data analysis workflow. The Notch pathway was among those most significantly affected, as confirmed using GSEA (Figure 1B). To further validate the microarray results, we performed semiquantitative RT-PCR (Figure 1C), real-time RT-PCR (Figure 1D), and Western blot analysis (Figure 1E) for most genes. Up-regulation of Notch1 and its target genes, including Notch3, were clearly seen in T-cell lymphomas.
We demonstrated previously in our serial transplantation study22 that the GFP+ LSK subpopulation of cells has leukemia-initiating properties. To determine whether the same pathways are affected in these cells, we used flow-sorted GFP+ LSK cells from the bone marrow or spleens of 2-3 individual diseased mice, as well as LSK+ HSC cells from 5 normal Balb/c mice, and analyzed them using Affymetrix Mouse430 2.0 arrays. This analysis demonstrated an expression pattern of genes related to Notch signaling very similar to that seen in T-lymphoma samples (Figure 1B). Interestingly, most of the direct target genes of Notch1 related to T-lineage commitment were highly up-regulated in LSCs compared with their normal counterparts (HSCs). These included Il2rα, Bcl2, Notch3, Dtx3l (deltex 3-like), GATA3, Ptera, and Il7rα, indicating that the oncogenic action of ZMYM2-FGFR1 targets stem cells or multipotential progenitor cells that are committed to the T-lineage at a very early stage.
Characterization of ZNF112, a cell line derived from ZMYM2-FGFR1–expressing cells.
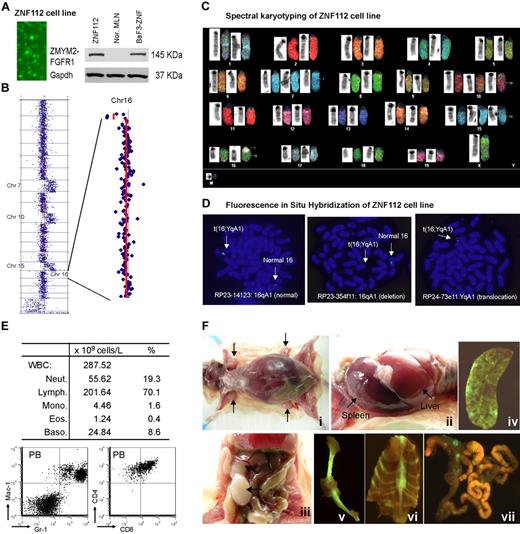
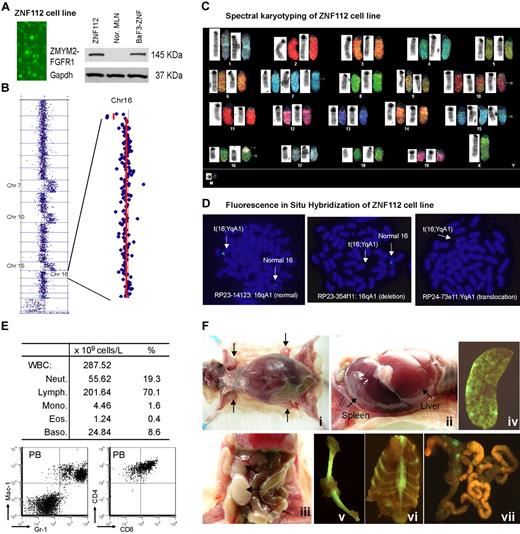
No human or mouse cell lines expressing the ZMYM2-FGFR1 fusion kinase have been reported, although the KG-1 human cell line expresses the rare FGFR1OP2-FGFR1 variant.26 Routine culture of tumor cells from donor mice produced one progressively growing cell line (ZNF112) that was GFP+ and constitutively expressed ZMYM2-FGFR1 (Figure 2A).
Characterization of the ZNF112 cell line. (A) Fluorescence microscopy shows that all ZNF112 cells are GFP+ with stable expression (Western blot) of the ZMYM2-FGFR1 fusion protein. The murine pro-B-cell line BaF3 expressing ZMYM2-FGFR1 (BaF3-ZNF) was used as a positive control, and mesenteric lymph node cells (MLN) provide the negative control. (B) CGH array analysis of ZNF112 cells shows additional copies of chromosomes (Chr) 7, 10, 15, and loss of regions within 16qA1 and 14qC2. (C) Spectral karyotyping analysis confirmed the aCGH profiles for ZNF112 cells and also shows loss of the Y chromosome and an additional unidentified marker chromosome (M). (D) FISH using RP23 BAC clones identifies the 16;Y translocation (see text). (E) Leukemias resulting from syngeneic grafts of ZNF112 cells into mice without irradiation show high numbers of white blood cells that are Gr1+ and Mac1+ (F). Mice with ZNF112 grafts show hepatosplenomegaly and enlarged lymph nodes with GFP+ cells.
Characterization of the ZNF112 cell line. (A) Fluorescence microscopy shows that all ZNF112 cells are GFP+ with stable expression (Western blot) of the ZMYM2-FGFR1 fusion protein. The murine pro-B-cell line BaF3 expressing ZMYM2-FGFR1 (BaF3-ZNF) was used as a positive control, and mesenteric lymph node cells (MLN) provide the negative control. (B) CGH array analysis of ZNF112 cells shows additional copies of chromosomes (Chr) 7, 10, 15, and loss of regions within 16qA1 and 14qC2. (C) Spectral karyotyping analysis confirmed the aCGH profiles for ZNF112 cells and also shows loss of the Y chromosome and an additional unidentified marker chromosome (M). (D) FISH using RP23 BAC clones identifies the 16;Y translocation (see text). (E) Leukemias resulting from syngeneic grafts of ZNF112 cells into mice without irradiation show high numbers of white blood cells that are Gr1+ and Mac1+ (F). Mice with ZNF112 grafts show hepatosplenomegaly and enlarged lymph nodes with GFP+ cells.
ZNF112 demonstrated the typical 14qC2 loss seen in all lymphomas developed from different founder mice.22 In addition, ZNF112 cells had also acquired an extra copy of chromosomes 7, 10, and 15 (Figure 2B)22 and a novel deletion involving Chr16:3943952-5671686 (Figure 2B). Spectral karyotyping confirmed aCGH changes and identified a 16;Y translocation (Figure 2C). FISH analysis using bacterial artificial chromosome (BAC) clones RP23-14123 and RP23-354f11 located within the 16A1 deletion identified only the normal copy of chromosome 16, confirming the deletion on the derivative chromosome. Using a BAC from outside the deletion highlighted the presence of signal on both the normal and the translocated chromosomes. FISH analysis using the YqA1 BAC RP24-73e11 demonstrated the presence of the Y-centromeric region on the rearranged chromosome 16, confirming the origin of the rearrangement (Figure 2D).
When ∼106 ZNF112 cells were injected into 6- to 8-week-old, unirradiated normal female Balb/c mice (n = 7), aggressive disease developed within 3-12 weeks. All mice showed increased white blood cell counts, with increased proportions of myeloid cells (Figure 2E). Flow cytometry showed a right shift for Gr-1+Mac-1+ peripheral blood (PB) cells (Figure 2E) and lymphocytes were CD4+ CD8+, as seen in the SCLL primary tumor cells. Further analysis of ZNF112 mice showed that 3%-4% of the PB and spleen Mac1+Gr-1+cells were GFP+ (supplemental Figure 1A), suggesting that ZNF112 represents an early progenitor lymphoid cell that can differentiate into myeloid lineage cells. In addition, the GFP−Mac-1+Gr-1+ population was increased > 5-fold in the ZNF112 mice compared with normal Balb/c mice (supplemental Figure 1A), suggesting that ZNF112 cells had either lost GFP expression during in vivo differentiation or that ZNF112 cells can “stimulate” normal Mac1+Gr1+ proliferation. We also consistently observed subcutaneous bleeding in the legs, back, and mouth in ZNF112 mice (supplemental Figure 1B), which served as a gross phenotype for diseased animals. These mice frequently died from multiple organ failure involving lung, liver, and kidney due to leukocyte infiltration. ZNF112 tumor cells from transplanted mice were identical to those seen in ZMYM2-FGFR1 primary tumors,22 being CD4+, CD8+, CD25high, and cell-surface TCRα− and TCRβ− (supplemental Figure 1C). Mice receiving ZNF112 cells also showed splenomegaly, hepatomegaly, and T-lymphoblastic lymphoma, as evidenced by enlarged lymph nodes containing immature lymphocytes (Figure 2F).
Hierarchical clustering analysis showed that the gene-expression pattern from ZNF112 cells was almost identical to that seen in the primary lymphoma tissues (both sorted and unsorted) compared with normal Balb/c Thy1+ DP thymocytes (supplemental Figure 2). The same expression pattern was also observed for genes involved in Notch signaling compared with primary tumors (Figure 1B). Because of the close relationship with the primary tumors, this cell line clearly provides a valuable in vitro model with which to investigate the effects of targeting the Notch pathway using specific inhibitors.
GSIs impair Notch signaling in ZNF112 cells, leading to growth inhibition and suppression of leukemogenesis
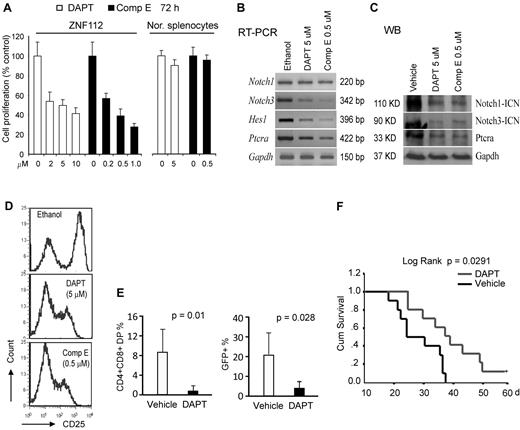
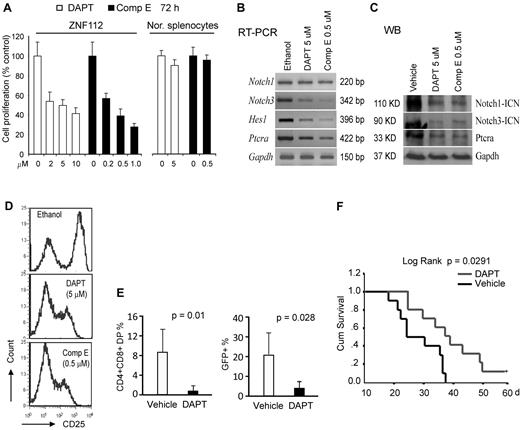
When ZNF112 cells were treated with the DAPT or Comp E GSIs27 at their half-maximal growth inhibition (GI50) dosage, both independently reduced the cell proliferation rate (Figure 3A) and the transcript levels of direct Notch1 target genes, including Notch3, HES1, and Ptera (Figure 3B). Western blot analysis showed that both DAPT and Comp E significantly inhibited Notch1 activation and Ptera transcription (Figure 3C). Consistent with inhibition of Notch activation, both compounds alone could also remarkably reduce membrane expression of CD25 (Figure 3D), thus impairing Notch1 signaling in ZNF112 cells.
Pharmacologic inhibition of Notch 1 signaling suppresses in vitro growth and in vivo tumorigenesis of ZNF112 cells. (A) GSIs, DAPT, and Comp E significantly inhibit ZNF112 cell growth in vitro at micromolar concentrations. Neither DAPT nor Comp E significantly inhibited normal splenocyte viability at their GI50 dosages. (B) DAPT and Comp E at the GI50 dose inhibited expression of Notch 1 direct target genes, but not Notch1 itself. (C) The ICN (activated Notch1) expression levels were dramatically reduced after treatment with both DAPT and Comp E, as were the Notch3 and Ptera target genes. (D) Flow cytometric analysis showing that both DAPT and Comp E can inhibit cell-surface expression of the CD25 Notch1 target gene in ZNF112 cells (the left peak in each case represents the intrinsic background autofluorescence). (E) Peripheral blood CD4+/CD8+ and GFP+ cells were remarkably decreased after 3 weeks in DAPT-treated mice compared with vehicle-treated mice. (F) Treatment with DAPT can markedly prolong survival of mice transplanted with ZNF112 cells.
Pharmacologic inhibition of Notch 1 signaling suppresses in vitro growth and in vivo tumorigenesis of ZNF112 cells. (A) GSIs, DAPT, and Comp E significantly inhibit ZNF112 cell growth in vitro at micromolar concentrations. Neither DAPT nor Comp E significantly inhibited normal splenocyte viability at their GI50 dosages. (B) DAPT and Comp E at the GI50 dose inhibited expression of Notch 1 direct target genes, but not Notch1 itself. (C) The ICN (activated Notch1) expression levels were dramatically reduced after treatment with both DAPT and Comp E, as were the Notch3 and Ptera target genes. (D) Flow cytometric analysis showing that both DAPT and Comp E can inhibit cell-surface expression of the CD25 Notch1 target gene in ZNF112 cells (the left peak in each case represents the intrinsic background autofluorescence). (E) Peripheral blood CD4+/CD8+ and GFP+ cells were remarkably decreased after 3 weeks in DAPT-treated mice compared with vehicle-treated mice. (F) Treatment with DAPT can markedly prolong survival of mice transplanted with ZNF112 cells.
To determine whether disrupting Notch signaling could block/delay tumorigenesis, ZNF112 cells (2 × 10⁶) were introduced into syngeneic Balb/c mice and treatment was initiated 8 days later. Two and 3 weeks after treatment, PB samples were collected for flow analysis of GFP, CD4, and CD8. Seven days after the initiation of drug treatment, very few (< 0.5%) DP cells were found in either group of mice. After 2 weeks, however, there were significantly (P < .01) fewer DP cells in the PB from DAPT-treated mice compared with mice treated in parallel with the control vehicle (Figure 3E and supplemental Figure 3A). Three to 4 weeks after transplantation, 80% of the mice in the control group showed the typical bleeding phenotype associated with leukemia, often with paralysis of their hind legs, whereas 80% mice in the treatment group did not (supplemental Figure 3B). In addition, CD4+CD8+GFP+ cells were significantly reduced in the blood of the treated mice compared with controls (Figure 3E). Survival time was markedly prolonged in DAPT-treated mice (Figure 3F). One mouse from the treated group survived more than 12 months before being killed.
Knockdown of either Notch1 or MAML1 can significantly inhibit ZNF112 tumorigenesis
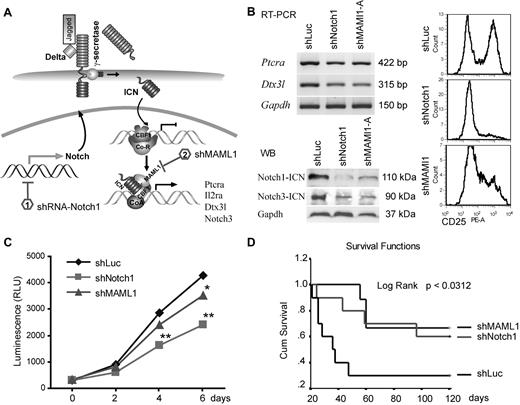
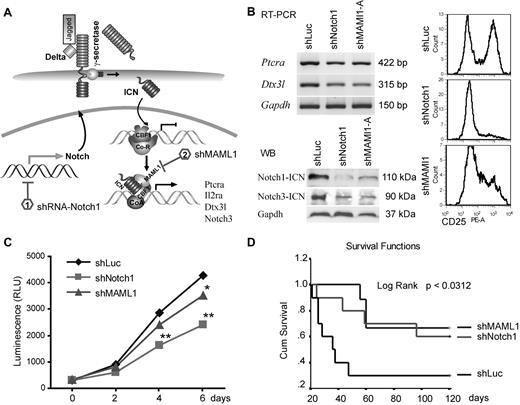
Although GSI treatment suggested that Notch1 is important for ZMYM2-FGFR1 lymphoma development, γ-secretases target > 20 different substrates with many other biologic functions.28 Moreover, in clinical trials, GSIs produced severe gastrointestinal toxicity. Therefore, to avoid the potential off-target effects of GSIs, we used shRNAs to specifically knock down key components of Notch signaling (Figure 4A and supplemental Figure 4B). ZNF112 cells were infected with retroviral shRNA constructs targeting either Notch1 or MAML1, and stable, antibiotic-resistant cell pools were established. For further analysis of the shMAML1 knock-down cells, we selected clones derived from one of the 3 constructs exhibiting significant reduction of cell-surface CD25 compared with clones carrying the shLuc control vector (supplemental Figure 4A). RT-PCR analysis of these cells showed that both Ptera and Dtx3l expression levels were significantly down-regulated compared with parental cells carrying a control shLuc construct (Figure 4B). Immunoblots clearly indicated that shNotch1 and shMAML1 cells had remarkably diminished levels of both activated Notch1 (Figure 4B) and CD25 (Figure 4B), and their growth rate was also significantly reduced compared with controls (Figure 4C), indicating that ZNF112 cell growth is dependent on Notch signaling.
shRNA down-regulation of Notch signaling inhibits growth of ZNF112 cells and diminishes/reduces leukemogenesis in mice grafted with ZNF112 cells. (A) Schematic view of the Notch1 signaling pathway identifying the target points of the shRNAs. (B) ZNF112 cells infected with retroviral shNotch1 or shMAML1 resulted in down-regulation of Ptera and Dtx3l transcription levels (top left panel). The activated form of Notch3 was also down-regulated (bottom left panel), as was cell-surface expression of CD25 (right panel). (C) Stable knock-down of either Notch1 or its coactivator, MAML1, led to reduced in vitro proliferation in ZNF112 cells. (D) Syngeneic female Balb/c mice were transplanted with ZNF112 cells (n = 10) carrying shNotch1, shMAML1, or shLuc (control). Survival time in the mice receiving the Notch-inhibited cells was markedly prolonged.
shRNA down-regulation of Notch signaling inhibits growth of ZNF112 cells and diminishes/reduces leukemogenesis in mice grafted with ZNF112 cells. (A) Schematic view of the Notch1 signaling pathway identifying the target points of the shRNAs. (B) ZNF112 cells infected with retroviral shNotch1 or shMAML1 resulted in down-regulation of Ptera and Dtx3l transcription levels (top left panel). The activated form of Notch3 was also down-regulated (bottom left panel), as was cell-surface expression of CD25 (right panel). (C) Stable knock-down of either Notch1 or its coactivator, MAML1, led to reduced in vitro proliferation in ZNF112 cells. (D) Syngeneic female Balb/c mice were transplanted with ZNF112 cells (n = 10) carrying shNotch1, shMAML1, or shLuc (control). Survival time in the mice receiving the Notch-inhibited cells was markedly prolonged.
When shNotch1 or shMAML1 cells (1 × 10⁶, n = 10) were injected into Balb/c mice, tumorigenesis was significantly delayed or completely prevented (Figure 4D). More than 60% of mice from these groups are currently still alive (> 8 months) without GFP+CD4+CD8+ cells in the PB. Moreover, we also knocked down CBF1 in ZNF112 cells (in this case coexpressing RFP). This construct has previously been shown to abrogate Notch signaling in mouse neural stem cells.29 Ninety-five percent of flow-sorted shCBF1 knock-down cells demonstrated both GFP and RFP fluorescence (supplemental Figure 4C), and also showed significantly decreased levels of CD25 (supplemental Figure 4D). The FACS-sorted shCBF1 ZNF112 cells (1 × 10⁶ per mouse) were then injected into 5 normal, unirradiated Balb/c mice, all of which are currently still alive (supplemental Figure 4E) and no GFP+ or RFP+ cells were detected in any of the blood samples obtained from these mice after 4 months (supplemental Figure 4F). However, when these RFP+ cells were injected into nude mice, enlarged lymph nodes with GFP+RFP+ cells were seen in all 3 animals (supplemental Figure 4G), suggesting that the shCBF1 cells were still weakly tumorigenic. These data further demonstrate the importance of Notch signaling in leukemogenesis induced by the chimeric ZMYM2-FGRF1 kinase.
Promoter region deletions induce aberrant activation of Notch1 in ZMYM2-FGFR1 induced T-lymphoma
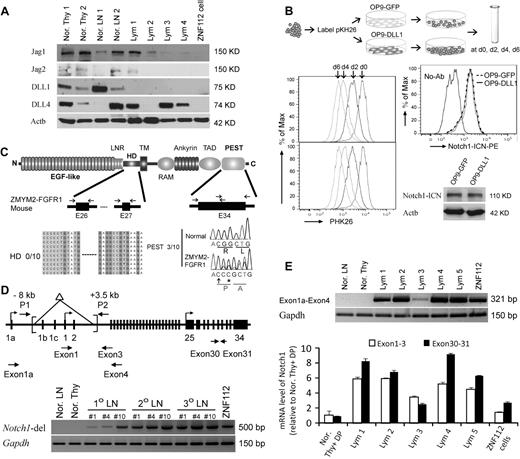
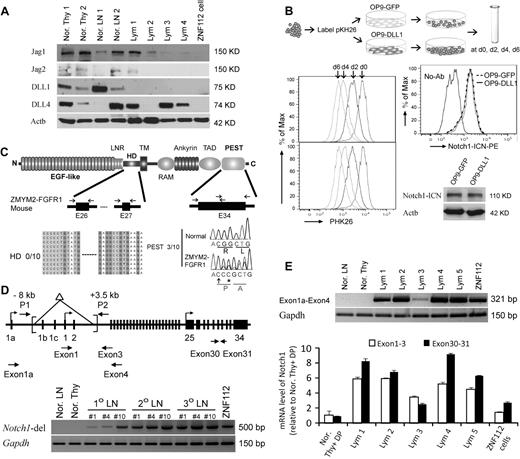
Analysis of Notch1 ligands in lymphomas induced by ZMYM2-FGFR1 demonstrated that Jag1, Jag2, DLL1, and DLL4 were either not changed or decreased compared with normal thymuses and lymph nodes (Figure 5A). Because all 4 ligands were absent in ZNF112 cells, Notch1 activation is ligand independent. Whether cocultured with OP9-DLL1 cells, which constitutively express DLL1, or with OP9-GFP cells, which do not, the ZNF112 growth rate was not affected (Figure 5B). Consistently, exposure to the DLL1 ligand did not increase activated Notch1 levels (Figure 5B).
Constitutive activation of Notch1 in ZMYM2-FGFR1 lymphomas is ligand independent. (A) Western blot analysis showing that the Notch ligands Jag1, Jag2, DLL1, and DLL4 were either not changed or decreased in lymphoma (Lym) samples compared with normal thymuses (Nor. Thy) and lymph nodes (Nor. LN). (B) When ZNF112 cells were labeled with PKH26 (see “Cell cultures and proliferation assay”) and cultured on DLL1 or GFP retrovirally transduced murine OP9 stromal cells (OP9-DLL1 or OP9-GFP, respectively), similar growth patterns (left) were seen, as were levels of the activated form of Notch1, as demonstrated by flow cytometry and Western blotting. (C) Mutations were not detected in the Notch1 heterodimerization (HD) domain (n = 10). A single base insertion (arrow) and a single base substitution (asterisk) were identified near the PEST domain of Notch1 in ZMYM2-FGFR1 lymphomas, which would produce a frameshift with the generation of a predicted downstream stop codon at codon 2490. (D) Notch1 gene schematic showing the relative locations of the primers used to analyze the deletion mutants (top). A 5′ deletion (brackets) creates a 500-bp fragment using the P1/P2 primers. In normal cells, the wild-type ∼11.5-kb fragment cannot be amplified (bottom). (E) RT-PCR showed that the alternative Notch1 transcript (exon 1a-exon 4) was only found in tumor samples (top), whereas real-time RT-PCR showed that Notch1 transcription levels for exons 30-31 was higher than that for exons 1-3 (bottom) in the majority of lymphomas compared with normal cells.
Constitutive activation of Notch1 in ZMYM2-FGFR1 lymphomas is ligand independent. (A) Western blot analysis showing that the Notch ligands Jag1, Jag2, DLL1, and DLL4 were either not changed or decreased in lymphoma (Lym) samples compared with normal thymuses (Nor. Thy) and lymph nodes (Nor. LN). (B) When ZNF112 cells were labeled with PKH26 (see “Cell cultures and proliferation assay”) and cultured on DLL1 or GFP retrovirally transduced murine OP9 stromal cells (OP9-DLL1 or OP9-GFP, respectively), similar growth patterns (left) were seen, as were levels of the activated form of Notch1, as demonstrated by flow cytometry and Western blotting. (C) Mutations were not detected in the Notch1 heterodimerization (HD) domain (n = 10). A single base insertion (arrow) and a single base substitution (asterisk) were identified near the PEST domain of Notch1 in ZMYM2-FGFR1 lymphomas, which would produce a frameshift with the generation of a predicted downstream stop codon at codon 2490. (D) Notch1 gene schematic showing the relative locations of the primers used to analyze the deletion mutants (top). A 5′ deletion (brackets) creates a 500-bp fragment using the P1/P2 primers. In normal cells, the wild-type ∼11.5-kb fragment cannot be amplified (bottom). (E) RT-PCR showed that the alternative Notch1 transcript (exon 1a-exon 4) was only found in tumor samples (top), whereas real-time RT-PCR showed that Notch1 transcription levels for exons 30-31 was higher than that for exons 1-3 (bottom) in the majority of lymphomas compared with normal cells.
Because Notch1 is frequently activated by a mutation within the HD and PEST domains in both human T-ALL (> 50%)18 and various murine T-ALL models (> 60%),25,30 we sequenced these domains in ZMYM2-FGFR1 T-lymphomas. Exons 26 and 27, representing the HD domain, and exon 34, representing the PEST domain, were sequenced in 10 tumor samples derived from 5 different founder mice (Figure 5C). Three of 10 lymphomas showed the same single-base (cytosine) insertion, together with a single-base guanine-to-cytosine substitution (Figure 5C). These 3 tumor samples were all derived from the same primary recipient and its serial secondary and tertiary transplantation. HD and PEST mutations were not identified in ZNF112 cells. Therefore, it appears that mutations in these domains is not a frequent event (20%) in ZMYM2-FGFR1 lymphomas.
To determine whether Notch1 activation is due to activation of FGFR1 or ZMYM2-FGFR1 per se, we cotransfected 293T cells with ZMYM2-FGFR1 and a Notch1-luciferase reporter. After 48 hours, no significant increase in luciferase activity was observed compared with cells cotransfected with the MIEG3 empty vector (supplemental Figure 5A). Similarly, when treated with FGF1 and FGF2, 293T cells transfected with the Notch1 reporter showed no increased luciferase activity. In addition, although it clearly decreased phospho-FGFR1 levels in ZNF112 cells, TKI258 (FGFR1 inhibitor) treatment did not affect activated Notch1 levels (supplemental Figure 5B). Therefore, Notch1 expression is not regulated directly by either ZMYM2-FGFR1 or FGFR1 activation, which is consistent with ZMYM2-FGFR1 localization in the cytoplasm.31,32
Recently, several studies have demonstrated that Notch1 activation results from the deletion of its primary promoter in murine T-ALL and cell lines.33-35 To determine whether this is also the case for ZMYM2-FGFR1 lymphomas, we reanalyzed primary tissues from different founder mice reported by Ren et al,22 and showed that they all harbored exon1b/exon2 Notch1 deletions (Figure 5). These deletions were identical to those seen in Ikaros-deficient T-ALL.35 Exon 1 deletions prevent wild-type Notch1 transcription. In these tissues, however, we were still able to amplify a wild-type fragment containing exon 1-3 (Figure 1C-D), suggesting a heterogeneous population of cells with the deletion in tumor samples and ZNF112 cells. To support this hypothesis, we used 2 different sets of primers to amplify within the C- and N- terminal regions of Notch1, respectively. Quantitative RT-PCR demonstrated that carboxyl-terminal transcript levels (exons 30-31) were higher than N-terminal (exon 1-3) levels (Figure 5E) in the lymphomas, whereas this difference was not observed in normal lymph nodes and thymuses. Furthermore, we also detected alternative promoter activation (transcripts from exon 1a) from the Notch1 locus in tumor samples (Figure 5D). These results indicate that constitutive activation of Notch1 in T-ALL from ZYMY2-FGFR1 mice is due mainly to deletion mutations, whereas the aberrant increase in transcription may be through use of an alternative Notch1 promoter.
Activation of Notch1 is also seen in a human ZMYM2-FGFR1–transformed cells and the KG-1 cell line
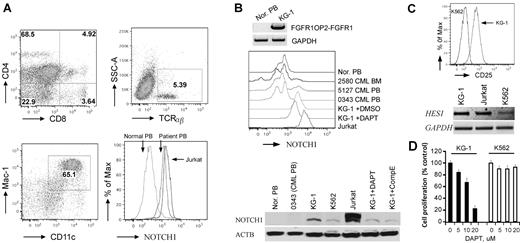
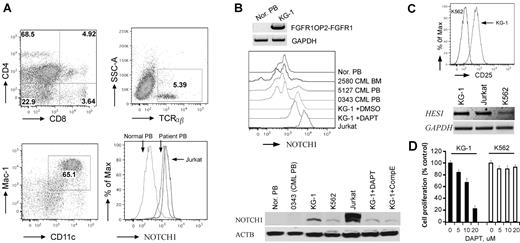
To determine whether Notch is up-regulated in human ZMYM2-FGFR1 leukemias, we analyzed cells from a patient24 who carried the t(8;13)(p12;q12) translocation. Flow analysis showed that the PB contained ∼ 5% CD4+CD8+ DP T cells (Figure 6A), which is consistent with observations in almost all reported cases of ZMYM2-FGFR1 SCLL for which immunophenotypes have been determined.1,36-38 In this patient, cells with the Mac-1+ and CD11c+ myeloid markers were increased by 28% compared with normal blood (Figure 6A), and B220+ cells showed no significant, or possibly slightly reduced levels (date not shown). These results confirmed involvement of both T and myeloid lineages. Flow analysis using the mN1A Notch1 antibody (recognizing both human and mouse intracellular Notch1) demonstrated that intracellular Notch1 levels were increased in the ZMYM2-FGFR1 white blood cells compared with that in the normal sample (Figure 6A). Because ∼ 5% of cells in the PB were CD4+/CD8+ T cells (Figure 6A), this indirectly suggested that higher levels of activated Notch1 were present in this patient. In addition, Western blot analysis using the V1744 antibody revealed constitutively activated Notch1 in human KG-1 cells harboring the FGFR1OP2-FGFR1 variant fusion gene,39 whereas it was not seen in normal and BCR-ABL–positive primary human cells (Figure 6B). When KG-1 was treated with either DAPT or Comp E, a reduction of activated Notch1 was seen (Figure 6B), which is consistent with cell growth inhibition (Figure 6D). In addition, the IL2RA and HES1 transcripts were significantly increased in KG-1 cells compared with K562 cells (Figure 6C). Based on the COSMIC study (http://www.sanger.ac.uk/genetics/CGP/cosmic), however, the deletion mutations described in the analysis of the murine cells were not detected in the Notch1 locus from KG-1 cells. Sequence analysis of the HD and PEST domains of Notch1 also did not detect any mutations (data not shown). Therefore, the mechanism of Notch1 activation in KG-1 cells is unclear. Flow cytometric analysis showed that KG-1 cells express high levels of CD34 and lymphoid lineage markers such as CD4 and CD8 (supplemental Figure 7), suggesting that the KG-1 cells were at a very immature stage with T-lymphoid/myeloid potential.
Notch1 is highly activated in human SCLL cells. (A) Flow cytometric analyses of PB from the 8;13 EMS showing a CD4+/CD8+ immunophenotype, with most cells expressing both CD4 and CD8 at intermediate levels (top left). Fewer TCRα+ and TCRβ+ cells (top right) were seen, as well as an increase in myeloid (Mac1+/CD11c+) cells (bottom left). Flow analysis using a Notch1 antibody labeled with RPE (AbD Serotec, clone mN1A) showing high levels of intracellular Notch1 in both the human 8;13 cells and Jurkat cells compared with the normal PB sample (bottom right). (B) Western blot analysis of KG-1 cells harboring FGFR1OP2-FGFR1 (top). Flow analysis showed higher levels of cellular Notch1 compared with normal human PB (Nor. PB) and 3 BCR-ABL–positive CML samples. Jurkat cells were used as a positive control for high Notch1 expression (middle). Western blot analysis using the V1744 antibody (bottom) demonstrates the activated form of Notch1 in KG-1 and Jurkat cells but not in normal or BCR-ABL–positive cells (bottom). KG-1 cells treated with either DAPT (5μM) or Comp E (5μM) show decreased activated Notch1. (C) KG-1 cells express higher CD25 levels on the cell surface (top) as well as Hes1 gene expression (bottom) compared with K562 cells. (D) GSI DAPT can remarkably inhibit KG-1 cell growth (right), whereas K562 cells are relatively resistant to the drug treatment.
Notch1 is highly activated in human SCLL cells. (A) Flow cytometric analyses of PB from the 8;13 EMS showing a CD4+/CD8+ immunophenotype, with most cells expressing both CD4 and CD8 at intermediate levels (top left). Fewer TCRα+ and TCRβ+ cells (top right) were seen, as well as an increase in myeloid (Mac1+/CD11c+) cells (bottom left). Flow analysis using a Notch1 antibody labeled with RPE (AbD Serotec, clone mN1A) showing high levels of intracellular Notch1 in both the human 8;13 cells and Jurkat cells compared with the normal PB sample (bottom right). (B) Western blot analysis of KG-1 cells harboring FGFR1OP2-FGFR1 (top). Flow analysis showed higher levels of cellular Notch1 compared with normal human PB (Nor. PB) and 3 BCR-ABL–positive CML samples. Jurkat cells were used as a positive control for high Notch1 expression (middle). Western blot analysis using the V1744 antibody (bottom) demonstrates the activated form of Notch1 in KG-1 and Jurkat cells but not in normal or BCR-ABL–positive cells (bottom). KG-1 cells treated with either DAPT (5μM) or Comp E (5μM) show decreased activated Notch1. (C) KG-1 cells express higher CD25 levels on the cell surface (top) as well as Hes1 gene expression (bottom) compared with K562 cells. (D) GSI DAPT can remarkably inhibit KG-1 cell growth (right), whereas K562 cells are relatively resistant to the drug treatment.
Myeloid cells also express Notch1
To investigate whether the myeloid cells in the ZMYM2-FGFR1 model also express Notch, we reanalyzed spleen cells from 4 different founder mice, in which, on average, 1%-2% of splenocytes were GFP+Mac-1+ (supplemental Figure 6). Flow analysis using mN1A demonstrated that the GFP+Mac-1+ subpopulation surprisingly expressed higher levels of total intracellular Notch1 compared with GFP−Mac-1+ cells (supplemental Figure 6). Interestingly, the GFP+Mac-1+ cells also expressed high levels of surface CD25, further suggesting highly activated Notch1 in these cells. However, after either DAPT treatment or transplantation of ZNF112-shCBF1 into nude mice (data not shown), the percentage of GFP+Mac1+Gr1+ levels in the PB were not significantly changed.
Discussion
The data presented here, combined with those of Ren et al,22 support the involvement of multiple genetic abnormalities in ZMYM2-FGFR1–initiated tumorigenesis. We and others13 have demonstrated previously that, on its own, this chimeric kinase is not sufficient for SCLL development. We now show that, in addition to loss of TCRα, activation of Notch1 is required to facilitate ZMYM2-FGFR1–driven disease in a mouse model. The proposed mechanism has 2 important implications. First, it provides a molecular mechanism to explain why the majority of ZMYM2-FGFR1 SCLL patients develop T-lymphoblastic lymphoma.1,5 Second, the data suggest that simultaneous targeting of both FGFR1 and Notch signaling could have potential therapeutic efficacy in the treatment of this disease.
Notch1 is a master regulator of T-cell development. During this process, lymphoid progenitor cells (early T-cell-lineage progenitors) must exit the bone marrow and traffic through the bloodstream to the thymus, where they activate Notch1 signaling and commit to full T-lineage development.40 Overexpression of active Notch1 results in ectopic development of pre-T cells in the bone marrow,41 and the deletion of Notch1 in HSCs leads to a total inhibition of T-cell differentiation and thymic atrophy.42 Notch1 and its target genes were highly expressed in LSCs from ZMYM2-FGFR1 mice compared with their normal counterparts, indicating that ZMYM2-FGFR1 can induce Notch1 expression at an early stage, committing these leukemia progenitors to a T-cell lineage outside of the thymic microenvironment. This result is consistent with independent observations that the majority of mice with ZMYM2-FGFR1 leukemia have normal sized thymuses,13,22 and suggests that some T-lymphoma cells are generated in the bone marrow, as evidenced by the high number of DP T cells in the bone marrow of leukemic mice (supplemental Figure 1C). A Notch1 signaling microenvironment is essential for T-cell development. It was demonstrated previously that CD4+CD8+ T cells could be generated in the bone marrow of mice that had been transduced and transplanted with activated Notch1 constructs.43 Therefore, it is possible that the same thing happened in our mouse leukemia model, in which constitutive Notch signaling activation was also seen. Both ZMYM2-FGFR1 bone marrow–transduced and -transplanted mice, as well as mice injected with ZNF112 cells, developed DP T-lymphoblastic lymphomas that had immunophenotypes identical to those observed for bone marrow–transduced and -transplanted mice with activated Notch1.43,44 Aberrant activation of Notch1 is also frequently seen in human T-ALL patients.18,45 The molecular mechanism by which aberrant Notch1 signaling contributes to T-cell transformation, however, is still poorly understood and does not appear to be sufficient, because mice with an activating Notch1 mutation do not initiate development of leukemia.46,47 Therefore, mutated Notch1 must cooperate with other oncogenes, such as Myc, to drive the disease development.48,49 Interestingly, high levels of Myc expression were also found in ZMYM2-FGFR1 leukemic cells (Figure 1), suggesting that activation of Notch1 may also play a role in ZMYM2-FGFR1–induced lymphoma through targeting c-Myc.
Analysis of the myeloid cells (Mac-1+) from spleens of diseased animals demonstrated that there was an increase in Notch1 and CD25 protein levels in GFP+ ZMYM2-FGFR1 carrying cells compared with the GFP− Mac-1+ cells, suggesting that Notch1 was activated in these cells. Highly activated Notch1 was found in LSK cells (Figure 1), suggesting that the GFP+Mac1+ cells may have inherited a Notch1-activating mutation from the LSCs or progenitors. This observation is consistent with a study by Palomero et al50 showing that the myeloid ML1 and ML2 cell lines derived from a patient initially diagnosed with T-ALL carried an activating mutation in Notch1. Although it was reported that Notch1 promotes normal HSCs to differentiate into megakaryocytes,51 activating mutations of Notch1 are still mostly restricted to T-ALL and are rare in AML.50 Therefore, it appears that activated Notch1 is not a driver for myeloid leukemia. The same could be true in our mouse model, because pharmacologic (DAPT treatment) or genetic inhibition (shCBF1) of Notch1 did not significantly change the percentage of GFP+Mac1+Gr1+ cells in the PB from ZNF112 transplanted mice, suggesting that the growth of GFP+Mac1+ cells was independent of Notch1 signaling.
The value of murine models depends on the extent to which they mimic the human disease. The disease described here shows most of the anatomical and histopathological features of human SCLL.1,4,36-38 In addition, a DP phenotype in both lymph node and bone marrow samples was identified in all reported cases of human ZMYM2-FGFR1 SCLL for which the immunophenotypes have been evaluated. As in the mouse model,22 patients with DP T cells also lacked cell-surface CD3, even though intracellular CD3 was present.1 Consistent with our mouse model, we now show that highly activated Notch1 is seen in human ZMYM2-FGFR1 disease, which contained ∼ 5% CD4+CD8+ and reduced TCRαβ–expressing T cells. In a recent attempt to generate human ZMYM2-FGFR1–expressing xenografts, Agerstam et al transduced human CD34+ cells and introduced them into NOD-SCID or NSG mice. Unfortunately, these mice failed to develop T-lymphoma, possibly because of a lack of thymus function.52 T-lymphomas from all individual founder mice harbored activating deletions of Notch1 (Figure 5C-D), which is similar to the findings in Ikaros-deficient mice and other murine T-ALL cell lines33,35 and indicates that deletion mutation of Notch1 cannot be a random event. Therefore, constitutive activation of FGFR1 and Notch1 may cooperate in the development of SCLL.
GSIs often induce severe gastrointestinal toxicity in T-ALL patients, which has restricted their clinical use. However, it was recently shown that combination therapy with GSIs and glucocorticoids can improve the antileukemic effects of GSIs and reduce their gut toxicity in vivo.23 In our in vivo experiments, DAPT treatment was much weaker in preventing leukemogenesis than knock-down of Notch1, MAML1, or CBF1. The absence of gut toxicity seen in DAPT-treated mice may have been due to the low doses used, but may also indicate that GSI treatment alone may not be sufficient to kill the leukemic cells in vivo. Recently, studies have suggested that targeting Notch transcription directly using the synthetic, hydrocarbon-stapled peptide SAHM153 or antagonizing the Notch receptor using specific antibodies54 can significantly reduce tumor growth in a mouse model of Notch1-driven T-ALL. These new strategies avoid the side effect of intestinal toxicity seen with GSIs and may be successful in the treatment of SCLL.
In conclusion, our data clearly show that constitutive activation of Notch1, combined with loss of TCRα, are important etiological steps for T-cell lymphoma development induced by the ZMYM2-FGFR1 fusion kinase. These observations may explain why SCLL patients with the ZMYM2-FGFR1 rearrangement specifically develop T-cell lymphoma rather than B-cell lymphoma. Our results also suggest that the FGFR1 pathway, in combination with the Notch1 pathway, could provide a novel strategy for molecular-targeted therapies to treat these SCLL patients.
The online version of this article contains a data supplement.
The publication costs of this article were defrayed in part by page charge payment. Therefore, and solely to indicate this fact, this article is hereby marked “advertisement” in accordance with 18 USC section 1734.
Acknowledgments
We are grateful to Dr Sei-Ichi Matsui for providing the spectral karyotyping analysis, Mr Jeff LaDuca for performing the FISH analysis, Dr Ken Lo for assistance with analysis of the microarray data, and Dr Eiko Kitamura and Ms Haiyan Qin for molecular biological analyses. We also thank Dr Zúñiga-Pflücker for providing the OP9-GFP/DLL1 cells, Dr Nicholas Gaiano for providing shRNA vectors, Dr William Pao for providing KG-1 cells, and Dr Jon C. Aster for providing the Notch1 reporter vector.
This work was supported by grant CA076167 from the National Institutes of Health.
National Institutes of Health
Authorship
Contribution: M.R. was involved in the design preparation and execution of the molecular and animal experiments; J.C. was involved in the design of the experiments and analysis of the gene-expression data; and M.R. and J.C. cowrote the manuscript.
Conflict-of-interest disclosure: The authors declare no competing financial interests.
Correspondence: MingQiang Ren, Georgia Health Sciences University Cancer Center, CN4121, Medical College of Georgia, 1120 15th St, Augusta, GA 30912; e-mail: mren@georgiahealth.edu.

