Abstract
To delineate the role of specific members of β1 integrins in stress erythropoiesis in the adult, we compared the response to phenylhydrazine stress in 3 genetically deficient models. The survival of β1-conditionally deficient mice after phenylhydrazine is severely compromised because of their inability to mount a successful life saving splenic erythroid response, a phenotype reproduced in β1Δ/Δ reconstituted animals. The response of bone marrow to phenylhydrazine-induced stress was, unlike that of spleen, appropriate in terms of progenitor cell expansion and mobilization to peripheral blood although late differentiation defects qualitatively similar to those in spleen were present in bone marrow. In contrast to β1-deficient mice, α4Δ/Δ mice showed only a kinetic delay in recovery and similar to β1Δ/Δ, terminal maturation defects in both bone marrow and spleen, which were not present in VCAM-1Δ/Δ mice. Convergence of information from these comparative studies lends new insight to the distinct in vivo roles of α4 and α5 integrins in erythroid stress, suggesting that the presence of mainly α5β1 integrin in all hematopoietic progenitor cells interacting with splenic microenvironmental ligands/cells is instrumental for their survival and accumulation during hemolytic stress, whereas presence of α4, or of both α5 and α4, is important for completion of terminal maturation steps.
Introduction
During normal hematopoiesis, cells committed to specific lineages complete all their differentiation steps within hematopoietic tissues, and only the most mature cells are released into circulation. Thus, cues provided by the microenvironment (ME) in bone marrow (BM) or spleen, either through ligand/receptor interactions or through secreted cytokines and/or engagement of signaling molecules, are critical for lineage-committed cells and their differentiated descendants to complete their differentiation program. This interaction is uniquely exemplified in studies of erythroid lineage maturation. Close association of erythroid cells with cellular components of the ME seems to influence their differentiation; and among them, the macrophage (Mϕ) has received the most attention. Through physical contact with erythroid cells, Mϕs create a functionally interactive unit, the erythroblastic island (EI), which appears to exert major influence on later stages of erythroid differentiation/maturation. The EI was first described by Bessis et al,1 but its functional influence was only recently analyzed by in vitro and in vivo approaches. Several proteins on the surface on Mϕs in partnership with proteins on erythroid cells appear to mediate these effects.2-6 Furthermore, secreted Mϕ proteins, like Gas6, seem to interact with their cognate receptors present in erythroid cells enhancing integrin-dependent binding.7 Whether these proteins have a redundant function or work in complexes cooperating with each other, or become functional at different stages of differentiation and under different conditions in vivo, is presently unclear.
In addition to erythroid cell/Mϕ interactions within the EI, direct interactions of erythroid cells with extracellular matrix components, like fibronectin, have been implicated in the regulation of erythropoiesis. The presence of fibronectin counter-receptors on erythroid cells,8 like members of the beta1 integrins (α4β1 and α5β1), is thought to mediate these interactions. Both α4 and α5 integrins are widely expressed in hematopoietic cells and have been implicated in several functional aspects, such as proliferation, survival, maturation of erythroid cells, or in homing and proliferation of hematopoietic progenitor cells.9-15 However, in vitro and in vivo data have not been consistent, so that the exact role of these 2 integrins has remained inconclusive. For example, adhesion to fibronectin is dependent on both α4β1 and α5β1, and it was found to influence stem cell homing of hematopoietic progenitors to BM or spleen, but the results have been controversial for α5 integrin.8,11,14 Other in vitro experiments comparing effects of α4 and α5 have shown that only α4β1, not α5β1, influences proliferation and protection from apoptosis of erythroid cells,16 whereas opposite conclusions were reached by others,17 or effects were selective for BM and not spleen.18 Yet, genetic deletion of all β1 integrins showed no effects on erythroid differentiation, only effects on colonization of hematopoietic tissues during development (fetal liver, spleen, and BM)19 and no effects on baseline or stress erythropoiesis in β1-conditionally deleted adult animals.20 Thus, the β1 genetic data are in contrast with differentiation defects described for fetal erythroblasts in α4β1 knockout mutants21 and in α4 chimeras,22 or with impairment of stress hematopoiesis/erythropoiesis in adult animals with α4 conditional deletion.23 These diverse and controversial data have been difficult to reconcile and prompted us to reexamine the phenotype of β1 conditionally deleted mice and compare them to α4 or VCAM-1 deleted mice under conditions of stress.
Our data dissecting the influence exerted by α4 versus α5 integrins in response to erythroid stress provide novel information on the role of β1 integrins in erythropoiesis. Their effects are distinctly manifested in different hematopoietic environments (ie, BM vs spleen) and seem to be directed at discreet stages of erythroid differentiation. Further, transplantation experiments have indicated that the great majority of the effects seen in β1Δ/Δ animals are, by and large, hematopoietic cell autonomous, but as yet undefined effects from a β1-deficient ME may provide contributory function.
Methods
Mice and treatment
MxCre+β1f/f mice were obtained in our laboratory by breeding β1f/f mice24 with MxCre+ transgenic mice (both from The Jackson Laboratory). β1 integrin deletion was induced by 6 intraperitoneal injections of polyriboinosinic acid/polyribocytidylic acid (Sigma-Aldrich), and mice were used at least 4 weeks later. Polyriboinosinic acid/polyribocytidylic acid-treated Cre-negative littermates served as controls. α4 integrin-deficient mice were generated in our laboratory.23,25 VCAM-1-deficient mice were described previously.26
To induce acute anemia, mice were injected with phenylhydrazine (PHZ; Sigma-Aldrich) at 60 mg/kg intraperitoneally on 2 consecutive days. Peripheral blood (PB) parameters were determined using a HEMAVET950 (Drew Scientific). To study the role of macrophages, mice received a single intravenous injection of 200 μL of clodronate-loaded or empty liposomes. Animals were housed at the University of Washington Comparative Medicine Specific Pathogen-Free Vivarium, with irradiated chow and autoclaved water ad libitum. All procedures were done according to protocols approved by the University of Washington Institutional Animal Care and Use Committee.
Transplantation
B6 × 129.F1 mice (The Jackson Laboratory) were used as recipients. Mice were lethally irradiated (1150 cGy) and injected intravenously with 0.25 × 10⁶ (for colony-forming unit-spleen [CFU-S]) or 10 × 106 β1Δ/Δ or α4Δ/Δ BM cells for long-term repopulation. In the latter, after complete reconstitution of hematopoiesis, acute hemolytic anemia (PHZ) was induced. Mice reconstituted with wild-type β1+ or α4+/+ BM cells served as controls.
FACS analysis
To study integrin expression in cells from PB, BM, and spleen at steady state or after PHZ treatment, we used the following antibodies: CD44, CD45, β1, α2, α5, α4β7, active caspase (BD Biosciences), α4 (Southern Biotechnology), α6, F4/80 (AbD Serotec), and α9 (R&D Systems) and analyzed by fluorescence-activated cell sorting (FACS).
CFU-C assay
The committed progenitors of all lineages, colony-forming unit-colony (CFU-C), were assessed in methylcellulose cultures.26 For “stress” burst-forming units-erythroid (BFU-E) in spleen, the cells were cultured in the presence of erythropoietin (Epo) only.27,28 All colony types were counted at day 7, except for CFU-E, which were counted on day 3.
Homing in spleens of nonirradiated recipients
Nonirradiated wild-type (α4+/+, β1+/+) mice were injected with 20 × 106 control (α4f/f, β1f/f) or β1Δ/Δ BM cells and were killed 24 hours later (supplemental Figure 3, available on the Blood Web site; see the Supplemental Materials link at the top of the online article).
CFU-S assay
Information on CFU-S assay is contained in Figure 5.
Adhesion to spleen sections in vitro
Information on adhesion to spleen sections in vitro is contained in supplemental Figure 4.
Immunohistochemistry
Bones and spleens fixed with 4% paraformaldehyde were treated as previously described.29,30 Frozen sections were labeled with anti-CD31 (MEC, 13.3) and anti-CD29 (9EG7, BD Biosciences, and MB1.2, Chemicon/Millipore), anti–bone morphogenetic protein 4 (BMP4; ab 39973, Abcam), anti-CD68 (FA-11, AbD Serotec), and F4/80 (CI:A3-1, Fitzgerald Industries International) and visualized with 2° Alexa 594–conjugated fluorochromes (Invitrogen).
BMP4 quantitative reverse-transcribed polymerase chain reaction
Total RNA was isolated from the spleens of control and β1Δ/Δ mice treated with PHZ (d4) and reverse-transcribed using random primers. Obtained cDNA was used in quantitative polymerase chain reaction with primer sets for BMP4 (F-ctcccaagaatcatggactg, R-aaagcagagctctcactggt) and b-actin (F-atcctcaccctgaagtaccc, R-atttcccgctcggccgtggt).
Results
Genetic models
MxCre+β1f/f (β1Δ/Δ) mice.
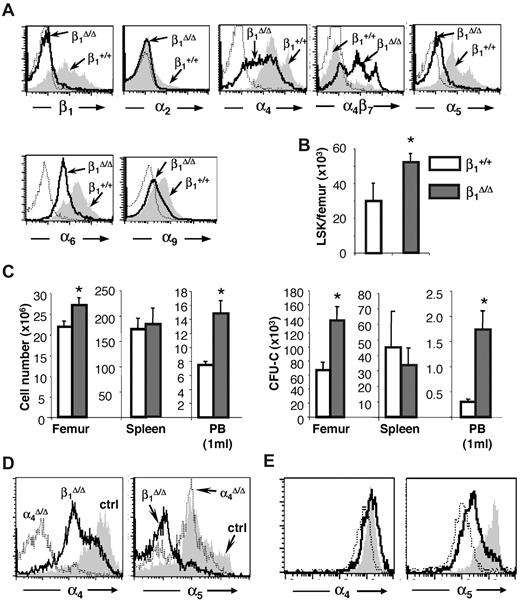
Generation of these mice has been previously described,24 although a detailed evaluation of their erythropoiesis and expression of different β1 heterodimers in hematopoietic tissues have not been presented. Partial expression data were also presented in a similar β1 conditional model.31 Ablation of β1 in BM cells was more than 95% (95.5% ± 0.84%, n = 16). Specific β1 integrin heterodimer expression is shown in Figure 1A. Drastic reduction in α5β1 expression is seen, whereas other dimers, like α4 and α6, are well expressed, probably because of their association with alternate β1 partners (α4β7 or α6β3). Overall dramatic differences in the 2 most abundant integrins, α4 and α5, were seen in BM hematopoietic cells of these mice. Integrin α5 was virtually absent in all BM cells, but α4 was expressed at high levels, with a significant overexpression of α4β7.32 Cellularity in hematopoietic tissues (BM, spleen) was normal to increased in β1 mice (Figure 1B-C left panel). Significant differences in progenitor content were present in both BM and PB; however, no significant differences were recorded in the spleen (Figure 1C right panel). Hematocrit and hemoglobin levels were not statistically different from controls, but platelets were higher in β1 mice (P < .05).
Integrin expression and hematopoiesis in β1Δ/Δ at steady state. (A) Expression of various integrins in CD45+ BM cells of β1-deficient (β1Δ, thick black line) or β1-sufficient, control (β1+, gray histogram) mice; isotype-matched control is represented by a thin dotted line. Note that the expression of α4β7 is up-regulated in β1Δ/Δ BM cells. (B) Lin−, Sca-1+, c-kit+ (LSK) cells in the femurs of control (n = 10) and β1Δ/Δ (n = 15) mice. (C) Cells and progenitors per femur, spleen, and 1 mL of PB in β1Δ/Δ (BM, n = 19; spleen, n = 13; PB, n = 17) or control, β1+ (BM, n = 18; spleen, n = 6; PB, n = 17) mice. White bars represent control mice; and gray bars, β1Δ/Δ mice. *Significant difference over control (P < .05). (D) α4 versus α5 expression in β1Δ/Δ spleen cells compared with α4Δ/Δ mice or control mice. (E) Relative expression of α4 and α5 integrin in erythroid cells (TER119+) at progressive maturation stages: R1, CD71hi/TER119lo (gray shaded area); R2, CD71hi/TER119hi (white area with bold line); and R3, CD71lo/TER119hi (white area with thin, dotted line). Note the higher α5 expression in early R1 erythroblasts (gray).
Integrin expression and hematopoiesis in β1Δ/Δ at steady state. (A) Expression of various integrins in CD45+ BM cells of β1-deficient (β1Δ, thick black line) or β1-sufficient, control (β1+, gray histogram) mice; isotype-matched control is represented by a thin dotted line. Note that the expression of α4β7 is up-regulated in β1Δ/Δ BM cells. (B) Lin−, Sca-1+, c-kit+ (LSK) cells in the femurs of control (n = 10) and β1Δ/Δ (n = 15) mice. (C) Cells and progenitors per femur, spleen, and 1 mL of PB in β1Δ/Δ (BM, n = 19; spleen, n = 13; PB, n = 17) or control, β1+ (BM, n = 18; spleen, n = 6; PB, n = 17) mice. White bars represent control mice; and gray bars, β1Δ/Δ mice. *Significant difference over control (P < .05). (D) α4 versus α5 expression in β1Δ/Δ spleen cells compared with α4Δ/Δ mice or control mice. (E) Relative expression of α4 and α5 integrin in erythroid cells (TER119+) at progressive maturation stages: R1, CD71hi/TER119lo (gray shaded area); R2, CD71hi/TER119hi (white area with bold line); and R3, CD71lo/TER119hi (white area with thin, dotted line). Note the higher α5 expression in early R1 erythroblasts (gray).
Tie2Cre+α4f/f (α4Δ/Δ) mice.
These mice have been described in detail in several prior publications.23,25 Differences in the expression of α4 and α5 integrins in β1Δ/Δ and α4Δ/Δ spleens are shown in Figure 1D. Of particular note is the fact that the abundance of α4 and α5 in erythroid cells is different at progressing differentiation stages: α5 expression is higher in earlier cells,8 whereas α4 is widely expressed throughout nucleated erythroid cells (Figure 1E).
Tie2Cre+/VCAM-1f/f (VCAM-1Δ/Δ) mice.
The phenotype of these mice has been described by us and others.26,33,34 VCAM-1 represents the major and preferred ligand for α4β1 integrin in endothelial cells and also binds α9β1. These mice share many functional phenotypic features with α4Δ/Δ mice, but there have also been distinct differences.26,34
Overall, the aforementioned 3 models are characterized by normal basal erythropoiesis but display different integrins in their erythroid cells, and their functional responses to erythroid stress have not been studied in detail before.
Erythroid response and survival of β1Δ/Δ mice is critically impaired after PHZ stress
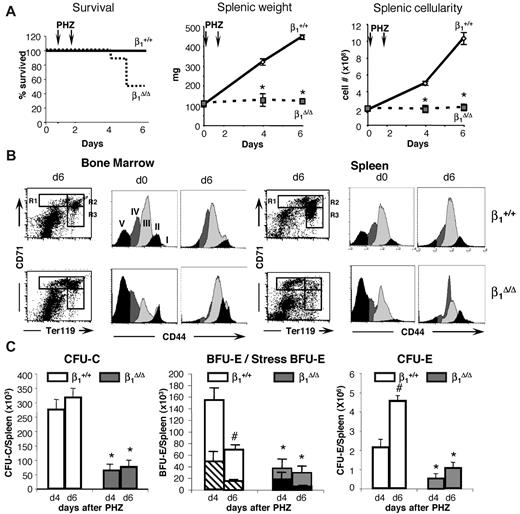
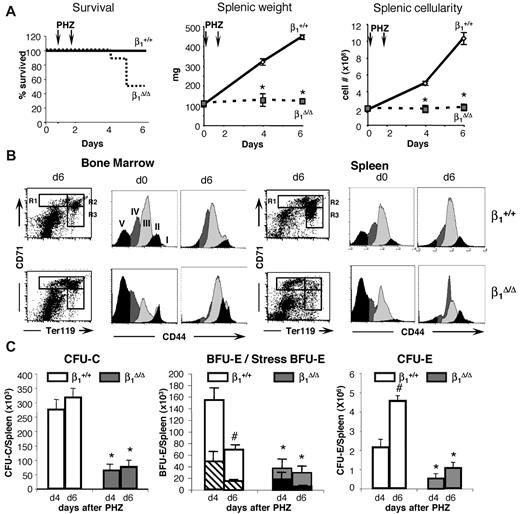
Both β1Δ/Δ and control mice received 2 injections of PHZ and were studied at days 4 and 6 after the first injection. All control mice survived the hemolytic challenge, but half of the β1Δ/Δ mice died by day 6 (Figure 2A). Hematocrit levels reached a nadir in control animals 2 days after the last injection (day 4) and began to recover from that point on. β1Δ/Δ mice had similar initial and nadir hematocrit levels, but in contrast to controls, hematocrit levels continued to drop (supplemental Figure 1). Dramatic differences between controls and β1Δ/Δ mice were seen when splenic weights and cellularities were compared at days 4 and 6 (Figure 2A).
Stress-induced erythroid differentiation is impaired in β1Δ/Δ mice. (A) Survival curve (ctrl, n = 25; β1Δ/Δ, n = 16), splenic weight (ctrl, n = 25; β1Δ/Δ, n = 6), and splenic cellularity (ctrl, n = 25; β1Δ/Δ, n = 6). (B) Erythroid differentiation in BM and spleen. FACS profiles of CD71/TER119-labeled splenic cells (left panels in BM and spleen), and CD44/side scatter analysis of TER119+ cells from days 0 and 6 after PHZ (right panels in BM and spleen). Note the failure of β1Δ/Δ erythroid cells to advance to later maturation stages (ie, from R1 to R2 in the CD71/TER119 profiles after RBC lysis). CD44/side scatter analysis of TER119+ cells shows discreet stages of progressive maturation (from I-V) before PHZ but a significant overlap after PHZ treatment in both sets of animals. (C) Progenitors (total CFU-C, left panel; BFU-E/stress BFU-E, middle panel; and CFU-E, right panel) in spleen before and after PHZ treatment in controls and β1-deficient mice. (Stress BFU-E are shown as a proportion of total BFU-E.) Note the significant reduction of all progenitors in spleen after PHZ treatment in β1Δ/Δ mice (day 6).
Stress-induced erythroid differentiation is impaired in β1Δ/Δ mice. (A) Survival curve (ctrl, n = 25; β1Δ/Δ, n = 16), splenic weight (ctrl, n = 25; β1Δ/Δ, n = 6), and splenic cellularity (ctrl, n = 25; β1Δ/Δ, n = 6). (B) Erythroid differentiation in BM and spleen. FACS profiles of CD71/TER119-labeled splenic cells (left panels in BM and spleen), and CD44/side scatter analysis of TER119+ cells from days 0 and 6 after PHZ (right panels in BM and spleen). Note the failure of β1Δ/Δ erythroid cells to advance to later maturation stages (ie, from R1 to R2 in the CD71/TER119 profiles after RBC lysis). CD44/side scatter analysis of TER119+ cells shows discreet stages of progressive maturation (from I-V) before PHZ but a significant overlap after PHZ treatment in both sets of animals. (C) Progenitors (total CFU-C, left panel; BFU-E/stress BFU-E, middle panel; and CFU-E, right panel) in spleen before and after PHZ treatment in controls and β1-deficient mice. (Stress BFU-E are shown as a proportion of total BFU-E.) Note the significant reduction of all progenitors in spleen after PHZ treatment in β1Δ/Δ mice (day 6).
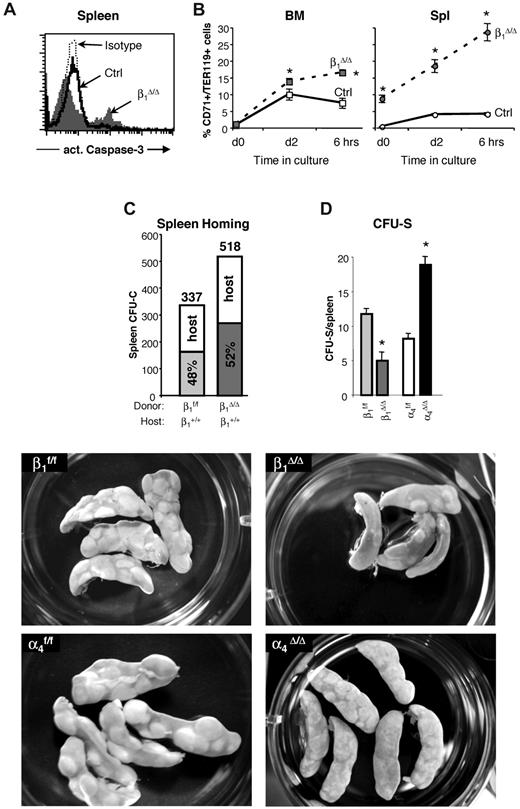
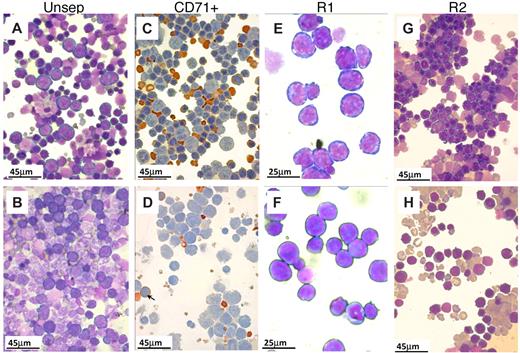
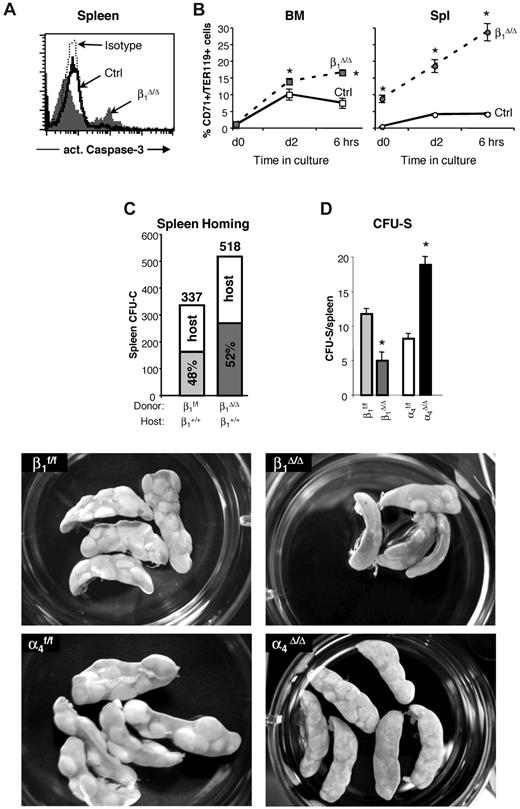
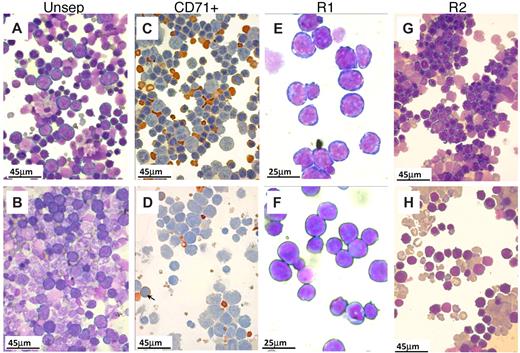
To further explore differences between control and β1Δ/Δ mice after PHZ, detailed studies on spleen cell populations, differentiation of erythroid cells, and progenitor cell content were carried out (Figures 2,Figure 3–4). TER119+ erythroid cells were analyzed by FACS using coexpression with CD7135 or CD44.36 Immature cells, especially R1 (Figures 2B, 3), outnumbered the more mature types (R1:R2 ratio at day 6 was 1:8 in controls vs 1:0.4 in β1Δ/Δ) and all subsets of erythroid cells in spleen were diminished compared with controls (Figure 4 top panels; supplemental Figure 2). Not only were erythroid cells very low in β1Δ/Δ spleen, but also progenitor cells of all classes (Figure 2C). Specifically BFU-E, “stress” BFU-E and CFU-E were all drastically diminished (Figure 2C). Importantly, there was an increased proportion of apoptotic cells in total splenocytes and in CD71+/TER119+ cells by activated caspase-3 evaluation (Figure 5A-B).
Morphologic appearance of erythroid cells in spleen after PHZ. (A-B,E-H) May-Grünwald-Giemsa stain. (C-D) Benzidine/hematoxylin stain. (A) Smears from control spleens at day 4 after PHZ treatment. Note the predominant presence of erythroid cells. Nonerythroid cells were 34% plus or minus 4%; n = 7. (B) In β1Δ/Δ spleens, proportionally fewer erythroid cells were present (from 20%–30%; nonerythroid cells were 78 ± 3%, n = 3) and of less mature stage (mostly at the proerythroblastic stage). (C) CD71+ cells (purified by CD71 magnetic column selection). In control spleens, erythroid cells at several maturation stages predominate. (D) CD71+ cells from β1Δ/Δ spleens are represented mainly by early stages of erythroid cells with fewer more mature erythroid cells (shown by arrows). (E) Smears from R1 (CD7hi/TER119lo) cells sorted by FACS. (F) R1 cells from β1Δ/Δ. (G) Smears from R2 cells (CD7hi/TER119hi) sorted from normal spleens at day 4 after PHZ. Populations of erythroblasts at intermediate maturation stages predominate. (H) Smears of R2-sorted cells from β1Δ/Δ spleens at day 4 after PHZ. Fewer later erythroblasts and many large reticulocytes are present. Smears were made using a Shandon cytospin and, after staining, were mounted with distilled water. Photographs were taken at room temperature using a Nikon Coolpix 995 digital camera mounted to the ocular of an Olympus BHT-2 microscope. Magnification bars are inserted. Distilled water was used to mount the cytospins. Images were uploaded into a computer, and Adobe Photoshop was used to correct brightness and contrast.
Morphologic appearance of erythroid cells in spleen after PHZ. (A-B,E-H) May-Grünwald-Giemsa stain. (C-D) Benzidine/hematoxylin stain. (A) Smears from control spleens at day 4 after PHZ treatment. Note the predominant presence of erythroid cells. Nonerythroid cells were 34% plus or minus 4%; n = 7. (B) In β1Δ/Δ spleens, proportionally fewer erythroid cells were present (from 20%–30%; nonerythroid cells were 78 ± 3%, n = 3) and of less mature stage (mostly at the proerythroblastic stage). (C) CD71+ cells (purified by CD71 magnetic column selection). In control spleens, erythroid cells at several maturation stages predominate. (D) CD71+ cells from β1Δ/Δ spleens are represented mainly by early stages of erythroid cells with fewer more mature erythroid cells (shown by arrows). (E) Smears from R1 (CD7hi/TER119lo) cells sorted by FACS. (F) R1 cells from β1Δ/Δ. (G) Smears from R2 cells (CD7hi/TER119hi) sorted from normal spleens at day 4 after PHZ. Populations of erythroblasts at intermediate maturation stages predominate. (H) Smears of R2-sorted cells from β1Δ/Δ spleens at day 4 after PHZ. Fewer later erythroblasts and many large reticulocytes are present. Smears were made using a Shandon cytospin and, after staining, were mounted with distilled water. Photographs were taken at room temperature using a Nikon Coolpix 995 digital camera mounted to the ocular of an Olympus BHT-2 microscope. Magnification bars are inserted. Distilled water was used to mount the cytospins. Images were uploaded into a computer, and Adobe Photoshop was used to correct brightness and contrast.
Inability of β1Δ/Δ mice to respond to hemolytic stress is largely cell autonomous. Lethally irradiated wild-type recipients were reconstituted with β1Δ/Δ or β1+ BM cells and after reconstitution were treated with PHZ to induce acute hemolytic anemia. Six days after the first PHZ injection, mice were killed, and cellularity, progenitor content, and erythroid differentiation (number of TER119/CD71+ cells in gates R1 [CD71hi/TER119lo], R2 [CD71hi/TER119hi], and R3 [CD71lo/TER119hi]) were assessed in the spleen (top panel) and BM (middle panel). Transplanted (Tx) mice (ctrl, n = 6; and β1Δ/Δ, n = 6) were compared with corresponding nontransplanted counterparts. *Significant difference over the respective β1+ control group. Cross-hatched bars represent transplanted; and white bars, nontransplanted. P < .05. #Significant difference over nontransplanted counterparts (P < .05). Note that transplanted β1Δ/Δ mice (black bars) have a similar response to PHZ as nontransplanted β1Δ/Δ mice (gray bars). The bottom panel shows the difference in spleen sizes of 2 control-transplanted mice (+/+ recipients transplanted with +/+ donor cells) after PHZ treatment at day 6 (left), compared with 2 β1Δ/Δ-transplanted mice (+/+ recipients transplanted with β1Δ/Δ cells, right). Spleens were photographed with a Nikon Coolpix 995 camera next to a ruler measuring millimeters.
Inability of β1Δ/Δ mice to respond to hemolytic stress is largely cell autonomous. Lethally irradiated wild-type recipients were reconstituted with β1Δ/Δ or β1+ BM cells and after reconstitution were treated with PHZ to induce acute hemolytic anemia. Six days after the first PHZ injection, mice were killed, and cellularity, progenitor content, and erythroid differentiation (number of TER119/CD71+ cells in gates R1 [CD71hi/TER119lo], R2 [CD71hi/TER119hi], and R3 [CD71lo/TER119hi]) were assessed in the spleen (top panel) and BM (middle panel). Transplanted (Tx) mice (ctrl, n = 6; and β1Δ/Δ, n = 6) were compared with corresponding nontransplanted counterparts. *Significant difference over the respective β1+ control group. Cross-hatched bars represent transplanted; and white bars, nontransplanted. P < .05. #Significant difference over nontransplanted counterparts (P < .05). Note that transplanted β1Δ/Δ mice (black bars) have a similar response to PHZ as nontransplanted β1Δ/Δ mice (gray bars). The bottom panel shows the difference in spleen sizes of 2 control-transplanted mice (+/+ recipients transplanted with +/+ donor cells) after PHZ treatment at day 6 (left), compared with 2 β1Δ/Δ-transplanted mice (+/+ recipients transplanted with β1Δ/Δ cells, right). Spleens were photographed with a Nikon Coolpix 995 camera next to a ruler measuring millimeters.
Apoptosis levels in β1Δ/Δ cells in BM and spleen after PHZ treatment and the ability of β1Δ/Δ cells to home and form CFU-S. (A) Expression of activated caspase-3, an apoptosis marker, in the spleens of control and β1Δ/Δ mice. A significant proportion of apoptotic cells among splenocytes of β1Δ/Δ mice was noted after PHZ treatment. In contrast to β1Δ/Δ mice, no difference in apoptosis in spleen between control and α4Δ/Δ mice after PHZ treatment at day 4 was detected (data not shown). (B) Cells from BM and spleen of PHZ-treated (day 4) mice were put into in vitro culture made up of Iscove modified Dulbecco medium supplemented with 10% fetal bovine serum, l-glutamine, penicillin, and streptomycin containing cytokines (3 U/mL recombinant human Epo, 50 ng/mL recombinant murine stem cell factor, 10 ng/mL recombinant murine interleukin-6, and 10 ng/mL recombinant murine interleukin-3). Two days later, cells were washed, resuspended in the just described medium without the cytokines, and 6 hours later were taken for analysis. Caspase-3 expression in TER119hi/CD71hi cells is shown before (day 0) and after (day 2) in vitro incubation with cytokines and after cytokine withdrawal (6 hours). Note that in β1Δ/Δ mice, even at the initial time point, there is a difference in the level of apoptosis between BM and spleen, and this is exaggerated on cytokine deprivation. (C) Homing into nonirradiated recipients: Wild-type mice were injected with control (β1+, n = 5 recipient mice) or β1-deficient (β1Δ/Δ, n = 5 recipient mice) BM cells. Twenty-four hours later, recipients were killed and spleen cells were plated in methylcellulose cultures. Individually plucked colonies were genotyped (supplemental Figure 3) to determine the origin of the host (α4+/+, β1+/+) or donor (β1f/f, α4f/f, or β1Δ/Δ) colonies and proportion of homed progenitors. The number of assessed colonies is shown above the bars. (D and bottom panels) CFU-S assessment: Lethally irradiated wild-type recipients were injected with 250 000 control (β1f/f, α4f/f) or integrin-deficient (β1Δ/Δ, α4Δ/Δ) BM cells (5 recipients per group). Eleven days after transplantation, recipients were killed, spleens were harvested, fixed in Bouin solution, and macroscopic colonies under the spleen capsule were counted using a Nikon MZ6 dissecting microscope. The number of large colonies per spleen is shown. Appearance of CFU-S in recipients of control and integrin-deficient cells is also shown (lower panels). β1Δ/Δ mice have fewer CFU-S than controls, whereas α4Δ/Δ mice have more but usually of smaller size. Spleens were photographed in a 35-mm Petri dish with a Nikon Coolpix 995 camera. Images were uploaded to a computer and adjusted for brightness and contrast with Adobe Photoshop.
Apoptosis levels in β1Δ/Δ cells in BM and spleen after PHZ treatment and the ability of β1Δ/Δ cells to home and form CFU-S. (A) Expression of activated caspase-3, an apoptosis marker, in the spleens of control and β1Δ/Δ mice. A significant proportion of apoptotic cells among splenocytes of β1Δ/Δ mice was noted after PHZ treatment. In contrast to β1Δ/Δ mice, no difference in apoptosis in spleen between control and α4Δ/Δ mice after PHZ treatment at day 4 was detected (data not shown). (B) Cells from BM and spleen of PHZ-treated (day 4) mice were put into in vitro culture made up of Iscove modified Dulbecco medium supplemented with 10% fetal bovine serum, l-glutamine, penicillin, and streptomycin containing cytokines (3 U/mL recombinant human Epo, 50 ng/mL recombinant murine stem cell factor, 10 ng/mL recombinant murine interleukin-6, and 10 ng/mL recombinant murine interleukin-3). Two days later, cells were washed, resuspended in the just described medium without the cytokines, and 6 hours later were taken for analysis. Caspase-3 expression in TER119hi/CD71hi cells is shown before (day 0) and after (day 2) in vitro incubation with cytokines and after cytokine withdrawal (6 hours). Note that in β1Δ/Δ mice, even at the initial time point, there is a difference in the level of apoptosis between BM and spleen, and this is exaggerated on cytokine deprivation. (C) Homing into nonirradiated recipients: Wild-type mice were injected with control (β1+, n = 5 recipient mice) or β1-deficient (β1Δ/Δ, n = 5 recipient mice) BM cells. Twenty-four hours later, recipients were killed and spleen cells were plated in methylcellulose cultures. Individually plucked colonies were genotyped (supplemental Figure 3) to determine the origin of the host (α4+/+, β1+/+) or donor (β1f/f, α4f/f, or β1Δ/Δ) colonies and proportion of homed progenitors. The number of assessed colonies is shown above the bars. (D and bottom panels) CFU-S assessment: Lethally irradiated wild-type recipients were injected with 250 000 control (β1f/f, α4f/f) or integrin-deficient (β1Δ/Δ, α4Δ/Δ) BM cells (5 recipients per group). Eleven days after transplantation, recipients were killed, spleens were harvested, fixed in Bouin solution, and macroscopic colonies under the spleen capsule were counted using a Nikon MZ6 dissecting microscope. The number of large colonies per spleen is shown. Appearance of CFU-S in recipients of control and integrin-deficient cells is also shown (lower panels). β1Δ/Δ mice have fewer CFU-S than controls, whereas α4Δ/Δ mice have more but usually of smaller size. Spleens were photographed in a 35-mm Petri dish with a Nikon Coolpix 995 camera. Images were uploaded to a computer and adjusted for brightness and contrast with Adobe Photoshop.
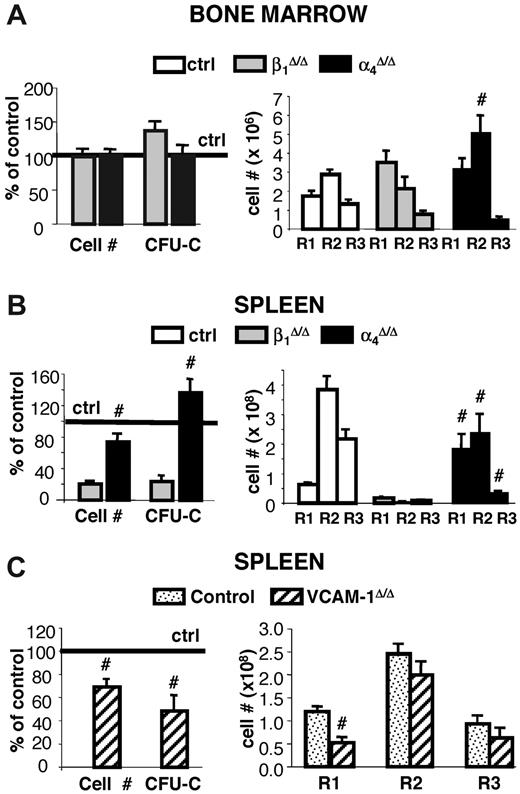
In contrast to spleen, BM revealed a different picture in which both cellularity and total CFU-C content were no different between controls and β1Δ/Δ mice (Figure 4). However, erythroid cells, albeit sufficient in numbers, exhibited a deficiency toward more mature cell numbers, so that, as in spleen, immature erythroid cells outnumbered their mature counterparts, suggesting a differentiation/maturation deficit (Figure 4 upper and middle right panels; supplemental Figure 2). The proportion of active caspase-3+/TER119+ cells in spleen was significantly increased over controls but to a lesser degree in BM (Figure 5B). Of interest, there was also an increase in circulating progenitor cells after PHZ in both sets of animals, but β1-deficient mice had much higher numbers, including BFU-E and CFU-E, suggesting no impairment in generating BM progenitors in β1Δ/Δ mice (Table 1).
Inability of β1Δ/Δ mice to respond to hemolytic stress is largely cell autonomous
To test whether the lack of splenic response to PHZ challenge was dependent on environmental cells in the spleen or only on the absence of β1 integrin in hematopoietic cells, we compared responses of nontransplanted β1Δ/Δ mice to irradiated wild-type recipient mice reconstituted with β1Δ/Δ donor cells. Transplanted controls were wild-type mice reconstituted with normal cells. Approximately 8 weeks after transplantation, after verification that the phenotype of PB cells was as expected (ie, in either β1+ or β1Δ/Δ; data not shown), all transplanted mice were subjected to PHZ challenge. As seen in Figure 4, the spleens of mice reconstituted with β1Δ/Δ cells not only failed to respond as the transplanted controls, but the same pattern of differentiation failure as in nontransplanted β1Δ/Δ mice was seen (Figure 4 right top panel).
Some notable differences were present: the splenic weight (122 ± 12 g in nontransplanted β1Δ/Δ mice, n = 6 vs 168 ± 15 g in wild-type recipient mice reconstituted with β1Δ/Δ donor cells, n = 5) and total number of R1 cells in spleen were higher in β1Δ/Δ reconstituted versus nontransplanted β1Δ/Δ mice (Figure 4 upper panel). However, the erythroid cells in the recipients of β1Δ/Δ cells, in both BM and spleen, showed the same differentiative defect as the nontransplanted β1Δ/Δ mice (Figure 4 upper and middle panels). These data suggest that recipients of β1Δ/Δ cells do generate a few more TER119+ cells than the nontransplanted mice but display the same overall phenotypic response.
The modest quantitative differences between mice reconstituted with β1Δ/Δ cells and nontransplanted β1Δ/Δ mice would suggest an ameliorating effect of the normal splenic environment in the former group. Ideally, the reverse transplantation (ie, normal [β1+] cells into β1Δ/Δ recipients) would test this issue. However, this type of experiment is not practically feasible because of the poor health (nonhematopoietically related) of β1Δ/Δ animals exacerbated by the toxicity of irradiation. Instead, we used CFU-C in nonirradiated normal spleens (Figure 5C; supplemental Figure 3), which tests the ability of β1Δ/Δ cells to settle in the nonirradiated environment of a normal spleen. In the second approach, the read-out of β1Δ/Δ-derived CFU-S (size and colony number) in the irradiated normal spleen tests the ability of normally lodged β1Δ/Δ progenitors to form CFU-S. The data from these experiments are presented in Figure 5D (bottom panels). It is evident from these experiments that the transient homing of β1Δ/Δ progenitor cells to spleen is not impaired, but their subsequent development into CFU-S is impaired, suggesting a postlodgment defect in the expansion of β1Δ/Δ progenitors in a normal splenic environment. Assuming a similar stress environment after irradiation and after PHZ, the data would suggest that β1Δ/Δ cells cannot efficiently expand and differentiate in the erythroid stress environment of the normal spleen, consistent with the picture in β1Δ/Δ transplanted mice. To provide an insight on the erythroid maturation defect, we tested the ability of both control and β1Δ/Δ TER119+ cells taken from spleens on day 6 after PHZ to adhere to control or β1Δ/Δ spleen frozen sections. Normal erythroblasts adhere less to β1Δ/Δ spleen than to normal spleen (294 ± 23 adhered cells and 641 ± 122 adhered cells, respectively, P < .05) and β1Δ/Δ erythroblasts adhered, as expected, less to normal spleen (supplemental Figure 4B). If adhesion is a requisite step for erythroid maturation, our data would suggest that the splenic environment or its altered architecture after PHZ in β1Δ/Δ mice may fail to provide an additional support mechanism for proper red cell maturation. However, to what extent these in vitro adhesion-dependent data together with in vitro EI formation using β1Δ/Δ or control Mϕs for attachment of erythroid cells (supplemental Figure 4C-D) reflects the in vivo picture is unclear.
Comparison of PHZ responses in β1Δ/Δ, α4Δ/Δ, and VCAM-1Δ mouse models
Both α4β1 and α5β1 integrins have been implicated in proliferation of erythroid cells, and α4 integrin particularly has been considered a participant in EI interactions.37 To characterize the in vivo effects of these integrins in adult hematopoiesis and avoid the use of antibody treatment, we compared the response to stress erythropoiesis among the 3 genetic models: β1Δ/Δ mice with a deficiency primarily of α5β1 in erythroid cells, α4Δ/Δ mice lacking both α4β1 and α4β7 (the latter being overexpressed in β1Δ/Δ mice), and VCAM-1Δ/Δ mice lacking the major ligand of α4 integrin in ME cells. Survival and detailed spleen and BM responses were assessed in these models in a similar way as described earlier for β1Δ/Δ mice.
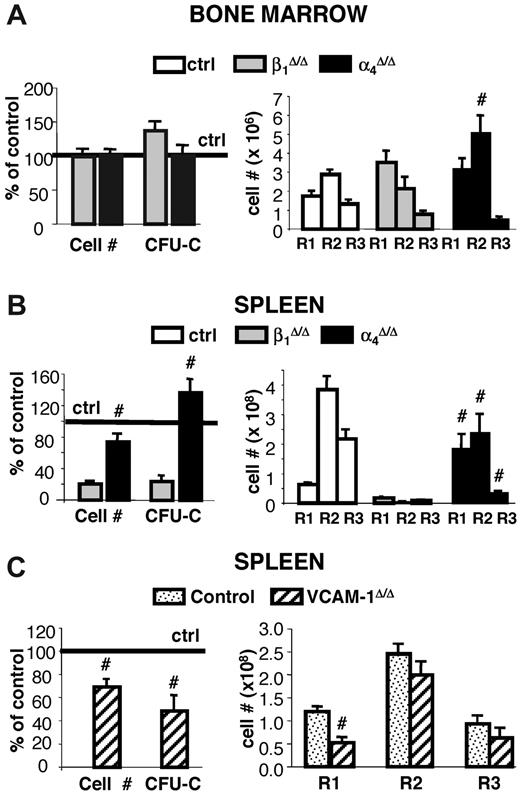
Whereas occasional death was seen in α4Δ/Δ mice after PHZ treatment, 90% of animals tested survived and responded to PHZ stress (supplemental Figure 1). A transient deficit in progenitor content was seen at day 4 in both BM and spleens of α4Δ/Δ compared with controls, but there was a quick recovery at day 6 and beyond (Figure 6). By day 6 after PHZ treatment, their response in spleen was normal in cellularity, progenitor content, and total erythroid cells compared with their controls, unlike the response of β1Δ/Δ mice (Figure 6). However, a defect in maturation profile was evident in both spleen and BM of these mice (Figure 6A-B right panels). This was probably responsible for their delayed hematocrit response to PHZ (supplemental Figure 1) and alluded to in our earlier publication.23 No differentiation defect was seen in the spleen or BM of VCAM-1Δ/Δ mice, in contrast to the 2 other models (Figure 6C).
Response to PHZ-induced erythroid stress in β1-, α4- and VCAM-1-deficient mice. Control (n = 23), β1Δ/Δ (n = 6), α4Δ/Δ (n = 8), and VCAM-1Δ/Δ (n = 5) mice were subjected to PHZ challenge and killed on day 6. (A) BM and (B-C) splenic responses were assessed in terms of cellularity and progenitor content (left panels) or erythroid differentiation (right panels). #Significant difference over the corresponding control (P < .05). Note that erythroblast maturation defects were not present in VCAM-1Δ/Δ mice.
Response to PHZ-induced erythroid stress in β1-, α4- and VCAM-1-deficient mice. Control (n = 23), β1Δ/Δ (n = 6), α4Δ/Δ (n = 8), and VCAM-1Δ/Δ (n = 5) mice were subjected to PHZ challenge and killed on day 6. (A) BM and (B-C) splenic responses were assessed in terms of cellularity and progenitor content (left panels) or erythroid differentiation (right panels). #Significant difference over the corresponding control (P < .05). Note that erythroblast maturation defects were not present in VCAM-1Δ/Δ mice.
Overall, α4Δ/Δ mice share the terminal maturation defects present in BM and spleen with β1Δ/Δ mice. The data are supportive of the concept that α5β1 exerts a critical influence on the accumulation and survival of hematopoietic progenitors in spleen (ie, on the Epo-dependent stage of erythroid cell differentiation), whereas α4 alone or together with α5 in β1Δ/Δ mice influences the Epo-independent maturation stages of erythropoiesis.
β1Δ/Δ integrin ablation in nonhematopoietic cells
Dramatic differences in erythroid stress responses are seen in the spleen versus BM of both β1Δ/Δ mice and mice transplanted with β1Δ/Δ cells. To explain some of these differences, we tested whether differences in nonhematopoietic cell β1 ablation in these 2 tissues may be responsible for this outcome. Three candidate populations (fibroblasts, endothelial cells, and resident Mϕs) were tested for β1 ablation after polyriboinosinic acid/polyribocytidylic acid treatment. Efficient ablation in Mϕs, but only partial ablation in fibroblastic cells, was found (supplemental Figure 5). The data for cells in spleen were similar.
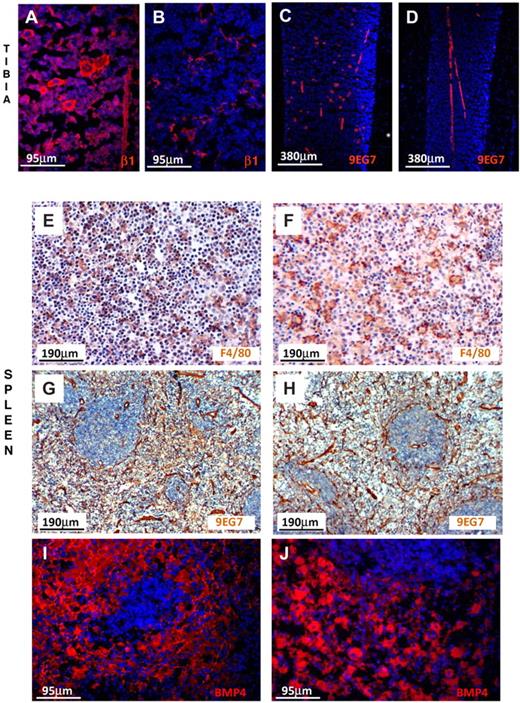
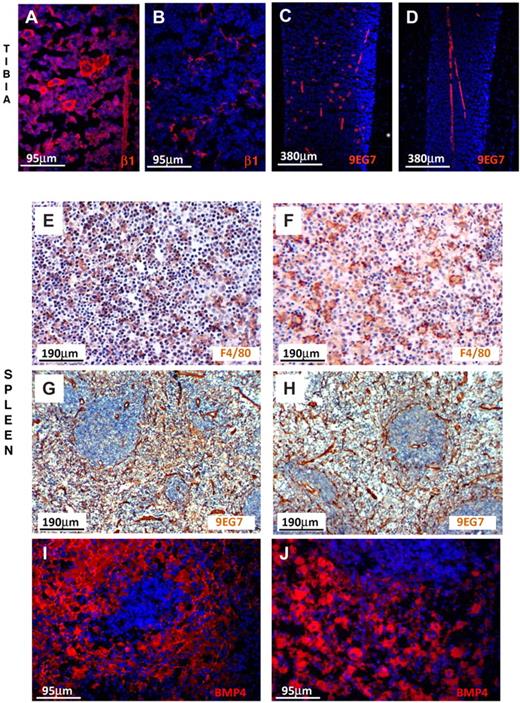
To examine the expression of β1 integrin in endothelial cells in situ both in BM and spleen, we labeled them with anti-β1 and with 9EG7, a monoclonal antibody reacting only with activated α4β1.38 As seen in Figure 7, endothelial cells in BM and spleen were similarly labeled in control and β1Δ/Δ tissues. Megakaryocytes were labeled only in controls, not in β1Δ/Δ, but were labeled in all mice with anti-CD31 (data not shown). Thus, among the 3 populations tested, we found no evidence for better ablation of β1 integrin in spleen versus BM to explain differences in response. Despite phenotypic similarities, however, it is possible that cells may behave differently in the 2 environments.
β1-integrin and BMP4 expression in BM and spleen. (A) Prominent labeling of endothelial cells and hematopoietic cells, including megakaryocytes, is seen in the normal tibia using anti-β1, but labeling of only endothelial cells is seen (B) in β1Δ/Δ tibia. (C) Labeling of endothelial cells and megakaryocytes with 9EG7 antibody (reacting with activated β1) in normal tibia. (D) Labeling only of endothelial cells in β1Δ/Δ tibia. (E) Splenic sections from normal mice after PHZ labeled for F4/80 (diaminobenzidine method) for macrophages and counterstained with hematoxylin. Note the abundance of small dark nuclei (erythroid cells). (F) Splenic sections from β1Δ/Δ mice after PHZ. Fewer erythroid cells together with many unengaged macrophages. (G) Splenic sections from normal mice labeled with 9EG7 antibody (activated β1). Prominent labeling of endothelial cells is seen. (H) Splenic sections from β1Δ/Δ mice similarly labeled with 9EG7. (I) BMP4 labeling of normal spleen after PHZ (day 6) and (J) of β1Δ/Δ spleen. Note the intense labeling of red pulp in both types of spleens. Fluorescent images shown in panels A-D and panels I-J were visualized with Alexa 594, mounted with Vectashield Mounting Medium with 4,6-diamidino-2-phenylindole (Vector Labs) and acquired at room temperature using a Leica DMLB fluorescence microscope (with appropriate filters) and a Spot RT Slider camera using SPOT Advanced software (Version 4.6, Diagnostic Instruments). (E-H) Visualized with diaminobenzidine and hematoxylin were taken at room temperature using an Olympus BH-2 microscope outfitted with a Nikon Coolpix 995 digital camera. Magnification bars are inserted. Some adjustments for brightness, contrast, and color balance using Adobe Photoshop were made.
β1-integrin and BMP4 expression in BM and spleen. (A) Prominent labeling of endothelial cells and hematopoietic cells, including megakaryocytes, is seen in the normal tibia using anti-β1, but labeling of only endothelial cells is seen (B) in β1Δ/Δ tibia. (C) Labeling of endothelial cells and megakaryocytes with 9EG7 antibody (reacting with activated β1) in normal tibia. (D) Labeling only of endothelial cells in β1Δ/Δ tibia. (E) Splenic sections from normal mice after PHZ labeled for F4/80 (diaminobenzidine method) for macrophages and counterstained with hematoxylin. Note the abundance of small dark nuclei (erythroid cells). (F) Splenic sections from β1Δ/Δ mice after PHZ. Fewer erythroid cells together with many unengaged macrophages. (G) Splenic sections from normal mice labeled with 9EG7 antibody (activated β1). Prominent labeling of endothelial cells is seen. (H) Splenic sections from β1Δ/Δ mice similarly labeled with 9EG7. (I) BMP4 labeling of normal spleen after PHZ (day 6) and (J) of β1Δ/Δ spleen. Note the intense labeling of red pulp in both types of spleens. Fluorescent images shown in panels A-D and panels I-J were visualized with Alexa 594, mounted with Vectashield Mounting Medium with 4,6-diamidino-2-phenylindole (Vector Labs) and acquired at room temperature using a Leica DMLB fluorescence microscope (with appropriate filters) and a Spot RT Slider camera using SPOT Advanced software (Version 4.6, Diagnostic Instruments). (E-H) Visualized with diaminobenzidine and hematoxylin were taken at room temperature using an Olympus BH-2 microscope outfitted with a Nikon Coolpix 995 digital camera. Magnification bars are inserted. Some adjustments for brightness, contrast, and color balance using Adobe Photoshop were made.
To further understand the mechanisms responsible for observed impairment in stress erythropoiesis in spleen, we assessed the expression of BMP4, a signaling molecule implicated in stress erythropoiesis27,28 and produced by stromal and hematopoietic cells.39 By quantitative reverse-transcribed polymerase chain reaction (data not shown) and as supported by immunofluorescent staining, no gross differences in BMP4 expression were found in the spleens of β1Δ/Δ versus control mice (Figure 7I-J). Furthermore, we assessed the role of Mϕs by treating mice with clodronate (supplemental Figure 6). Although the response of clodronate-treated animals to PHZ challenge was severely compromised (supplemental Figure 6 top panels), the interpretation of these experiments is confounded by the effects of clodronate treatment in spleen beyond Mϕ purging (supplemental Figure 6 bottom panels).
Discussion
Studies using several genetic mutant mice have shown impaired responses to erythroid stress, although erythropoiesis is fairly normal at homeostasis (ie, ICAM,3 Gas-6,7 and Stat5a,b35 Rac1/2).18 Furthermore, in several models of stress erythropoiesis, impairment of response is observed in both BM and spleen or only in one of these tissues. For example, in the absence of the glucocorticoid receptor, erythropoiesis is compromised both in BM and spleen.40 Yet, in other models (ie, in Rb null mice), prominent changes are seen only in the spleen.41,42 In contrast to Rb, the absence of Rac1/Rac2 signals leads to defective early erythropoiesis in BM, but in the spleen erythropoiesis is completed successfully, as the splenic environment apparently circumvents the need of Rac1/Rac2 in early erythropoiesis.
Our results with β1Δ/Δ mice have some features in common to previously described mutant mice, but others appear to be unique to our model. Similar to Rb null mice42 or the TRalpha null mice43 and FAK−/− mice44 and in sharp contrast to Rac1/Rac2-deficient mice,18 defects in β1Δ/Δ mice are prominent only in the spleen, leading to failure to survive stress (Figure 2). Precise mechanistic differences between BM and spleen responses have not been explored in most of the cases, although several insights have been obtained. For example, it was previously shown that convergence of Sonic hedgehog (Shh), BMP4, and stem cell factor-dependent signaling in spleen is necessary for the development and expansion of BMP4-resposive stress erythroid progenitors.27,28 Thus, SmoΔ/Δ mice,28 with absence of Shh signaling, do not recover from a second PHZ treatment,28 resulting from failed splenic response.
In our β1Δ/Δ mice, the generation of progenitor cells by BM and their egress to PB, which is necessary for subsequent colonization of the spleen as it occurs in normal animals, was not impaired (Figure 4; Table 1). But why did these progenitors not accumulate in β1Δ/Δ spleens? To explain these data, we entertained the following mechanistic scenarios
An attractive possibility is that progenitors generated in BM and delivered to circulation, as shown by their increase in PB after PHZ (Table 1), cannot home and/or cannot be firmly retained in the spleen if they lack β1 integrin. Such homing/retention properties may be dependent primarily on the presence of α5β1 because in the other 2 related mutants (ie, the α4Δ/Δ or VCAM-1Δ/Δ mice in which fibronectin/α5 interactions are present), homing of progenitors to spleen is not impaired.23 Consistent with this concept, previous data with fetal liver β1 knockout cells have shown failure of BM and splenic colonization by fetal liver β1 null cells45 ; and in another study, there was a small decrease in homing to irradiated spleen with anti-α5 integrin antibody-treated donor cells.15 However, our present data, showing no significant impairment of splenic homing in nonirradiated recipients given adult ablated β1 cells (Figure 5; supplemental Figure 1), appear inconsistent with these data. In this context, it is important to emphasize that homing in some of the previous data was evaluated by successful engraftment (colonization), whereas in our studies we have dissociated homing/lodgment events from subsequent expansion/engraftment events with β1Δ/Δ cells. Despite the normal homing, we found that the development of CFU-S was significantly impaired in β1Δ/Δ mice as shown by the reduced number and size of CFU-S (Figure 5), suggesting impairment in survival and/or expansion of homed progenitors. Thus, the absence of β1 signaling in the context of fibronectin-dependent interactions in the spleen has a profound impact on progenitor cell survival and proliferation. Activation of signaling pathways intersecting β1 integrin signaling46 may promote expression of unique sets of genes responsible for cell proliferation/survival, and our data in β1-decifient PHZ-treated spleens are consistent with this thesis.
The connection of β1 or α5β1 signaling with survival and/or proliferation is supported by a host of previous data:
Fibronectin, and not VCAM-1, is the preferential ligand for cycling cells, and α5 integrin is up-regulated in cycling cells, in contrast to α4, which is not different in cycling versus noncycling cells.47
In vivo treatment of mice with C274, the RGD-dependent recombinant fibronectin, reduced splenic progenitor growth (HPP-CFC).12 By contrast, treatment with CH296 fibronectin containing all binding sites, including the CS-1 VLA4 binding site, did not decrease splenic progenitors.
Donor cells treated with a rabbit anti-β1 antibody resulted in reduced numbers of CFU-S in irradiated normal spleen.48
Wv mutant mice, which have an impaired splenic response to stress after PHZ or after transplantation, are not able to activate α5.12
Impairment of β1-dependent FAK in conditional mutant mice led to a picture of PHZ response similar to our β1Δ/Δ mice with drastically reduced splenic response and decreased proliferation and survival of progenitor cells.44
α5β1 integrin influenced Shh signaling in intestinal epithelia proliferation, and the phenotypic changes of β1 deletion in intestinal epithelial cells were strikingly similar to mice with defective Shh expression or signaling. In aggregate, these findings, together with our own, support the concept of impaired survival and proliferation of α5β1-deficient progenitors in the stress splenic environment.
But why would an intrinsic defect like β1-deficiency lead to impaired interactions selectively within the splenic environment? It is possible that in the spleen, in contrast to BM, retention and subsequent development of erythroid cells are mainly an Arg-Gly-Asp (RGD)-dependent process (RGD being the best known recognition sequence in fibronectin for α5β1 integrin). This process will fail in β1Δ/Δ mice in which erythroid cells lack α5β1. However, in BM other redundant signals on erythroid cells (ie, CD44, α4β7, and β7 integrin) can interact with environmental ligands unique to BM (ie, tenascin-C, laminin species, osteopontin, thrombospondin, syndecan-4, or heparan sulfate proteoglycans),46,49 and usurp or substitute for the RGD effects on developing erythroid cells. Furthermore, beyond RGD-dependent effects, it is possible that other ME cells or matrix in BM display distinct functional behavior compared with spleen. Such a functional difference could be attributed to differences in the efficiency of the ablation of β1 integrin between BM versus splenic stromal cells. We have obtained no evidence that cultured fibroblasts are better ablated in BM versus the spleen, whereas endothelial cells in both BM and spleen are, like normal cells, positive for β1 and9EG7, an antibody that reacts with the activated form of β138 (Figure 7), suggesting no effective β1 ablation. The latter data are consistent with difficulties previously encountered with ablation of β1 integrin in adult endothelial cells.50 By contrast, Mϕs or F4/80+ cells in the BM and the great majority of those in the spleen are ablated for β1 integrin. However, despite phenotypic appearances and depending on the signals they receive from their MEs, it is possible that the Mϕs are functionally different between these 2 tissues as previously shown for other tissues.51 Nevertheless, it is doubtful that only the functional impairment of β1Δ/Δ macrophages can explain the severe phenotype in β1Δ/Δ spleens, as all classes of progenitors were affected. Furthermore, the functional role of Mϕs in proliferation/maturation/enucleation of erythroid cells has not been fully elucidated, and controversial information is currently available regarding the molecular interactions between erythroid cells and Mϕs (ie, ICAM-4/αvβ3).52 Although many of the maturational defects have been cell-intrinsic (glucocorticoid receptor, thyroid receptor, β1 integrin), the specific interactions of these structures with ME cells or their effects on apoptosis pathways specifically activated in spleen in erythroid stress have been unclear.
Although progenitor defects in spleen quickly recovered in PHZ-treated α4Δ/Δ mice, defects on terminally differentiated cells were present in both α4- and β1-deficient animals. Because the differentiation defects were similar in α4Δ/Δ and β1Δ/Δ mice, it is possible that interactions of both α4 and α5 through fibronectin or the interaction of α4 with both fibronectin and Mϕs are needed for efficient terminal erythroid differentiation. It is tempting to speculate that the effect in β1Δ/Δ mice is a combination of absent α5 together with hypofunctional α4, compromising adhesive interactions with both fibronectin and Mϕs in spleen. The presence of α4β7 did not seem to provide any protective effect in β1Δ/Δ mice. It is of interest that, despite prior implications of VCAM-1,5 there was absence of differentiation defects in VCAM-1Δ/Δ mice in our experiments (Figure 6) that were consistent with experiments in fetal liver, in which the effects of VCAM-1 were dissociated from those of α4β1.53 Moreover, using K562 cells as a model, it was shown that prolonged engagement to fibronectin throughVLA5 (α5β1) triggered the induction of α4 in K562 cells (normally lacking α4) and the up-regulated α4 influenced erythroid differentiation by activating p38, an effect blocked by the RGD peptide.11 Thus, the weight of evidence from previous and present data seems to support the notion that, at least in adults, α4β1 interactions (with fibronectin or other partners) may be important for influencing terminal erythroid differentiation, probably within the context of EI, and may act in parallel or in cooperation with αv integrins (interacting with ICAM4 and VLA4 on erythroid cells).3 However, further studies are needed to clarify some of these issues.
Transplanted mice reconstituted with β1Δ/Δ cells had a somewhat better erythroid response (Figure 4), suggesting that the stroma in the spleens of transplanted mice may have contributed to this. A cellular candidate of host origin that might have made a difference in transplanted animals is the F4/80+ Mϕs in the spleen. Although the total number of F4/80+ cells was not significantly different in nontransplanted versus transplanted animals, the proportion of β1+ F4/80+ cells was higher (23% vs < 10% in β1Δ/Δ) in transplanted animals, indicating incomplete reconstitution of Mϕ population by donor cells. Thus, the presence of β1+ Mϕs (ie, αvβ1+) could engage β1Δ/Δ erythroid cells through ICAM-43 or through other undefined ways to promote erythroid expansion and terminal maturation. Intrinsic functional defects in β1Δ/Δ Mϕs are also possible. In this context, it was recently noted that, using Lysozyme M-mediated ablation of β1 in Mϕs, β1 integrin is important for Mϕ maturation, as F-actin assembly in these cells was impaired through diminished Rac expression.54 A similar defect in EMP null Mϕs led to failure of enucleation in erythroid cells.6
In conclusion, our data evaluating stress erythropoiesis in 3 genetically deficient animals (β1conditional, α4, and VCAM-1 with Tie-2Cre-mediated ablation) redefine the functional role of α5 and α4 integrins in this process and their distinctive interactions in BM versus spleen.
An Inside Blood analysis of this article appears at the front of this issue.
The online version of this article contains a data supplement.
The publication costs of this article were defrayed in part by page charge payment. Therefore, and solely to indicate this fact, this article is hereby marked “advertisement” in accordance with 18 USC section 1734.
Acknowledgments
The authors thank Peirong Wang for his assistance with the photographs. Clodronate was supplied by Roche Diagnostics (Germany), and encapsulated liposomes were from Dr Nico van Rooijen, Department of Cell Biology and Immunology, Faculty of Medicine, Vrije Universiteit, Amsterdam, The Netherlands.
This work was supported by the National Institutes of Health (grants HL058734 and HL46557).
National Institutes of Health
Authorship
Contribution: T.U. performed experiments and wrote relevant parts of the manuscript; Y.J., S.P., and B.N. performed experiments; and T.P. designed the experiments, evaluated data, and wrote the manuscript.
Conflict-of-interest disclosure: The authors declare no competing financial interests.
Correspondence: Thalia Papayannopoulou, Department of Medicine, Division of Hematology,1705 NE Pacific Street, Box 357720, Seattle, WA 98195; email: thalp@uw.edu.
References
Author notes
T.U. and Y.J. contributed equally to this study.


![Figure 4. Inability of β1Δ/Δ mice to respond to hemolytic stress is largely cell autonomous. Lethally irradiated wild-type recipients were reconstituted with β1Δ/Δ or β1+ BM cells and after reconstitution were treated with PHZ to induce acute hemolytic anemia. Six days after the first PHZ injection, mice were killed, and cellularity, progenitor content, and erythroid differentiation (number of TER119/CD71+ cells in gates R1 [CD71hi/TER119lo], R2 [CD71hi/TER119hi], and R3 [CD71lo/TER119hi]) were assessed in the spleen (top panel) and BM (middle panel). Transplanted (Tx) mice (ctrl, n = 6; and β1Δ/Δ, n = 6) were compared with corresponding nontransplanted counterparts. *Significant difference over the respective β1+ control group. Cross-hatched bars represent transplanted; and white bars, nontransplanted. P < .05. #Significant difference over nontransplanted counterparts (P < .05). Note that transplanted β1Δ/Δ mice (black bars) have a similar response to PHZ as nontransplanted β1Δ/Δ mice (gray bars). The bottom panel shows the difference in spleen sizes of 2 control-transplanted mice (+/+ recipients transplanted with +/+ donor cells) after PHZ treatment at day 6 (left), compared with 2 β1Δ/Δ-transplanted mice (+/+ recipients transplanted with β1Δ/Δ cells, right). Spleens were photographed with a Nikon Coolpix 995 camera next to a ruler measuring millimeters.](https://ash.silverchair-cdn.com/ash/content_public/journal/blood/117/3/10.1182_blood-2010-05-283218/4/m_zh89991063820004.jpeg?Expires=1769541730&Signature=G9ZWHE7PfpiDQpLJsd~XThUkTzik5fsnxY7v~NpGUuJLE6Z5e6sKE1uIirjNZyMLYTp2boG-GK2aI4QfrcBvUFqVzeND4DB9bAtkaAPt2IrbZ-hTrvBWXVj9W~Oe617EYj5JHl6iNWnIALPhbbYS2dRvUS89c13ZNciS5YCmjMBUniKXjAFytiKu-uxCl7-oqFSwFiAXKMi0gVYeNskJ-xyYahF5T-tNDtWX1wxJc6dxz1r0rGS~KU-xhbLgeZA14z8i~augVRaSxhPX4JIVUZiWXh9UiZxrk3xjrrEBhB84J8DO19UrIEPpmwPigqHq9okIOs2Uza0lFgC0nDL8Nw__&Key-Pair-Id=APKAIE5G5CRDK6RD3PGA)

![Figure 4. Inability of β1Δ/Δ mice to respond to hemolytic stress is largely cell autonomous. Lethally irradiated wild-type recipients were reconstituted with β1Δ/Δ or β1+ BM cells and after reconstitution were treated with PHZ to induce acute hemolytic anemia. Six days after the first PHZ injection, mice were killed, and cellularity, progenitor content, and erythroid differentiation (number of TER119/CD71+ cells in gates R1 [CD71hi/TER119lo], R2 [CD71hi/TER119hi], and R3 [CD71lo/TER119hi]) were assessed in the spleen (top panel) and BM (middle panel). Transplanted (Tx) mice (ctrl, n = 6; and β1Δ/Δ, n = 6) were compared with corresponding nontransplanted counterparts. *Significant difference over the respective β1+ control group. Cross-hatched bars represent transplanted; and white bars, nontransplanted. P < .05. #Significant difference over nontransplanted counterparts (P < .05). Note that transplanted β1Δ/Δ mice (black bars) have a similar response to PHZ as nontransplanted β1Δ/Δ mice (gray bars). The bottom panel shows the difference in spleen sizes of 2 control-transplanted mice (+/+ recipients transplanted with +/+ donor cells) after PHZ treatment at day 6 (left), compared with 2 β1Δ/Δ-transplanted mice (+/+ recipients transplanted with β1Δ/Δ cells, right). Spleens were photographed with a Nikon Coolpix 995 camera next to a ruler measuring millimeters.](https://ash.silverchair-cdn.com/ash/content_public/journal/blood/117/3/10.1182_blood-2010-05-283218/4/m_zh89991063820004.jpeg?Expires=1769541731&Signature=m948cae2x0ILfhRuScF8~nHYFIilkOpHOri8CKnRFiR0452~AwCnKrWg3kDAgRAAGGTqZrE4ht~s1aVluyBKHih6KrOg1YzF055xGSFORJ1Ghx633vdFo2TRbuXwrS9Km~aTC58W5zNE3qxkVIH59rUNWL~yhQT1~ajeaKvmWV2TvxSFeMWm8bs17YbCEarjaPwQSXH0ibnY-1zlqeZ161GcBOsOn6UjVV14f6dPDhu6~csCQwGPy0RyYVn90z16fLVEH-80ZSf057j6o3-z8PpZBIOl6JLCb3BQt5kEoWOrbhAjH94FVFiP8w95FbOMTmXQEzUE8NWfFSlc6MIQaQ__&Key-Pair-Id=APKAIE5G5CRDK6RD3PGA)
