Abstract
The longevity of organisms is maintained by stem cells. If an organism loses the ability to maintain a balance between quiescence and differentiation in the stem/progenitor cell compartment due to aging and/or stress, this may result in death or age-associated diseases, including cancer. Ewing sarcoma is the most lethal bone tumor in young patients and arises from primitive stem cells. Here, we demonstrated that endogenous Ewing sarcoma gene (Ews) is indispensable for stem cell quiescence, and that the ablation of Ews promotes the early onset of senescence in hematopoietic stem progenitor cells. The phenotypic and functional changes in Ews-deficient stem cells were accompanied by an increase in senescence-associated β-galactosidase staining and a marked induction of p16INK4a compared with wild-type counterparts. With its relevance to cancer and possibly aging, EWS is likely to play a significant role in maintaining the functional capacity of stem cells and may provide further insight into the complexity of Ewing sarcoma in the context of stem cells.
Introduction
Ewing sarcoma is an aggressive disease that predominantly afflicts children and young adults, in which cancer cells proliferate in bones and soft tissues.1 The Ewing sarcoma gene (EWS) encodes an RNA binding protein whose specific functional targets are largely unknown,2 but abnormal fusion between the EWS N-terminus and the C-terminus of various transcription factors is thought to be the primary cause of Ewing sarcoma.3 The t(11;22)(q24;q12) translocation, which fuses the EWS and Fli-1 (Friend leukemia virus integration 1) genes, accounts for most cases of Ewing sarcoma. The chromosomal translocation creates a chimeric oncogene encoding a transactivating domain from the EWS protein and the DNA binding domain of Fli-1.3 EWS-Fli-1 expression results in a bypass of cellular senescence,4 implying a molecular link between EWS and cellular senescence.
Unexpectedly, ectopic expression of EWS-Fli-1 in primary cells or cell lines induces growth arrest or cell death rather than promoting cellular transformation, suggesting that cellular context is critical for the oncogenic potential of EWS-Fli-1.5 Recent studies have demonstrated that human and mouse bone marrow (BM) mesenchymal stem cells expressing EWS-Fli-1, when engrafted into NOD/SCID mice, induce a malignancy with similar pathologic features as Ewing sarcoma.6,7 These data indicate that mesenchymal stem cells provide a permissive environment for EWS-Fli-1–mediated transformation, suggesting that Ewing sarcoma occurs at the level of stem/progenitor cells. Consistent with this observation, ectopic expression of an EWS-ERG fusion protein in hematopoietic progenitor cell results in leukemia.8 In addition, Cre-mediated activation of EWS-Fli-1 in Cre-inducible EWS-Fli-1 mice results in rapid development of myeloid/erythroid leukemia, thereby strengthening the molecular link between this oncogene and hematopoietic malignancy.3 Indeed, EWS-Fli-1 translocation is also found in pediatric patients with acute lymphoblastic leukemia,9,10 although it is more commonly found in Ewing sarcoma patients.
Among the tissue-specific stem cell types, the hematopoietic stem cell (HSC) is the most fully characterized, as defined by phenotypic markers and in vivo and in vitro functional assays.11-13 Therefore, HSCs and derived hematopoietic progenitor cells (HPCs) are excellent candidates for an investigation of molecular determinants that direct stem cells toward either senescence or the excessive longevity that underlies tumorigenesis. In the current study, we investigated the role of Ews, which is critical to the pathogenesis of Ewing sarcoma, in the regulation of stem cell senescence.
Methods
Mice
Homozygous Ews-null mice (Ews−/−, Ews knockout [KO]) were generated as described previously.14 All experiments were performed with littermates as controls, unless stated otherwise. The genotyping was performed by PCR analysis with the following primer sets: wild-type 5′-TGGATCCTACAGCCAGGCTCC-3′, 5′-TGCTCGCTAGTGCTCTGTGAGCAGGAC-3′; mutant 5′-TGGATCCTACAGCCAAGCTCC-3′, 5′-CCTGTATGAGTCCTGGTGT GGGTC-3′, and with the following parameters: 40 cycles of 94°C for 45 seconds, 58°C for 45 seconds, and 72°C for 45 seconds. All animal experiments were carried out at the University of Pittsburgh in accordance with the Guide for the Care and Use of Laboratory Animals.
CFC and CAFC assays
All colony-forming cell (CFC) assays were performed in triplicate using MethoCult (StemCell Technologies). The cobblestone area–forming cell (CAFC) assay was performed as described previously.15 Wells containing cobblestone areas were counted as positive wells.
Spleen colony-forming unit (CFU-S12) assay
BM cells were transplanted into lethally irradiated recipient mice by tail vein injection. After 12 days, the spleens were excised, fixed in Bouin fixative solution (Ricca Chemical Company) and destained in 75% ethanol overnight. After fixation, CFU-S was counted under a dissecting microscope.
Competitive long-term repopulating cell assay
The competitive repopulation assay was performed using CD45.1.2 mice as recipients. An equal number (5 × 10⁵) of Ews wild-type (WT)/KO (CD45.2) and competitor (CD45.1) BM cells were transplanted into lethally irradiated CD45.1.2 recipient mice. Peripheral blood was drawn from the recipient mice at various times after transplantation, and the ratio of CD45.1/CD45.2 cells was assessed by flow cytometry (Beckman Coulter).
Quantitative real-time PCR
Total RNA was isolated from either Lin− or Lin−, Scal+, c-kit+(LSK) cells using the RNeasy Micro kit (QIAGEN). Reverse transcription of total RNA was performed using the QuantiTech reverse transcription kit (QIAGEN). Primers for p53, Ews, Ezh2, and Rb were purchased from Applied Biosystems. The DyNAmo HS SYBR Green qPCR kit (New England Biolabs) was used for the amplification of p16Ink4a, p19Arf, and p21Cip1/WAF1. The sequence of primers used are as follows: for p16Ink4a, forward 5′-CGAACTCTTTCGGTCGTACCC-3′, reverse 5′-CGAATCTGCACCGTAGTTGAGC-3′; for p19Arf, forward 5′-GTTCTTGGTCACTGTGAGGATTCAG-3′, reverse 5′-CCATCATCATCACCTGGTCCAG-3′; for p21Cip1/WAF1, forward 5′-GACAGTGAGCAGTTGCG-3′, reverse 5′-CTCAGACACCAGAGTGC-3′; and for β-actin, forward 5′-GAAATCGTGCGTGACATCAAAG-3′, reverse 5′-TGTAGTTTCATGG-ATGCCACAG-3′.
γ-H2AX staining
Cells were placed onto poly-L-lysine coated slides (Polysciences) by cytospin. Cells were incubated with anti–phospho-histone H2AX (Ser139) antibody (Millipore) followed by Alexa Fluor 488 secondary antibody (Invitrogen). The nuclei were stained with DAPI (Invitrogen). γ-H2AX foci were counted under a UV microscope (Zeiss) in a blinded fashion.
SA-β-gal staining
For immunohistochemical localization of SA-β-gal, LSK cells were stained with freshly prepared SA-β-Gal solution (1 mg/mL X-gal, 5mM potassium ferricyanide, 5mM potassium ferrocyanide, 150mM NaCl and 2mM MgCl2 in PBS, pH 6.0) overnight at 37°C in the dark. The SA-β-gal activity was also assayed by flow cytometry using C12FDG as described by the manufacturer (Molecular Probes). For whole embryo staining, embryonic day (E)16.5 to E18.5 embryos were excised and fixed in 4% paraformaldehyde for 30 to 40 minutes on ice. Staining was performed as described.
Serial transplantation
All recipient mice were irradiated lethally at a dose of 11 Gy (Shepherd Mark I 68 irradiator, 137Cs γ source) 8 to 24 hours before transplantation. At 1 to 2 months after each transplantation, BM cells from primary recipient mice were transplanted into secondary recipients and the same procedure was repeated in tertiary transplantations.
Cell-cycle analysis
Cell-cycle analysis of hematopoietic stem progenitor cells (HSPCs) was performed as previously described.16 Briefly, Ews+/+ (WT) and Ews−/− (KO) BM cells were stained with the following antibodies: PE or Alexa Fluor 700–conjugated anti–Sca-1 (D7); APC-conjugated anti–c-kit (2B8); FITC-conjugated or biotinylated CD34 (RAM34); and lineage markers PE-Cy7–conjugated anti-CD3 (CT-CD3), anti-CD4 (CT-CD4), anti-CD8 (CT-CD8a), anti-CD45R (RA3-6B2), anti-CD11b (M1/70.15), anti–Gr-1 (RB6-8C5), anti–TER-119 (TER-119), and FITC- or PE-Texas Red–conjugated anti-CD34 antibodies. For cell-cycle analysis, HSPCs were further stained using Hoechst 33342 and Pyronin-Y.
Th1/Th2 cytokine analysis
A total of 200 μg of TNP-Ovalbumin (Biosearch Technologies) emulsified in Freund adjuvant complete (Sigma) was injected subcutaneously into the back and in both hind footpads of 3- to 4-week-old WT and KO littermates. Nine days after immunization, spleen cells were plated at 2 × 10⁶ cells/mL in RPMI-1640 10% FBS. Variable concentrations of ovalbumin (USB) were challenged in vitro. Supernatants were collected 3 days after stimulation and cytokine concentration was measured using an enzyme-linked immunosorbent assay kit (eBioscience).
Statistical analysis
All P values were determined by Student t test and one-way ANOVA. Statistical significance was set for P values < .05.
Results
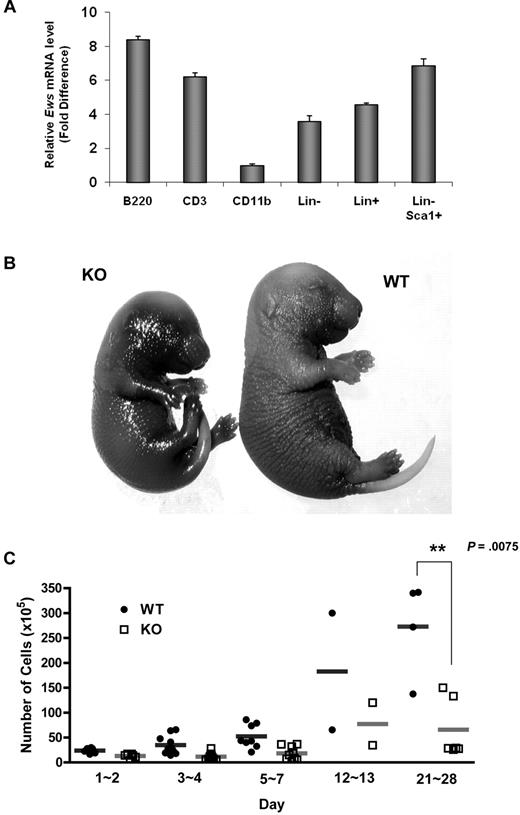
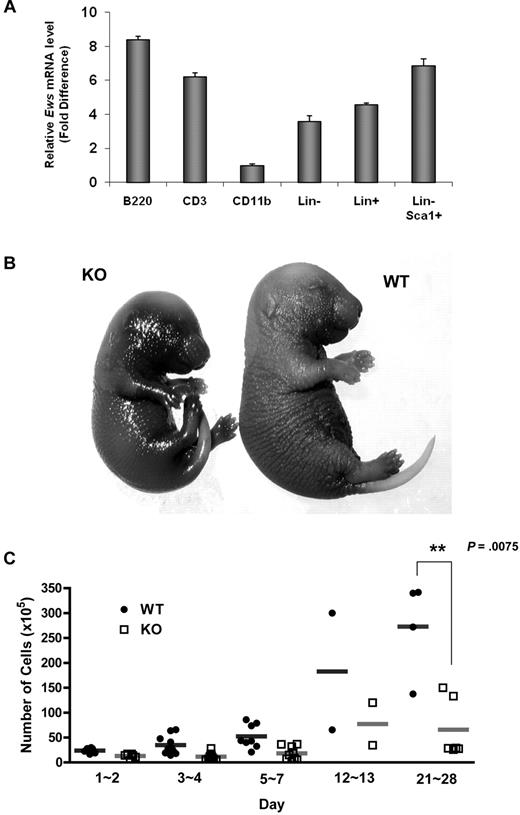
Ews encodes an RNA binding protein that is ubiquitously expressed in most adult tissues.17 Quantitative RT-PCR analysis showed that Ews is broadly expressed in different subsets of BM cells (Figure 1A). However, its expression level differed depending on cell type. While Ews is expressed at almost comparable levels in both lineage negative (Lin−) and positive (Lin+) cells, more abundant Ews expression was noted when stem/progenitor cells were further enriched (Lin−Sca1+). Ews was most highly expressed in B220+ cells, but showed a low abundance in CD11b+ cells.
Ews deletion accelerates cellular senescence from prenatal stages and leads to a significant decrease in BM cellularity. (A) The mononuclear cells from normal adult mice were sorted based on lineage marker expression. Antibodies to B220, CD3, and CD11b were used to enrich B (from spleen), T (from thymus), and myeloid (from BM) lineages, respectively. Lineage-negative (Lin−) and positive (Lin+) BM cells were enriched by magnetic separation. Lin− cells were further fractionated on the basis of Sca1 expression (Lin− Sca1+). The purity of the sorted populations was > 92%. Quantitative RT-PCR was performed as described in “Quantitative real-time PCR.” Expression was normalized to the endogenous Gapdh. The fold difference in expression of Ews was calculated using the ΔΔCt method. CD11b+ cells, where the lowest Ews expression was detected, was set arbitrarily as 1.0. Data are presented as mean values ± SD. (B) Embryos (E16.5-E18.5) were collected from pregnant dams and stained for SA-β-gal. Pictures show representative embryos from 3 additional independent experiments. (C) BM cells from Ews+/+ and Ews−/− mice were harvested during the postnatal period. Total nucleated BM cellularity was determined by hemocytometer counting from birth through postnatal day (PND) 28. **P = .0075 by 2-tailed Student t test.
Ews deletion accelerates cellular senescence from prenatal stages and leads to a significant decrease in BM cellularity. (A) The mononuclear cells from normal adult mice were sorted based on lineage marker expression. Antibodies to B220, CD3, and CD11b were used to enrich B (from spleen), T (from thymus), and myeloid (from BM) lineages, respectively. Lineage-negative (Lin−) and positive (Lin+) BM cells were enriched by magnetic separation. Lin− cells were further fractionated on the basis of Sca1 expression (Lin− Sca1+). The purity of the sorted populations was > 92%. Quantitative RT-PCR was performed as described in “Quantitative real-time PCR.” Expression was normalized to the endogenous Gapdh. The fold difference in expression of Ews was calculated using the ΔΔCt method. CD11b+ cells, where the lowest Ews expression was detected, was set arbitrarily as 1.0. Data are presented as mean values ± SD. (B) Embryos (E16.5-E18.5) were collected from pregnant dams and stained for SA-β-gal. Pictures show representative embryos from 3 additional independent experiments. (C) BM cells from Ews+/+ and Ews−/− mice were harvested during the postnatal period. Total nucleated BM cellularity was determined by hemocytometer counting from birth through postnatal day (PND) 28. **P = .0075 by 2-tailed Student t test.
Ews−/− offspring were viable and appeared grossly normal at birth. However, Ews−/− mice displayed aging-like phenotypes, and these phenotypes became more apparent with increasing age. We questioned whether Ews deficiency also impacts the onset of senescence during embryonic development. When we assessed senescence-associated β-galactosidase activity (SA-β-gal), Ews−/− embryos at a late stage of gestation had significantly higher levels of endogenous SA-β-gal activity compared with WT embryos (Figure 1B), suggesting that senescence has already begun from prenatal stages.
Ews−/− mice also presented a dramatic loss of cellularity in major hematopoietic organs. While BM cellularity was similar among WT and Ews−/− mice in the early postnatal period (from the day of birth to postnatal day 2), the difference in BM cellularity became progressively more significant as the pups matured (Figure 1C). A significant loss of cellularity was also observed in spleen and thymus of Ews−/− mice (data not shown).
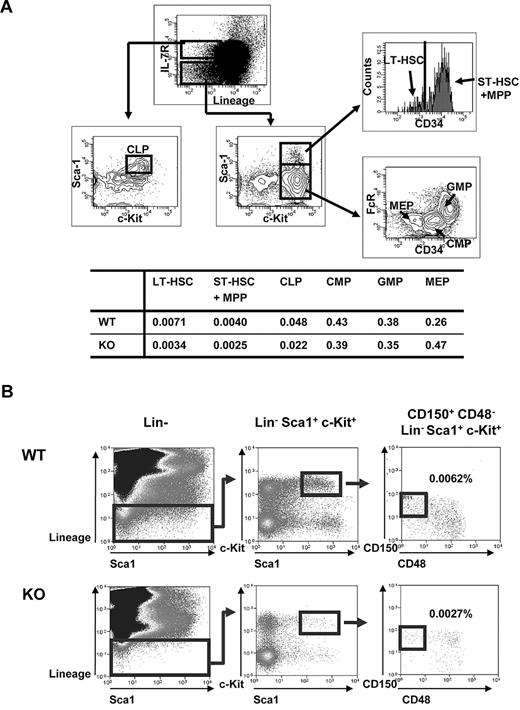
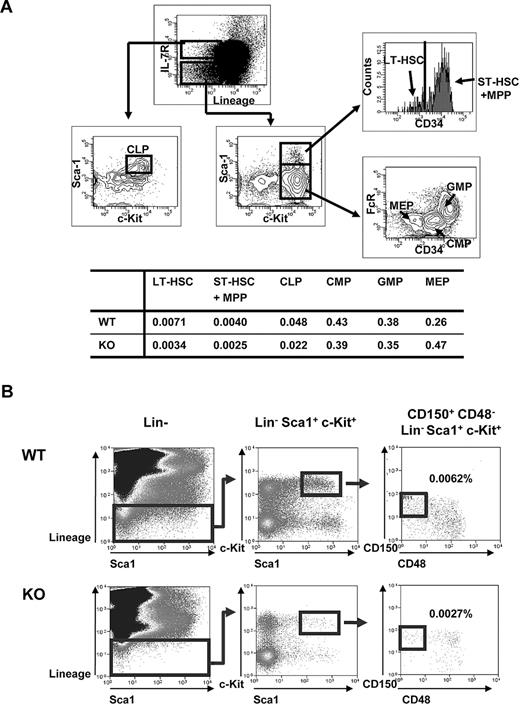
Given the decrease in BM cellularity in Ews−/− mice, we asked whether this deficit is related to an alteration of stem/progenitor populations. The numbers of long-term (Lin−, Sca1+, c-Kit+, and CD34−; LT-HSC) and short-term (Lin−, Sca1+, c-Kit+ and CD34+; ST-HSC) HSCs were detected at an approximately 2-fold lower level in the Ews−/− mice compared with WT littermates (Figure 2A). The percentage of common lymphoid progenitor cells (CLP) was also lower compared with WT controls. In contrast, despite the reduced frequency of stem/progenitor cells, myeloid progenitors (common myeloid progenitors, CMP; and granulocyte-monocyte progenitors, GMP) in Ews−/− mice were not significantly lower compared with WT mice. Ews deficiency also led to an approximately 2-fold reduction in the number of CD150+, CD48−, Lin−, c-Kit+, Sca1+ cells (Figure 2B), which consist of a highly enriched population of HSC.18 The diminution of HSPCs and lymphoid populations, but not of myeloid progenitor cells, in Ews−/− mice resembled the change in HSCs/HPCs and lymphoid populations previously described in FoxO−/−,19 Bmi-1−/−20 and Klotho−/−21 mice, all of which exhibit aging-like phenotypes.
Analysis of hematopoietic stem and progenitor cell populations in Ews KO and WT mice. (A) Top panel: schematic diagram of gating strategy; freshly isolated BM cells from Ews−/− and WT littermate control (Ews+/+) mice were stained with the indicated antibodies and analyzed by flow cytometry. LT-HSC indicates long-term hematopoietic stem cell (defined as Lin−Sca1+ c-Kit+ and CD34−); and ST-HSC + MPP, short-term hematopoietic stem cell including multipotent progenitors (defined as Lin−Sca1+c-Kit+ and CD34+). CLP indicates common lymphoid progenitors; CMP, common myeloid progenitors; GMP, granulocyte-monocyte progenitors; and MEP, megakaryocyte-erythroid precursor. Bottom panel: the percentage of cells in each group is summarized in the accompanying table. At least 3 pairs of Ews−/− mice and WT littermate control mice from different dams were analyzed. A representative plot is shown. (B) BM cells from Ews+/+ (WT) and Ews−/− (KO) were sequentially gated as shown to quantify CD150+CD48−Lin−Sca1+c-Kit+ cells. Numbers represent the percentages of CD150+CD48−Lin−Sca1+c-Kit+ cells in the gated populations. At least 3 pairs of Ews−/− mice and WT littermate control mice from different dams were analyzed. A representative plot is shown.
Analysis of hematopoietic stem and progenitor cell populations in Ews KO and WT mice. (A) Top panel: schematic diagram of gating strategy; freshly isolated BM cells from Ews−/− and WT littermate control (Ews+/+) mice were stained with the indicated antibodies and analyzed by flow cytometry. LT-HSC indicates long-term hematopoietic stem cell (defined as Lin−Sca1+ c-Kit+ and CD34−); and ST-HSC + MPP, short-term hematopoietic stem cell including multipotent progenitors (defined as Lin−Sca1+c-Kit+ and CD34+). CLP indicates common lymphoid progenitors; CMP, common myeloid progenitors; GMP, granulocyte-monocyte progenitors; and MEP, megakaryocyte-erythroid precursor. Bottom panel: the percentage of cells in each group is summarized in the accompanying table. At least 3 pairs of Ews−/− mice and WT littermate control mice from different dams were analyzed. A representative plot is shown. (B) BM cells from Ews+/+ (WT) and Ews−/− (KO) were sequentially gated as shown to quantify CD150+CD48−Lin−Sca1+c-Kit+ cells. Numbers represent the percentages of CD150+CD48−Lin−Sca1+c-Kit+ cells in the gated populations. At least 3 pairs of Ews−/− mice and WT littermate control mice from different dams were analyzed. A representative plot is shown.
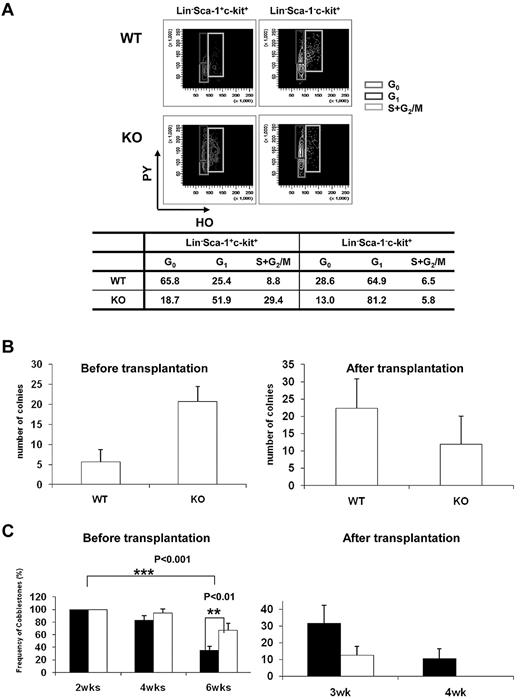
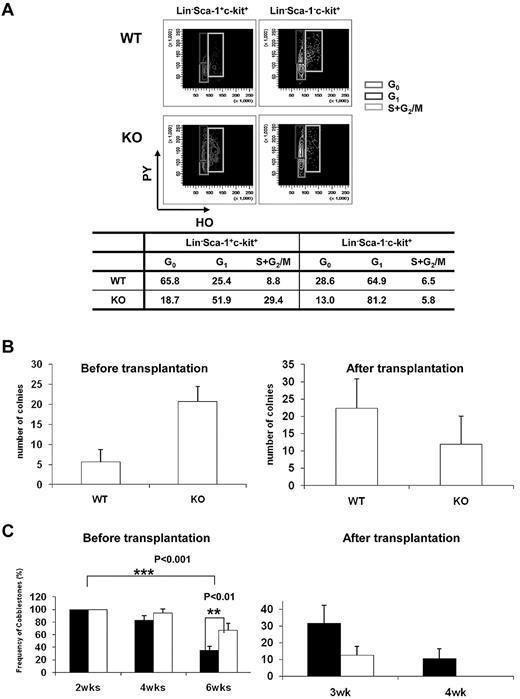
Quiescence of HSCs plays an indispensable role in the maintenance of the HSC pool throughout life, and disruption of HSC quiescence leads to premature depletion of stem cells.22 The decrease in the frequency of HSPCs in the BM of Ews−/− mice raised the possibility that Ews deletion compromises the quiescence of HSCs, leading to the reduction of stem/progenitor cell size. To test this hypothesis, we characterized the cell-cycle status of stem/progenitor cells. Cell-cycle analysis showed that a substantial number of Lin−, Sca-1+, and c-Kit+ cells (81%) in Ews−/− mice progressed through the G1, S, and G2/M phases, which was in marked contrast with the Ews+/+ mice (34% in G1, S, and G2/M; Figure 3A). The Lin−Sca-1−c-Kit+ subset of cells in Ews−/− mice also displayed a significant shift from G0 to the G1 phase, whereas cells in S and G2/M were similar compared with WT mice. This result indicates that deletion of Ews promotes stem cell exit from a quiescent state and entrance into the cell cycle, which is one of the common features found in HSCs from aged mice.23-25
Ews deletion drivescell-cycleprogression in hematopoieticstemandprogenitor cellpopulations and modulates progenitor cell activity. (A) Flow cytometric analysis of PY (Pyronin-Y) and HO (Hoechst 33342) staining of Lin−Sca1+c-Kit+ and Lin−Sca1−c-Kit+ cells from Ews KO and WT littermate controls. The percentage of cells in each phase of the cell cycle is summarized in the accompanying table. Data shown are representative of 2 independent experiments. (B) CFU-S assay. At day 12, spleens were removed and fixed in Bouin fixative and CFU-S colonies were counted. The CFU-S activity of Ews−/− (KO) and Ews+/+ littermate control (WT) BM cells was assessed before transplantation and after 2 rounds of transplantation (after transplantation). Of note, when Ews−/− BM cells were subjected to transplantation, their CFU-S activity was markedly decreased and showed a lower CFU-S activity compared with that of WT. Data are presented as mean values ± SD. (C) CAFC assay. The CAFC activity of Ews−/− (KO; white bar) and Ews+/+ littermate control (WT; black bar) BM cells was assessed before transplantation and after 2 rounds of transplantation (after transplantation). Of note, Ews−/− BM cells did not have measurable week-4 CAFC activity after BM transplantation, which is indicative of progenitor cell exhaustion. A total of 48 replicate wells were prepared per dilution and evaluated. Any well that had a colony of more than 6 cobblestone cells growing underneath the stromal cell layer was scored as positive. The y-axis denotes the percentage (%) of positive wells. Data are presented as mean ± SD. *Statistically significant difference (2-tailed Student t test, n > 4).
Ews deletion drivescell-cycleprogression in hematopoieticstemandprogenitor cellpopulations and modulates progenitor cell activity. (A) Flow cytometric analysis of PY (Pyronin-Y) and HO (Hoechst 33342) staining of Lin−Sca1+c-Kit+ and Lin−Sca1−c-Kit+ cells from Ews KO and WT littermate controls. The percentage of cells in each phase of the cell cycle is summarized in the accompanying table. Data shown are representative of 2 independent experiments. (B) CFU-S assay. At day 12, spleens were removed and fixed in Bouin fixative and CFU-S colonies were counted. The CFU-S activity of Ews−/− (KO) and Ews+/+ littermate control (WT) BM cells was assessed before transplantation and after 2 rounds of transplantation (after transplantation). Of note, when Ews−/− BM cells were subjected to transplantation, their CFU-S activity was markedly decreased and showed a lower CFU-S activity compared with that of WT. Data are presented as mean values ± SD. (C) CAFC assay. The CAFC activity of Ews−/− (KO; white bar) and Ews+/+ littermate control (WT; black bar) BM cells was assessed before transplantation and after 2 rounds of transplantation (after transplantation). Of note, Ews−/− BM cells did not have measurable week-4 CAFC activity after BM transplantation, which is indicative of progenitor cell exhaustion. A total of 48 replicate wells were prepared per dilution and evaluated. Any well that had a colony of more than 6 cobblestone cells growing underneath the stromal cell layer was scored as positive. The y-axis denotes the percentage (%) of positive wells. Data are presented as mean ± SD. *Statistically significant difference (2-tailed Student t test, n > 4).
Spleen colony-forming unit (CFU-S) activity at day 12 was higher in Ews−/− mice compared with Ews+/+ mice (Ews+/+ vs Ews−/−: 4.5 ± 1.4 vs 20.2 ± 10.9; Figure 3B left). Similar results were obtained when the CAFC assay was used to compare the Ews−/− to Ews+/+ mice (Figure 3C left). However, Ews−/−-derived BM cells displayed dramatically reduced CFU-S and CAFC activities compared with those from WT mice after 2 rounds of serial transplantation (Figure 3B right, 3C right).
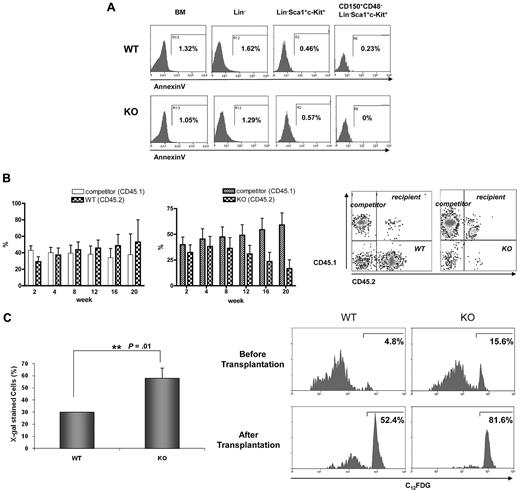
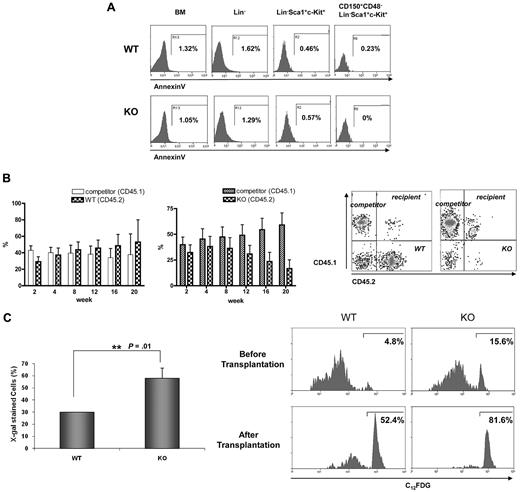
Despite the greater number of cells in the G1, S, and G2/M phases, Ews−/− mice displayed a severe BM atrophy and reduced frequency of HSPCs (Figure 1C and 2). Furthermore, surviving Ews−/− mice did not show any sign of leukemia for up to 1 year (H.L. and S.B.L., unpublished results). These observations led us to investigate whether the impairment of HSPCs in Ews−/− mice could be the result of increased apoptosis and/or premature cellular senescence. The number of AnnexinV+ cells was almost negligible in Lin−, Sca1+, c-Kit+, and CD150+, CD48−, Lin−, Sca1+, c-Kit+ cells (Figure 4A), indicating that inactivation of Ews had little or no effect on HSC/HPC apoptosis. In addition, we could not observe any discernable pattern of apoptosis in whole BM and Lin− cells of Ews−/− mice (Figure 4A).
Progressive loss of competitive repopulating activity is accompanied by an increase in SA-β-gal expression in hematopoietic stem progenitor cells. (A) BM cells derived from Ews−/− and WT littermates were stained as described in Methods for Lin−, LSK, and CD150+CD48− LSK populations and subsequently analyzed for apoptotic cell death. The percentages of Annexin V-positive cells are indicated. (B) Top panel: BM cells from Ews−/− mice (KO, CD45.2; right panel) and their Ews+/+ littermates (WT, CD45.2; left panel) were mixed with an equal number of competitor cells (CD45.1) and transplanted into lethally irradiated recipient (CD45.1.2) mice. Peripheral blood from the transplanted recipients was analyzed for CD45.1/CD45.2 expression by flow cytometry every 4 weeks after transplantation. Bottom panel: representative FACS profile showing donor (Ews−/−, CD45.2) and competitor (CD45.1) contributions at 20 weeks after transplantation in the peripheral blood of recipients. (C) Top panel: recipient mice were killed 20 weeks after transplant. Ews+/+- and Ews−/−-derived LSK cells were stained for SA-β-gal activity. At least 30 cells from 3 random fields were counted in each experiment and the percentage of SA-β-gal–positive cells is shown on the y-axis. *Statistically significant difference (2-tailed Student t test, n = 2, P = .01). Bottom panel: flow cytometric analysis of Ews−/− and WT littermate-derived LSK cells for the expression of SA-β-gal before and after transplantation. The cells were stained with a fluorescent β-galactosidase substrate (C12FDG) and analyzed by flow cytometry.
Progressive loss of competitive repopulating activity is accompanied by an increase in SA-β-gal expression in hematopoietic stem progenitor cells. (A) BM cells derived from Ews−/− and WT littermates were stained as described in Methods for Lin−, LSK, and CD150+CD48− LSK populations and subsequently analyzed for apoptotic cell death. The percentages of Annexin V-positive cells are indicated. (B) Top panel: BM cells from Ews−/− mice (KO, CD45.2; right panel) and their Ews+/+ littermates (WT, CD45.2; left panel) were mixed with an equal number of competitor cells (CD45.1) and transplanted into lethally irradiated recipient (CD45.1.2) mice. Peripheral blood from the transplanted recipients was analyzed for CD45.1/CD45.2 expression by flow cytometry every 4 weeks after transplantation. Bottom panel: representative FACS profile showing donor (Ews−/−, CD45.2) and competitor (CD45.1) contributions at 20 weeks after transplantation in the peripheral blood of recipients. (C) Top panel: recipient mice were killed 20 weeks after transplant. Ews+/+- and Ews−/−-derived LSK cells were stained for SA-β-gal activity. At least 30 cells from 3 random fields were counted in each experiment and the percentage of SA-β-gal–positive cells is shown on the y-axis. *Statistically significant difference (2-tailed Student t test, n = 2, P = .01). Bottom panel: flow cytometric analysis of Ews−/− and WT littermate-derived LSK cells for the expression of SA-β-gal before and after transplantation. The cells were stained with a fluorescent β-galactosidase substrate (C12FDG) and analyzed by flow cytometry.
We then questioned whether the reduced stem progenitor cell pool in Ews−/− mice is the result of cellular senescence. If this is the case, one would expect not only a quantitative change in HSPC numbers, but also a qualitative change in their ability to respond to functional demands under stressful conditions. For this purpose, we performed competitive repopulation experiments. BM cells from Ews−/− mice or their corresponding WT littermates (CD45.2) were mixed at a ratio of 1:1 with competitor BM cells (CD45.1), and injected into lethally irradiated CD45.1.2, F1 recipient mice. Ews−/− BM cells showed the capacity to compete with normal WT cells (CD45.1 competitor) to a level similar to that noted in Ews+/+ cells during a short-term period after transplantation (up to 6-8 weeks). Thereafter, however, Ews−/− cells progressively lost their ability to compete with competitor cells, as shown in Figure 4B (right panel). In contrast, BM cells from WT littermates (Ews+/+, CD45.2) effectively competed with competitor cells (CD45.1) for more than 20 weeks after transplantation (Figure 4B left panel), indicating that the decline in chimerism of the Ews−/− cells is not due to potential mismatch in histocompatibility alleles between test (CD45.2) and competitor (CD45.1) donor cells.
Because a progressive decline in the capacity for competitive repopulation is often associated with cellular senescence, we examined whether Ews−/− HSPCs displayed accelerated senescence compared with their WT counterparts. For this purpose, BM cells were harvested from the Ews+/+ and Ews−/− recipient mice 20 weeks after transplantation. Ews+/+ and Ews−/− (CD45.2) cells were separated from competitor cells (CD45.1) by cell sorting. LSK cells originating from Ews+/+ and Ews−/− mice were stained for SA-β-gal to detect the extent of senescence. The percentage of SA-β-gal positive LSK cells was found to be significantly higher in Ews−/− mice than in their WT counterparts (Figure 4C top panel), indicating that Ews−/− LSK cells underwent premature cellular senescence. This result was confirmed by flow cytometric analysis using a fluorescent β-gal substrate (C12FDG). The percentage of SA-β-gal-positive cells in Ews−/− LSKs was approximately 3-fold higher than that in WT LSKs (15.6% KO vs 4.8% WT; Figure 4C bottom panel). After 2 rounds of transplantation, substantial SA β-gal activity was also observed in WT LSK cells; however, Ews−/− LSK cells displayed more pronounced SA-β-gal activity and only 18%-19% of Ews−/− LSK cells remained negative for SA-β-gal compared with 48% of WT LSK cells. The higher SA-β-gal activity in the Ews−/− LSK cells is consistent with the results obtained with Ews−/− embryos (Figure 1B), and is potentially linked with the phenotypes observed in Ews−/− mice.
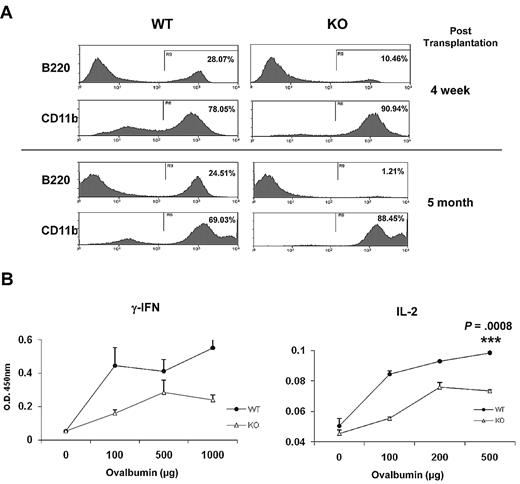
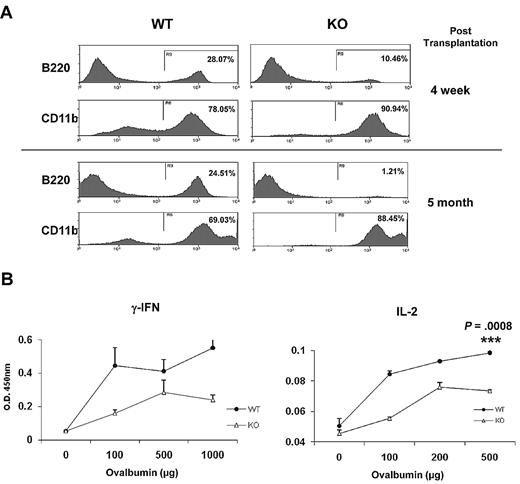
HSPCs from older mice favor commitment toward the myeloid lineage at the expense of lymphoid differentiation.26,27 To examine whether Ews modulates the lineage skewing of HSPCs, Ews+/+ and Ews−/− BM cells (CD45.2) were transplanted into lethally irradiated recipient mice (CD45.1.2), and peripheral blood leukocytes were analyzed for myeloid (CD11b) and lymphoid (B220) differentiation. At 4 weeks after transplantation, the frequency of B220-positive cells in Ews−/− recipients was significantly reduced compared with that of WT recipients (Ews+/+ vs Ews−/−: 28% vs 10%; Figure 5A top panel), whereas CD11b expressing cells were higher in Ews−/− recipients (Ews+/+ vs Ews−/−: 78% vs 91%; Figure 5A top panel). The lineage skewing became more prominent at 5 months after transplantation (B220+, Ews+/+ vs Ews−/−: 25% vs 1%; CD11b+, Ews+/+ vs Ews−/−: 69% vs 88%; Figure 5B bottom panel).
Immunosenescence phenotypes in Ews−/− mice. (A) Peripheral blood leukocytes from Ews+/+ and Ews−/− recipients were stained with anti-B220 and anti-CD11b antibodies at 4 weeks (top panel) and 5 months (bottom panel) after transplant. (B) One week after immunization with TNP-Ovalbumin, spleen cells were prepared from Ews+/+ and Ews−/− mice, and then challenged with different concentrations of ovalbumin as indicated. Concentrations of the indicated cytokines were determined by enzyme-linked immunosorbent assay. The means were derived from 3 independent experiments: 2-tailed Student t test, n = 3, ***P = .0008.
Immunosenescence phenotypes in Ews−/− mice. (A) Peripheral blood leukocytes from Ews+/+ and Ews−/− recipients were stained with anti-B220 and anti-CD11b antibodies at 4 weeks (top panel) and 5 months (bottom panel) after transplant. (B) One week after immunization with TNP-Ovalbumin, spleen cells were prepared from Ews+/+ and Ews−/− mice, and then challenged with different concentrations of ovalbumin as indicated. Concentrations of the indicated cytokines were determined by enzyme-linked immunosorbent assay. The means were derived from 3 independent experiments: 2-tailed Student t test, n = 3, ***P = .0008.
Cellular senescence is also associated with a progressive impairment of the immune system, so called immunosenescence, which is characterized by a defective Th1 response.28-30 In line with this, Ews−/− mice displayed a decrease in Th1 cytokine production (IFN-γ and IL-2; Figure 5B), but did not show a defect in Th2 cytokine (IL-4 and IL-10) production (data not shown).
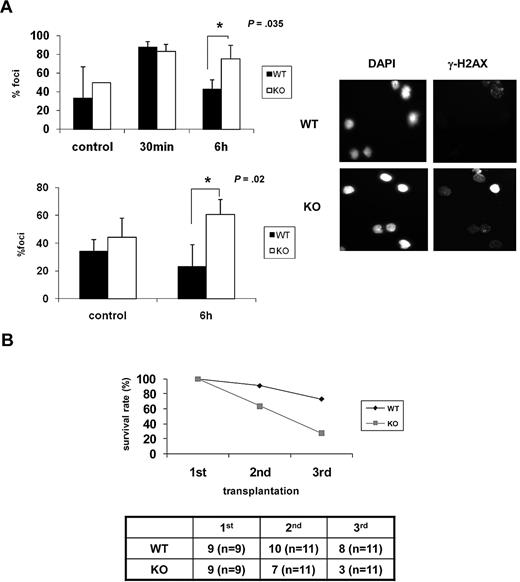
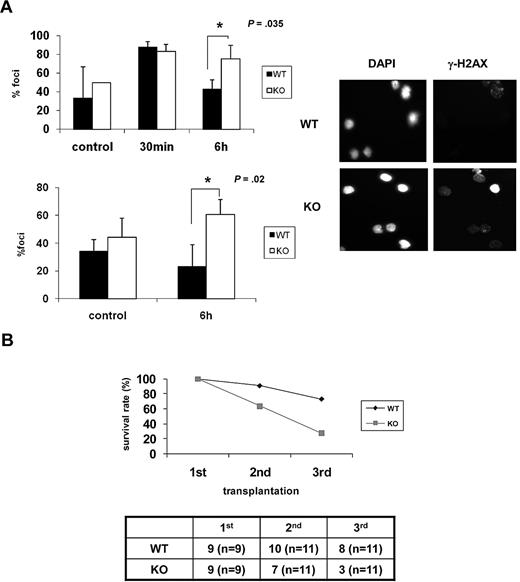
As the ability of HSCs to repair DNA damage appears to be inversely correlated with senescence,11,13 we examined whether DNA repair capability is lower in Ews−/− mice. BM cells and Lin− BM cells from Ews−/− and Ews+/+ mice were exposed to ionizing irradiation (IR; 2 Gy) and then allowed to recover for 6 hours. IR-induced γ-H2AX foci, which have been previously shown to localize at sites of DNA double-strand breaks (DSBs),31 were then counted. In contrast to Ews+/+ cells, in which γ-H2AX foci declined over time as would be expected from normal healthy cells, Ews−/− cells showed an accumulation of γ-H2AX foci over the same interval (Figure 6A), indicating that DNA repair capacity is impaired in Ews−/− HSPCs.
Ews−/− cells display impaired DNA repair capacity and show a diminished capacity to sustain survival of lethally irradiated animals in serial transplantation. (A) BM mononuclear cells (top panel) and Lin− cells (bottom panel) from Ews+/+ and Ews−/− mice were irradiated (2 Gy) in vitro. Cells were collected at the indicated times after IR and stained with anti–γ-H2AX antibodies. The nuclei of cells were visualized with DAPI staining (right panel). The cells containing distinct γ-H2AX foci were counted as positive and reported as a percentage of the total cells counted. The number of γ-H2AX–positive cells were counted from 3 different fields by 2 independent and blinded individuals and plotted with ± SD. An asterisk indicates a statistically significant difference. (2-tailed Student t test, n = 3, *P = .035 and *P = .02). A representative image of γ-H2AX immunofluorescence of Lin− cells is shown in the right panel. (B) BM cells (5 × 10⁶) from Ews+/+ and Ews−/− mice were transplanted into lethally irradiated recipient mice. Two months after transplantation, 5 × 10⁶ BM cells derived from these primary recipient mice were pooled and transplanted into secondary recipients, and the same procedure was repeated in tertiary transplantations. The accompanying table indicates the number of surviving recipient mice. Numbers in parentheses denote the numbers of recipient mice used for each group.
Ews−/− cells display impaired DNA repair capacity and show a diminished capacity to sustain survival of lethally irradiated animals in serial transplantation. (A) BM mononuclear cells (top panel) and Lin− cells (bottom panel) from Ews+/+ and Ews−/− mice were irradiated (2 Gy) in vitro. Cells were collected at the indicated times after IR and stained with anti–γ-H2AX antibodies. The nuclei of cells were visualized with DAPI staining (right panel). The cells containing distinct γ-H2AX foci were counted as positive and reported as a percentage of the total cells counted. The number of γ-H2AX–positive cells were counted from 3 different fields by 2 independent and blinded individuals and plotted with ± SD. An asterisk indicates a statistically significant difference. (2-tailed Student t test, n = 3, *P = .035 and *P = .02). A representative image of γ-H2AX immunofluorescence of Lin− cells is shown in the right panel. (B) BM cells (5 × 10⁶) from Ews+/+ and Ews−/− mice were transplanted into lethally irradiated recipient mice. Two months after transplantation, 5 × 10⁶ BM cells derived from these primary recipient mice were pooled and transplanted into secondary recipients, and the same procedure was repeated in tertiary transplantations. The accompanying table indicates the number of surviving recipient mice. Numbers in parentheses denote the numbers of recipient mice used for each group.
The HSC senescence phenotype becomes more apparent when mice are exposed to hematologic stress. Greater demands on stem cell proliferation and differentiation can be experimentally induced by serial transplantation.32 To examine whether Ews deficiency contributes to the functional decline of HSPCs in stressful conditions, BM cells from Ews+/+ and Ews−/− mice were serially transplanted into lethally irradiated recipients. The survival of Ews+/+ recipients remained stable during the first 2 generations, whereas the survival of Ews−/− recipients decreased progressively from the second generation onward (Figure 6B). Ews+/+ recipient animals also began to die after the tertiary transplantation (73% survival). However, survival of Ews−/− recipients was significantly reduced (27% survival) in the tertiary transplantation, indicating the more rapid exhaustion of the replicative potential of Ews−/− HSPCs.
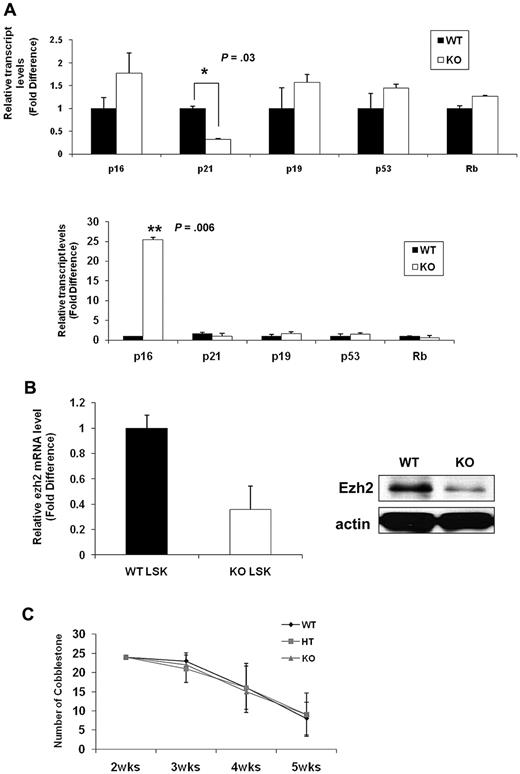
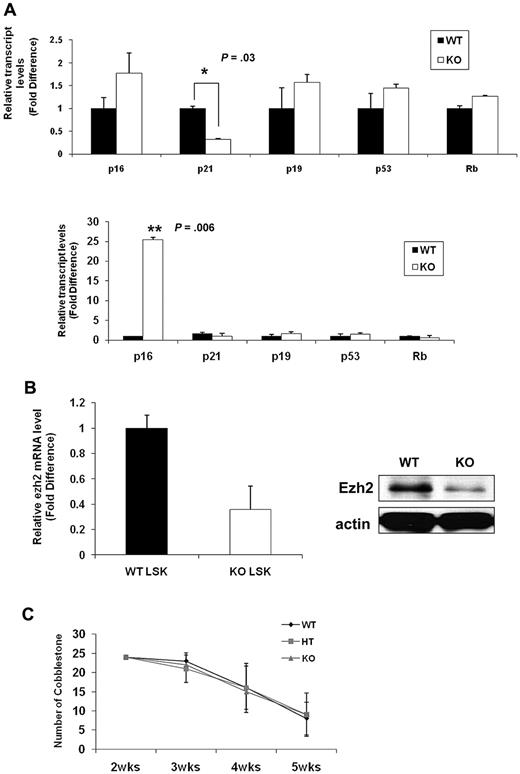
To gain further insight into the molecular mechanisms underlying the senescence-associated phenotypes of Ews−/− HSPCs, we assessed expression levels for molecules implicated in cellular senescence. Consistent with prior studies, p16INK4a was not detectable in WT LSK cells (data not shown).33 This is because of the low abundance of p16INK4a in normal stem cells and the rarity of LSK cells. Lin− BM cells allowed us to obtain a higher amount of initial input mRNA and enabled us to detect p16INK4a within the linear range of amplification. The expression of p19Arf (1.6-fold), p53 (1.4-fold), and Rb (1.3-fold) was slightly higher in Ews−/− Lin− cells compared with WT Lin− cells(Figure 7A top panel). Although the fold change is modest, among the genes assessed, p16INK4a was the most up-regulated gene (1.8-fold) in Ews−/− Lin− cells compared with WT. Significantly, at least a 3-fold down-regulation of p21Cip1/WAF1 was observed in Lin− cells from Ews−/− mice (Figure 7A top panel). Previous reports indicate that p21Cip1/WAF1 regulates the quiescence of the HSC,34 and this could potentially explain the loss of HSC quiescence in Ews−/− mice (Figure 3A). p16INK4a expression became detectable even in WT LSK cells when WT cells were transplanted into lethally irradiated recipient mice. Whereas there were no noticeable changes in p19Arf, p53, and Rb expression after transplantation, a marked increase in p16INK4a level (approximately 25-fold) was observed in the Ews−/− LSK cells (Figure 7A bottom panel), providing a possible mechanistic explanation for the higher susceptibility of Ews−/− HSPC in the induction cellular senescence. Ezh2 (the enhancer of Zeste-2), one of the polycomb group (PcG) proteins, significantly extends the replicative capacity of HSCs during serial transplantation, thus qualifying Ezh2 as a key regulator of stem cell renewal.32 It is noteworthy that Ezh2 is closely associated with the pathogenesis of Ewing sarcoma35,36 and is also involved in the regulation of p16INK4a. Therefore, we examined the possibility whether the changes in p16INK4a in Ews−/− LSKs is mechanistically linked to Ezh2. Ews−/− LSK cells showed an approximately 3-fold reduction in Ezh2 mRNA expression compared with that of WT littermate LSK cells (Figure 7B left). In addition, the level of Ezh2 protein was similarly down-regulated in Ews−/− fetal liver cells (E14.5) (Figure 7B right), suggesting a possible interplay between Ews, p16, and Ezh2 in the context of cellular senescence.
Comparative analysis of senescence-associated genes and a limited role of Ews in stromal cells' capacity to support hematopoiesis. (A) Top panel: total RNA was prepared from freshly isolated Ews+/+ and Ews−/− Lin− BM cells and then subjected to quantitative PCR analysis. Bottom panel: 5 × 10⁵ BM cells from Ews−/− mice and WT littermates were transplanted into irradiated recipients. Two months after transplantation, LSK cells derived from WT or KO donors in the recipients were sorted and subjected to quantitative PCR analysis. The expression level in WT cells was arbitrarily set to 1. The fold change in expression of each gene was calculated using the ΔΔCt method. An asterisk indicates a statistically significant difference (2-tailed Student t test; *P = .03; **P = .006). (B) Left panel: LSK cells were sorted from Ews−/− and WT littermates and then subjected to quantitative PCR analysis. The expression level in WT cells was arbitrarily set to 1. Right panel: immunoblot analysis of endogenous Ezh2 protein expression in E14.5 fetal liver cell extracts from Ews−/− and WT littermates. (C) Primary BM stromal cells were prepared from Ews+/+ (WT), Ews+/− (HT) and Ews−/− (KO) littermates. Normal BM cells were seeded onto the stroma cells. The CAFC assay was performed as described in “CFC and CAFC assays.”
Comparative analysis of senescence-associated genes and a limited role of Ews in stromal cells' capacity to support hematopoiesis. (A) Top panel: total RNA was prepared from freshly isolated Ews+/+ and Ews−/− Lin− BM cells and then subjected to quantitative PCR analysis. Bottom panel: 5 × 10⁵ BM cells from Ews−/− mice and WT littermates were transplanted into irradiated recipients. Two months after transplantation, LSK cells derived from WT or KO donors in the recipients were sorted and subjected to quantitative PCR analysis. The expression level in WT cells was arbitrarily set to 1. The fold change in expression of each gene was calculated using the ΔΔCt method. An asterisk indicates a statistically significant difference (2-tailed Student t test; *P = .03; **P = .006). (B) Left panel: LSK cells were sorted from Ews−/− and WT littermates and then subjected to quantitative PCR analysis. The expression level in WT cells was arbitrarily set to 1. Right panel: immunoblot analysis of endogenous Ezh2 protein expression in E14.5 fetal liver cell extracts from Ews−/− and WT littermates. (C) Primary BM stromal cells were prepared from Ews+/+ (WT), Ews+/− (HT) and Ews−/− (KO) littermates. Normal BM cells were seeded onto the stroma cells. The CAFC assay was performed as described in “CFC and CAFC assays.”
Given the fact that extrinsic regulators (eg, the stem cell niche) have been shown to impact stem and progenitor cell compartments,37 we investigated whether extrinsic factors contributed to the stem/progenitor changes in Ews−/− mice. Due to the short life span and hypersensitivity to ionizing radiation of Ews−/− mice,14 a reciprocal transplantation experiment, in which BM cells from WT mice are transplanted into lethally irradiated KO mice (WT→KO) was not feasible. Instead, we established a CAFC assay using BM stromal cells from Ews+/+, Ews+/−, and Ews−/− mice and assessed their ability to support the formation of CAFC. Ews−/− (KO) and Ews+/− heterozygous (HT)–derived BM stromal cells were equally sufficient as WT cells in providing necessary signals to support CAFC activity (Figure 7C), suggesting that there were no apparent defects in Ews−/− stromal cells in terms of cell adhesion. However, because the CAFC assay does not reflect all aspects of in vivo microenvironment,38 the impaired hematopoietic activity in Ews−/− mice may not necessarily be due solely to an intrinsic alteration of stem cells.
Discussion
It is well known that genes involved in translocations play a critical role in a wide range of biologic processes.39 Although EWS is a frequent target of chromosomal translocations and its translocation can be found in most Ewing sarcoma patients, the role of EWS remains largely unknown.
Most work to date has focused primarily on elucidating the oncogenic potential of EWS-FLI1. Paradoxically, ectopic expression of EWS-FLI1 induces cell-cycle arrest and apoptosis in most primary cells and cell lines.40 These effects were attenuated in p16INK4a-null mouse embryonic fibroblasts (MEFs).5 However, p16INK4a-deficient MEFs expressing EWS-FLI1 failed to form tumors in NOD/SCID mice, indicating the requirement for additional factors for full transformation.5
There is a growing consensus that Ewing sarcoma originates from primitive cells.1 This is because Ewing tumor does not express specific lineage markers and has a capacity to differentiate into neural cell and occurs in both osseous and nonosseous (soft) tissues.41 Ewing tumor of the bones and extraosseous Ewing sarcoma (EOE) are indistinguishable from one another with regard to molecular and morphologic criteria,42 supporting the notion that these cells are derived from the same precursor. Mesenchymal stem cells provide a permissive cellular environment for Ews-Fli-1–mediated transformation in NOD/SCID mice, which is reminiscent of human Ewing sarcoma.6,7 Hematopoietic progenitor cells are also permissive for the expression of EWS/ERG, resulting in leukemia.8 These findings further support the prevailing hypothesis that Ewing sarcoma occurs at the level of stem/progenitor cells.
Keeping in mind the facts that Ewing sarcoma arises from a stem progenitor cell, that Ews KO mice displayed aging-like phenotypes, and that both tumorigenesis and senescence are intimately tied to stem cells,43 we sought to address the physiologic roles of Ews in the stem progenitor cell population.
Our study showed that the loss of Ews results in dramatic changes in the dynamics of HSPCs. Ews−/− mice exhibited a progressive and severe postnatal atrophy of hematopoietic organs. There were also pronounced reductions in the number of long- and short-term stem progenitor cells compared with WT mice. The number of common lymphoid progenitor cells was also decreased. However, myeloid progenitors (CMP, GMP, and megakaryocyte-erythroid precursors [MEPs]) were not affected by loss of Ews. Similarly, the analysis of peripheral blood revealed that Ews-null mice showed a decrease in the proportion of lymphoid cells but an increase in the proportion of myeloid cells. These results suggest that the drop in the lymphoid population in Ews−/− mice is not simply due to the reduced stem/progenitor cells, but result from the skewing of stem progenitor cells toward the myeloid lineage. Mice with deficiency in DNA repair genes display a similar pattern of lineage skewing as that described for Ews−/− mice.11,13 It has been previously speculated that Ews may play a role in DNA repair and/or DNA recombination,14 which is consistent with our data (Figure 6A). A DNA repair defect in Ews−/− mice could also potentially contribute to lineage skewing; however, Ews−/− mice display relatively normal T-cell development,14 and thus this speculation requires further validation.
Despite the reduction in the frequency of stem/progenitor cells in Ews−/− BM, higher CFU-S and CAFC activities were observed in Ews−/− mice compared with WT mice (Figure 3B left, 3C left). However, these activities dropped precipitously when Ews−/− cells were subjected to serial transplantation (Figure 3B right, 3C right). As shown in Figure 4C (bottom panel), nonsenescent LSK cells remain (85%) in Ews−/− mice and these HSPCs could produce higher CFU-S and CAFC due to their active cell-cycle progression (Figure 3A). However, Ews−/− HSPCs were more prone to senescence upon stress, so their stem/progenitor activities exhausted more rapidly than their WT counterparts after transplantation, resulting in lower CFU-S and CAFC. This is consistent with our hypothesis that Ews−/− HSPCs are more susceptible to senescence upon stress.
Ews−/− BM recipients showed a higher mortality in serial transplantation experiments compared with WT BM-transplanted recipients. In competitive repopulation assays, Ews−/− BM cells showed a capacity to compete with competitor cells to an almost similar extent as WT BM cells during the early posttransplantation period, suggesting that there are no obvious defects in the ability of homing and engraftment of Ews−/− HSPCs. However, Ews−/− BM cells gradually lost their ability to compete in the long-term posttransplantation period, and this was accompanied by a higher frequency of SA-β-gal positive cells in Ews−/− derived HSPCs. This observation indicates that Ews−/− HSPCs are more susceptible to senescence than their WT counterparts under the same conditions.
The question of whether the phenotypes observed in Ews−/− HSPCs are due to replicative senescence or premature senescence (independent of telomere length), or a combination of both, is not clear in this study, because the phenotypic characteristics and the molecular signals of premature senescence and replicative senescence appear to be very similar and redundant.44 It was previously reported that telomere length is substantially shortened after each round of transplantation in the setting of serial transplantation.45 Therefore, the active cell-cycle progression of Ews−/− HSC could trigger replicative senescence leading to an early exhaustion of HSCs, which is a potential contributing factor in the eventual hematopoietic failure of the Ews−/− recipient mice. However, Ews−/− mice showed no detectable telomere shortening compared with littermate controls (see supplemental Figure 2, available on the Blood Web site; see the Supplemental Materials link at the top of the online article). In addition, the length of mouse telomeres is much longer than that of humans,46 suggesting the hematopoietic failure of Ews−/− mice is most likely independent of telomere dysfunction or shortening. Alternatively, Ews−/− HSPCs may have a lower threshold for damage checkpoint activation, resulting in growth arrest.
Myeloid skewing, impaired DNA repair capacity and accelerated senescence of Ews−/− HSCs were transplantable, suggesting that cell-autonomous factors contributed to the senescence-associated phenotypes of Ews−/− mice. However, we cannot exclude the contribution of nonautonomous factors because Ews−/− BM-transplanted recipients showed less severe BM atrophy compared with the Ews−/− mouse itself (data not shown).
Deletion of Ews promoted cellular senescence, and this was accompanied by a modest but consistent increase of p16INK4a. However, the fold difference in p16INK4a between WT and KO became increasingly more significant in LSK cells after transplantation (25-fold). In contrast, the fold difference in p21Cip1/WAF1 expression was diminished (from 3.3-fold to 1.6-fold), and p19Arf, p53, and Rb did not show any notable changes after transplantation. This result suggests that Ews promotes cellular senescence in HSCs mainly through p16INK4a. It was reported that loss of p16INK4a diminished the EWS-FLI1-induced apoptosis in MEFs.5 In addition, 30% of Ewing sarcoma patients were found to have deletion in both alleles of p16INK4a, suggesting that p16INK4a is functionally implicated in tumorigenesis of Ewing sarcoma.47 Therefore, our observation of changes in p16INK4a in Ews−/− HSCPs suggest that the loss of the normal EWS allele in Ewing sarcoma patients may potentially contribute to the tumorigenesis of Ewing sarcoma by regulating p16INK4a expression in stem cell population. In addition, the fact that Ezh2 levels were reduced in Ews−/− HSPCs (Figure 7B) raises the intriguing possibility that p16INK4a induction in Ews−/− HSPCs may be mediated by the down-regulation of Ezh2, although further investigation is necessary to gain insights into functional interplay between these molecules.
Bmi-1 KO mice show a very similar pattern of change in hematopoietic profiles and display significantly impaired HSC function.20 However, whereas Ews deficiency induces exclusively p16INK4a expression, Bmi-1 inactivation induces both p16INK4a and p19Arf in HSC population, suggesting that Ews exerts its effects through somewhat different mechanisms. Future studies using Ews−/−p16−/− (Ink4a-specific) double KO mice will need to be undertaken to determine whether the senescence in Ews-null HSPCs is mediated specifically by p16INK4a.
Of note, the phenotypic changes in Ews−/− mice were similar to those seen in mice lacking Klotho, Foxo, and Bmi-1, which display aging-like phenotypes. However, sick animals may coincidentally show symptoms that resemble aging phenotypes,48 and senescent cells can directly or indirectly disrupt tissue functions affecting an organism's life span. Therefore, although no obvious differences between Ews−/− and their WT littermates were observed in histologic analyses (supplemental Figures 1), some of the phenotypes observed in Ews−/− mice (eg, kyphosis, decreased subcutaneous fat, underweight) could be due to disruption of necessary physiologic functions rather than premature aging.
Because stem cells are the direct target for transformation in Ewing tumor, it is particularly legitimate to investigate the functional role of EWS in the context of stem cells. Our data demonstrate that Ews deletion results in a severe perturbation at the level of stem progenitor cells by regulating cell-cycle quiescence and senescence, and these findings lead to speculate that loss of function of the normal EWS allele in Ewing sarcoma patients could contribute in tumorigenesis on its own, regardless of the partner genes involved in translocation.
Anti-aging mechanisms often contribute to an increased chance of tumor incidence, underscoring the intimate link between aging and cancer. Therefore, we anticipate that understanding the functional role of EWS at the stem cell level, and its influence on both senescence and tumorigenesis, will likely provide us with important clues to elucidate the link between cancer, aging, and stem cells.
The online version of this article contains a data supplement.
The publication costs of this article were defrayed in part by page charge payment. Therefore, and solely to indicate this fact, this article is hereby marked “advertisement” in accordance with 18 USC section 1734.
Acknowledgments
The authors are grateful to Dr Kar Siddhartha for critical reading of this manuscript.
This work was supported in part by the Department of Defense (W81XWH-09-1-0364) and the University of Pittsburgh Cancer Institute to B.L.; and by the National Institutes of Health (R01HL070561), the National Basic Research Program of China (2011CB964801), and the Tianjin International Co-operation Science Foundation (09ZCZDSF03800) to T.C. B.L. is a recipient of the Hillman Foundation Research Scholar Grant. T.C. is a recipient of the Scholar Award from the Leukemia & Lymphoma Society (1027-08) and the Outstanding Young Scholar Award from the National Natural Science Foundation of China (NSFC; no. 30825017).
National Institutes of Health
Authorship
Contribution: J.C. performed and designed research and analyzed data; H.S. performed research and analyzed data; H.Y. performed research; H.L. contributed vital new reagents; T.C. contributed analytical tools and analyzed data; S.B.L. contributed vital new reagents and analyzed data; and B.C.L. designed research, analyzed data, and wrote the paper.
Conflict-of-interest disclosure: The authors declare no competing financial interests.
Correspondence: Byeong Chel Lee, University of Pittsburgh Cancer Institute, Hillman Cancer Center, 5117 Centre Ave, Pittsburgh, PA 15213; e-mail: leeb4@upmc.edu.

