Abstract
After intrathymic development, T cells exit the thymus and join the peripheral T-cell pool. Such recent thymic emigrants (RTEs) undergo both phenotypic and functional maturation during the first 3 weeks they reside in the periphery. Using a well-controlled in vitro polarization scheme, we now show that CD4+ RTEs are defective in T-helper (Th) type 0 (Th0), Th1, Th17, and regulatory T-cell lineage commitment, with dampened cytokine production and transcription factor expression. In contrast, CD4+ RTES are biased toward the Th2 lineage both in vitro and in vivo, with more robust interleukin-4, interleukin-5, and interleukin-13 production than their mature naive counterparts. Coculture experiments demonstrate that mature naive T cells influence neighboring RTEs in their Th responses. In adoptive hosts, CD4+ RTEs drive production of the Th2-associated antibody isotype immunoglobulin G1 and mediate airway inflammatory disease. This bias in RTEs likely results from dampened negative regulation of the Th2 lineage by diminished levels of T-bet, a key Th1 transcription factor. CD4+ RTEs thus represent a transitional population with a distinct interpretation of, and response to, immunologic cues. These characteristics may be beneficial during the postthymic maturation period by leading to the avoidance of inappropriate immune responses, particularly in lymphopenic neonates and adults.
Introduction
The peripheral T-cell pool in healthy individuals is maintained by both thymic output and peripheral homeostasis. Those T cells that have recently completed thymic development and egress are termed recent thymic emigrants (RTEs). RTEs constitute the entire T-cell pool in neonates, seeding the lymphopenic peripheral compartment to establish the nascent immune system.1-3 In adults recovering from lymphopenia, such as after bone marrow transplantation or a lymphodepleting viral infection, RTEs play an essential role in reconstituting the naive T-cell pool. Despite age-associated thymic involution, the reduced export of RTEs adds new T-cell receptor (TCR) specificities to the peripheral T-cell pool, although their contribution declines with age.2,4
Thymic T-cell development progresses through a series of tightly controlled events, ensuring that emigrating T cells possess functional TCRs and are self-tolerant.5 However, T-cell maturation is not completed in the thymus, but continues after thymic egress. Studies in both rodents and humans have shown that the completion of T-cell maturation requires both exit from the thymus and access to secondary lymphoid organs and is marked by changes in cell-surface phenotype and function.3,6-11
Given that analyses of the more tractable mouse models are highly likely to be predictive of human biology, the study of RTEs has been facilitated by the use of mice transgenic (Tg) for green fluorescent protein (GFP) driven by the Rag2 promoter. In such RAG2p-GFP Tg mice, GFP and Rag2 expression are coincident in the late double-negative stage in the thymus.7,12 Although Rag2 expression is extinguished by the single-positive stage, the GFP signal remains detectable in RTEs, and signal strength correlates inversely with the time since loss of Rag2 expression.7,13 Thus, GFP is a reliable marker for RTEs in unmanipulated mice, which allows the isolation of untouched RTEs for functional and phenotypic analysis.
Upon antigen stimulation, naive CD4+ T cells differentiate into effector cells with specialized cytokine secretion to perform critical immunologic functions and provide flexibility to the immune response.14,15 Naive CD4+ T-helper (Th) precursors are molded by environmental cues that provide an inflammatory context for the cell. Depending on the nature and strength of the stimulus, as well as the cytokine milieu, Th precursors can differentiate to induced regulatory T cells (iTregs) that mediate protection against immunopathology or to Th1, Th2, or Th17 effectors that provide protection against a wide range of pathogens and immunologic insults.
The process of Th differentiation has been studied with highly tractable in vitro systems that enable exquisite control over the cytokine and stimulus environment and provide a sensitive readout of the resulting cellular response. These in vitro systems have allowed for the dissection of Th differentiation, which proceeds through 3 phases: initiation, commitment, and stabilization. The initiation phase involves cytokine receptor signaling through signal transducer and activator of transcription (STAT) proteins and leads to the up-regulation of proteins that influence differentiation.15 The commitment phase depends on the “master regulator” transcription factor for that lineage (ie, T-bet for Th1, GATA-3 for Th2, RORγt for Th17, and forkhead box P3 [Foxp3] for iTreg). Finally, the stabilization phase involves long-term changes to the cell, including epigenetic modifications and chromatin remodeling, which allows for the maintenance of gene expression patterns.
Knowing that neonatal T cells demonstrate Th2-like traits,16 we explored in more detail the extent and origin of this bias in adult RTEs using artificial but well-controlled in vitro and more natural in vivo systems. We show here, for the first time, that CD4+ RTEs, compared with their mature naive (MN) counterparts, exhibit a distinct response to the immunologic signals that drive Th differentiation and lineage commitment. Despite defects in Th0, Th1, Th17, and iTreg lineage commitment, CD4+ RTEs exhibit enhanced Th2 effector function in a Th2-polarizing environment. Differential regulation of the Th1 transcription factor T-bet likely regulates this process, leading to an inherent bias against the Th1 and toward the Th2 lineage.
Methods
Mice
RAG2p-GFP Tg mice12 were backcrossed in our laboratory at least 10 generations onto the C57BL/6 (B6) background. B6 CD45.2+, B6 CD45.1+ (B6.SJL-PtprcaPepcb/BoyJ), TCRβ/δ−/− (B6.129P2-Tcrbtm1Mom Tcrdtm1Mom/J), and OT-II [C57BL/6-Tg(TcraTcrb)425 Cbn/J] TCR Tg mice were purchased from The Jackson Laboratory or bred in-house. OT-II mice carry a transgene-encoded TCR that recognizes the I-Ab–restricted ovalbumin (OVA)323-339 peptide. All mice were bred and housed under specific pathogen–free conditions and used at 5-12 weeks of age and in compliance with the University of Washington's Institutional Animal Care and Use Committee.
Flow cytometry antibodies
Cells were stained with antibodies to the following surface and intracellular molecules: CD11b (M1/70), NK1.1 (PK136), B220 (RA3-6B2), CD8α (53-6.7), Ter119 (Ly-76), CD25 (PC61), CD62L (MEL-14), CD4 (RM4-5), CD45.1 (A20), CD44 (IM7), Vβ5 (MR9-4), Vα2 (B20.1), interleukin-4 receptor-α (IL-4Rα; mIL4R-M1), IL-17A (eBio17B7), GATA-3 (L50-823), interferon-γ (IFN-γ; XMG1.2), IL-4 (11B11), IL-2 (JES6-5H4), Foxp3 (FJK-16s), STAT5a pY694 (47), STAT6 pY641 (J71-773.58.11), immunoglobulin G1-κ (IgG1-κ) isotype control (MOPC-21), and T-bet (eBio4B10), all from eBioscience or BD Biosciences.
Cell preparation, staining, and sorting
Single-cell suspensions of lymph nodes (LNs; including brachial, axillary, inguinal, cervical, and mesenteric LNs) and water-lysed splenocytes were prepared and sorted as CD62L+CD4+ GFP+ RTEs or GFP− MN T cells, as described previously.9 In brief, T cells from RAG2p-GFP Tg mice were enriched by negative selection with an EasySep kit (StemCell Technologies) and sorted as NK1.1− (to eliminate natural killer cells/natural killer T cells), CD11b−, B220−, and CD8− on a FACSAria (BD Biosciences) to > 98% purity. For the Foxp3 induction experiments, CD4+CD25+ cells were also eliminated. Before depletion, ∼ 1.5% of CD4+ RTEs and ∼ 3.5% of MN T cells were Foxp3+. Cells sorted as CD62L+ were found by analysis to be CD44lo. Results from experiments with cells sorted as CD62L+CD44lo were indistinguishable from those obtained by sorting solely on CD62L. Where indicated, cells were incubated with 5μM carboxyfluorescein succinimidyl ester (CFSE) for 10 minutes at 37°C.
In vitro Th CD4+ T-cell differentiation
Purified CD4+ GFP+ RTEs and GFP− MN T cells were cultured for 3-5 days in the presence of irradiated antigen-presenting cells (natural killer cell– and T cell-depleted splenocytes) in complete RPMI 1640 medium containing 10% fetal bovine serum, 10mM HEPES (N-2-hydroxyethylpiperazine-N′-2-ethanesulfonic acid), 4mM l-glutamine, and 50μM 2-mercaptoethanol at 37°C. Analysis time points were chosen for maximal display of proliferation and cytokine production, as well as optimal cell survival. Cells were cultured with 30-500 ng/mL anti-CD3 (145-2C11; BD Biosciences) and 1 μg/mL anti-CD28 (37.51; eBioscience) for Th0 differentiation and were supplemented with 5 ng/mL recombinant IL-12p70 (rIL-12p70) and 10 μg/mL anti-IL-4 for Th1; 50 ng/mL rIL-4, 50 μg/mL anti-IFN-γ, and 50 μg/mL anti-IL-12/IL-23 for Th2; 10 ng/mL rIL-23, 5 ng/mL recombinant transforming growth factor-β1 (rTGF-β1), 20 ng/mL rIL-6, 10 μg/mL anti-IFN-γ, and 10 μg/mL anti-IL-4 for Th17; and 2 ng/mL rTGF-β1 for iTreg (all from eBioscience). For coculture experiments, purified CD45.2+ GFP+ RTEs and CD45.1+ GFP− MN T cells were mixed at various ratios and cultured with CD45.1+CD45.2+ antigen-presenting cells as described above.
Cell transfer and Th2 immunization
Purified CD45.1+ OT-II TCR Tg CD4+ GFP+ RTEs and GFP− MN T cells (1.5 × 10⁶ each) were injected intravenously into separate CD45.2+ B6 mice. Mice were immunized the next day with 100 μg OVA (Sigma-Aldrich) and 100 μg of papain (Calbiochem) in phosphate-buffered saline (PBS) subcutaneously at the base of the tail.
Intracellular cytokine and transcription factor staining
In vitro naive or Th-differentiated CD4+ GFP+ RTEs and GFP− MN T cells were harvested on day 3 or 5. For the in vivo Th2 experiments, cell suspensions from draining inguinal LNs were prepared on day 4 after immunization. For intracellular cytokine staining, in vitro differentiated cells were restimulated for 5 hours with 50 ng/mL phorbol 12-myristate 13-acetate (PMA; Sigma-Aldrich) and 0.7 μM ionomycin (Sigma-Aldrich), and in vivo differentiated cells were restimulated with or without 20 μg/mL OVA323-339 peptide in the presence of brefeldin A (BD GolgiPlug; BD Biosciences) or monensin (BD GolgiStop; BD Biosciences). Intracellular cytokine staining was performed with BD Cytofix/Cytoperm buffers according to the manufacturer's protocol. Intracellular staining for Foxp3 and GATA-3 was performed on cells that had not been restimulated and used the Foxp3 Staining Buffer Set (eBioscience) according to the manufacturer's protocol. Samples were run on a FACSCanto flow cytometer (BD Biosciences) and analyzed with FlowJo Version 9.1 software (TreeStar).
NP-KLH immunization and NP-specific enzyme-linked immunosorbent assay
Purified CD45.1+CD4+ GFP+ RTEs and GFP− MN T cells (2.5 × 10⁶ each) were injected intravenously into separate CD45.2+ TCRβ/δ−/− B6 mice. One day later, mice were immunized intraperitoneally with 100 μg of NP(23)-KLH (4-hydroxy-3-nitrophenylacetyl hapten [NP] conjugated to keyhole limpet hemocyanin [KLH]; Biosearch Technologies) emulsified in complete Freund adjuvant (Sigma-Aldrich). Anti-NP antibodies were detected with plates incubated overnight with NP(23)-BSA (NP conjugated to bovine serum albumin; Biosearch Technologies) and blocked with PBS/1% bovine serum albumin overnight. Sera samples from days 14 and 21 were plated in 2-fold serial dilutions ranging from 1:500 to 1:128 000. Anti-NP antibodies were detected with goat anti-mouse IgG1 or IgG2a conjugated to horseradish peroxidase (Southern Biotech). Data were plotted as absorbance versus dilution, and values within the linear portion of the curve were used to calculate the IgG1/IgG2a ratio.
Induction of allergic airway inflammation
Purified CD45.1+ OT-II TCR Tg CD4+ GFP+ RTEs and GFP− MN T cells (2.5 × 10⁶ each) were injected intravenously into separate CD45.2+ B6 mice. One day later, anesthetized animals were treated intranasally with a combination of 500 ng of thymic stromal lymphopoietin (TSLP; gift of A. Farr, University of Washington, Seattle, WA) and 25 μg of OVA (Sigma-Aldrich) in a total volume of 25 μL of PBS. This treatment was repeated every other day for 14 days, for a total of 7 administrations. Control animals received cells and intranasal PBS on the same schedule. Analysis was performed on day 15.
Bronchoalveolar lavage preparation
Mice were killed by lethal injection with tribromoethanol administered intraperitoneally, and the lungs were subjected to bronchoalveolar lavage (BAL). BAL fluid (4 mL) was collected, 1 mL at a time, through a catheter inserted in the trachea. The BAL fluid was centrifuged, and the cell pellet was resuspended in PBS/1% fetal bovine serum. BAL fluid cells were counted on a hemocytometer, and differential cell counts were performed on cytospin cell preparations stained with a modified Wright-Giemsa stain (Hema 3, Fisher Scientific).
Quantification of IL-4, IL-5, and IL-13 secretion
Per well, 50 000 in vitro Th0- or Th2-differentiated CD4+ RTEs or MN T cells or 80 000 fluorescence-activated cell sorter–purified OT-II in vivo Th2-differentiated cells were cultured in triplicate with plate-bound anti-CD3 and anti-CD28 in complete RPMI 1640 medium at 37°C. Cell-free supernatants were harvested at 72 hours, and IL-4, IL-5, and IL-13 were measured with enzyme-linked immunosorbent assay kits (ELISA; R&D Systems or eBioscience) according to the manufacturer's protocols.
Quantitative reverse-transcription polymerase chain reaction
Purified CD4+ GFP+ RTEs and GFP− MN T cells were used directly ex vivo or differentiated under Th0 conditions for 2 days, under Th1 conditions for 4 days, or under Th2 conditions for 5 days and sorted to obtain a > 98% pure CD4+ population. Total mRNA was extracted with the RNeasy mini kit (Qiagen), and first-strand cDNA synthesis was performed with oligo(dT) primers, using SuperScript III (Invitrogen) according to the manufacturer's protocol. The resulting cDNA was subjected to quantitative reverse transcription polymerase chain reaction (qRT-PCR) in triplicate with Power SYBR Green PCR Master Mix (Applied Biosystems). Primer sequences are listed in Table 1. Data were normalized to the expression of endogenous Hprt (hypoxanthine-guanine phosphoribosyltransferase) in each sample, and the relative expression was determined by the 2−ΔΔCT method.
Statistics
Paired or unpaired 2-tailed Student t tests were used for comparisons.
Results
Th0 CD4+ RTEs exhibit striking functional defects
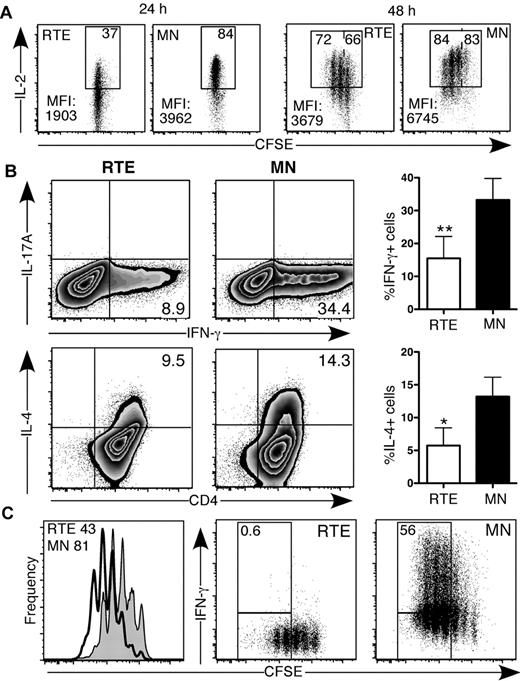
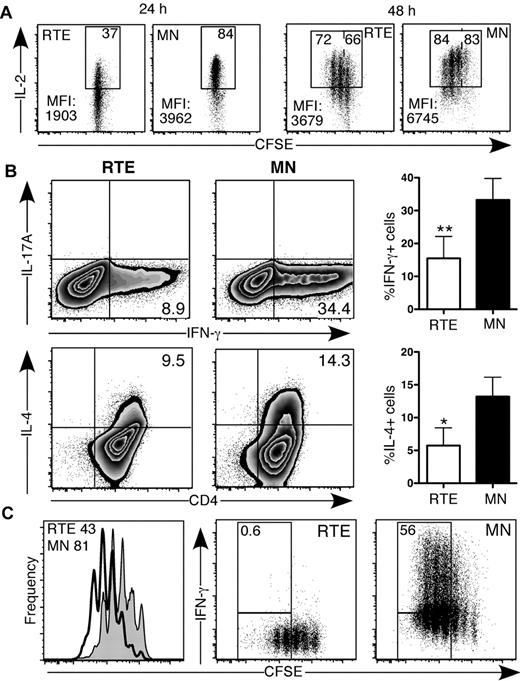
We activated purified, CFSE-labeled naive CD4+ RTEs and MN T cells from RAG2p-GFP Tg mice under Th0 conditions. The dim GFP signal did not interfere with the substantially brighter CFSE signal (supplemental Figure 1A, available on the Blood Web site; see the Supplemental Materials link at the top of the online article). After 24 hours, neither the RTEs nor the MN T cells had divided (Figure 1A), but fewer than half as many RTE- as MN-derived CD4+ T cells produced IL-2. In addition, RTE-derived cells produced dramatically lower levels of IL-2 on a per cell basis (Figure 1A). After 48 hours, fewer RTE-derived CD4+ T cells had undergone at least 1 division; of these divided cells, fewer produced IL-2, and they produced less on a per cell basis (Figure 1A). In addition, RTE-derived CD4+ T cells expressed lower levels of the high-affinity IL-2 receptor (CD25) and exhibited dampened STAT5 signaling compared with their MN-derived counterparts (supplemental Figure 1).
CD4+ RTEs exhibit striking functional defects under Th0 conditions in vitro. CFSE-labeled CD4+ RTEs and MN T cells were stimulated under Th0 conditions for (A) 24 and 48 hours and (B-C) 3 days, stained for intracellular cytokines, and gated as CD4+. (A) Representative data for cells pooled from 3 mice. Numbers in the top right of the gate represent percentage of total IL-2+ cells, whereas numbers in the top left (for the 48-hour plots) represent the percentage of IL-2 producers among those cells that had divided at least once. MFI indicates mean fluorescence intensity. (B) Left panels are representative data; the numbers in quadrants represent the percentage of cytokine-positive cells. In right panels, compiled data are presented as mean ± SEM for 5 independent experiments with cells pooled from 3-4 mice per experiment and a range of anti-CD3 concentrations from 30-500 ng/mL. (C) Histograms (left panel) represent CFSE dilution by RTEs (shaded) and MN T cells (open), and numbers denote the percentage of cells that had undergone ≥ 3 divisions. Numbers in right panels represent the percentage of cytokine producers among those cells that had undergone ≥ 3 divisions. Data are representative of 2 independent experiments with cells pooled from 3-4 mice per experiment and 30 ng/mL anti-CD3. Probability values were calculated with either a paired or unpaired 2-tailed Student t test: *P < .05, **P < .005.
CD4+ RTEs exhibit striking functional defects under Th0 conditions in vitro. CFSE-labeled CD4+ RTEs and MN T cells were stimulated under Th0 conditions for (A) 24 and 48 hours and (B-C) 3 days, stained for intracellular cytokines, and gated as CD4+. (A) Representative data for cells pooled from 3 mice. Numbers in the top right of the gate represent percentage of total IL-2+ cells, whereas numbers in the top left (for the 48-hour plots) represent the percentage of IL-2 producers among those cells that had divided at least once. MFI indicates mean fluorescence intensity. (B) Left panels are representative data; the numbers in quadrants represent the percentage of cytokine-positive cells. In right panels, compiled data are presented as mean ± SEM for 5 independent experiments with cells pooled from 3-4 mice per experiment and a range of anti-CD3 concentrations from 30-500 ng/mL. (C) Histograms (left panel) represent CFSE dilution by RTEs (shaded) and MN T cells (open), and numbers denote the percentage of cells that had undergone ≥ 3 divisions. Numbers in right panels represent the percentage of cytokine producers among those cells that had undergone ≥ 3 divisions. Data are representative of 2 independent experiments with cells pooled from 3-4 mice per experiment and 30 ng/mL anti-CD3. Probability values were calculated with either a paired or unpaired 2-tailed Student t test: *P < .05, **P < .005.
After 3 days under neutral Th0 conditions, strikingly fewer RTE- than MN-derived CD4+ T cells produced IFN-γ and IL-4 (Figure 1B). These cytokine secretion defects were also seen on day 5 and were consistent over a range of anti-CD3 doses, from 30 to 500 ng/mL, and whether or not the medium was supplemented with IL-2 (data not shown). RTE-derived CD4+ T cells also exhibited a dramatic proliferative defect, undergoing fewer rounds of division as determined by CFSE dilution (Figure 1C). To test whether diminished cytokine production resulted from fewer rounds of cell division,17 we analyzed IFN-γ secretion by RTEs and MN T cells as a function of cell proliferation. The frequency of IFN-γ producers at each division was reduced dramatically in the RTE-derived compared with the MN-derived CD4+ population, which demonstrates that proliferative defects did not account for their diminished cytokine production (Figure 1C).
CD4+ RTEs are defective in Th1 lineage commitment in vitro
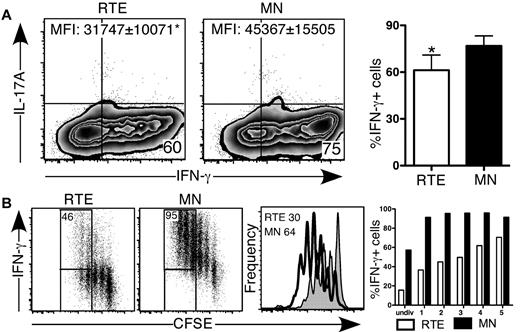
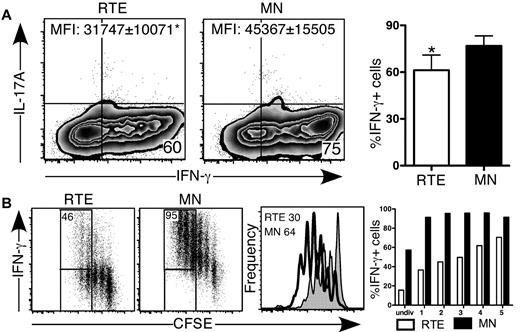
We activated CD4+ RTEs and MN T cells under inflammatory Th1-polarizing conditions in vitro. After 5 days, a lower frequency of RTE- compared with MN-derived CD4+ T cells produced IFN-γ (Figure 2A), and they produced significantly less cytokine on a per cell basis (Figure 2A). As expected, neither RTE- nor MN-derived T cells produced IL-17 under Th1-polarizing conditions. To test whether contaminating antigen-experienced cells in the MN T-cell population had skewed our results, we activated naive CD4+ OT-II TCR Tg RTEs and MN T cells under Th0 and Th1 conditions using OVA peptide. These RTEs were also impaired in IFN-γ production compared with their MN counterparts, which demonstrates that our results were not an artifact of a polyclonal system (supplemental Figure 2).
CD4+ RTEs are defective in Th1 lineage commitment in vitro. CFSE-labeled CD4+ RTEs and MN T cells were differentiated under Th1 conditions for (A) 5 days and (B) 3 days, stained for intracellular IFN-γ and IL-17, and gated as CD4+. (A) Left panels are representative flow cytometry plots. Numbers in quadrants represent the percentage of cells that were cytokine positive. MFI values are for IFN-γ+ populations and are significantly different (P < .05). In the right panel, compiled data are presented as mean ± SEM for 5 independent experiments with cells pooled from 3-4 mice per experiment and a range of anti-CD3 concentrations from 30-500 ng/mL. *Significant difference (P < .05) between populations. (B) Numbers in left panels represent the percentage of cytokine producers among cells that had undergone ≥ 3 divisions. Histograms in right panel represent CFSE dilution by RTEs (shaded) and MN T cells (open), and numbers denote the percentage of cells that had undergone ≥ 3 divisions. Graph represents the percentage of cytokine-producing cells in each division (undiv indicates undivided). Data are representative of 2 independent experiments with cells pooled from 3-4 mice per experiment and 30 ng/mL anti-CD3.
CD4+ RTEs are defective in Th1 lineage commitment in vitro. CFSE-labeled CD4+ RTEs and MN T cells were differentiated under Th1 conditions for (A) 5 days and (B) 3 days, stained for intracellular IFN-γ and IL-17, and gated as CD4+. (A) Left panels are representative flow cytometry plots. Numbers in quadrants represent the percentage of cells that were cytokine positive. MFI values are for IFN-γ+ populations and are significantly different (P < .05). In the right panel, compiled data are presented as mean ± SEM for 5 independent experiments with cells pooled from 3-4 mice per experiment and a range of anti-CD3 concentrations from 30-500 ng/mL. *Significant difference (P < .05) between populations. (B) Numbers in left panels represent the percentage of cytokine producers among cells that had undergone ≥ 3 divisions. Histograms in right panel represent CFSE dilution by RTEs (shaded) and MN T cells (open), and numbers denote the percentage of cells that had undergone ≥ 3 divisions. Graph represents the percentage of cytokine-producing cells in each division (undiv indicates undivided). Data are representative of 2 independent experiments with cells pooled from 3-4 mice per experiment and 30 ng/mL anti-CD3.
To determine whether CD4+ RTEs underwent sufficient rounds of division to commit to the Th1 effector lineage, we analyzed cytokine secretion as a function of cell proliferation (Figure 2B). As under Th0 conditions, Th1 RTE-derived CD4+ T cells underwent fewer rounds of division, and the frequency of IFN-γ producers at each division was greatly reduced compared with the MN-derived CD4+ T-cell population. These results clearly showed that proliferative defects are not solely responsible for hindering CD4+ RTE Th lineage commitment.
CD4+ RTEs are defective in their commitment to the iTreg and Th17 lineages
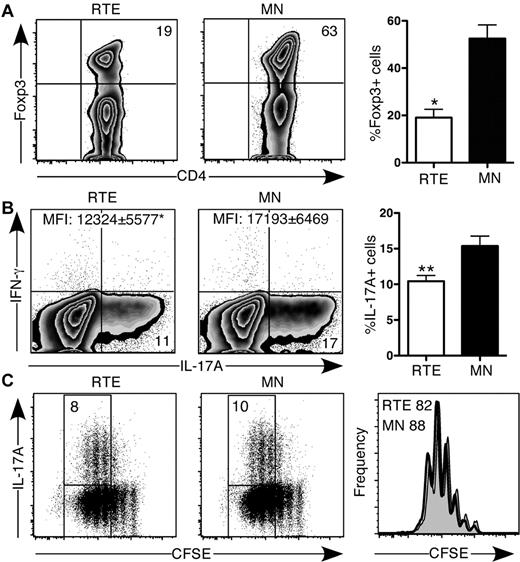
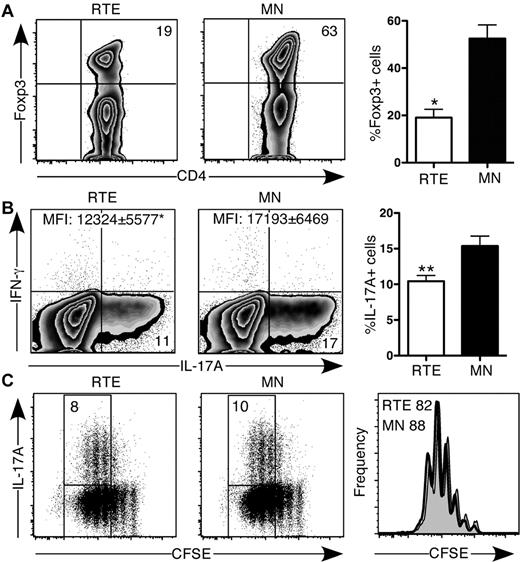
TGF-β signaling plays an important role in CD4+ T-cell lineage commitment, leading to either proinflammatory or anti-inflammatory immune responses by CD4+ Th17 T cells or iTregs, respectively.18 Activation in the presence of TGF-β alone led to a 3-fold higher frequency of Foxp3-expressing MN- compared with RTE-derived CD4+ T cells (Figure 3A). Under Th17-polarizing conditions, the frequency of RTE-derived CD4+ T cells that produced IL-17 was consistently lower than that of MN-derived T cells, and on a per cell basis, they produced less of this cytokine, despite suffering no proliferative defect (Figure 3B-C). Neither RTE- nor MN-derived Th17 T cells produced appreciable amounts of IFN-γ.
CD4+ RTEs are defective in their commitment to the iTreg and Th17 lineages. (A) CD4+ RTEs and MN T cells were differentiated under iTreg conditions for 3 days and then stained for intracellular Foxp3. Left panels are representative plots, and right panel shows compiled data presented as mean ± SEM for 3 independent experiments with cells pooled from 2-3 mice per experiment. CFSE-labeled CD4+ RTEs and MN T cells were differentiated under Th17 conditions for (B) 5 days or (C) 3 days, stained for intracellular IL-17A and IFN-γ, and gated as CD4+. (B) Left panels are representative flow cytometry plots. Numbers in quadrants represent the percentage of cells that were cytokine-positive. MFI values are for IL-17A+ populations and are significantly different (*P < .05). In the right panel, compiled data are presented as mean ± SEM for 5 independent experiments with cells pooled from 3-4 mice per experiment and a range of anti-CD3 concentrations from 30-500 ng/mL. **Significant differences between populations (P < .005). (C) Numbers in left panels represent the percentage of cytokine producers among cells that had undergone ≥ 3 divisions. Histograms in right panel represent CFSE dilution by RTEs (shaded) and MN T cells (open), and numbers denote the percentage of cells that had undergone ≥ 3 divisions. Data are representative of 2 independent experiments with cells pooled from 3-4 mice per experiment and 30 ng/mL anti-CD3.
CD4+ RTEs are defective in their commitment to the iTreg and Th17 lineages. (A) CD4+ RTEs and MN T cells were differentiated under iTreg conditions for 3 days and then stained for intracellular Foxp3. Left panels are representative plots, and right panel shows compiled data presented as mean ± SEM for 3 independent experiments with cells pooled from 2-3 mice per experiment. CFSE-labeled CD4+ RTEs and MN T cells were differentiated under Th17 conditions for (B) 5 days or (C) 3 days, stained for intracellular IL-17A and IFN-γ, and gated as CD4+. (B) Left panels are representative flow cytometry plots. Numbers in quadrants represent the percentage of cells that were cytokine-positive. MFI values are for IL-17A+ populations and are significantly different (*P < .05). In the right panel, compiled data are presented as mean ± SEM for 5 independent experiments with cells pooled from 3-4 mice per experiment and a range of anti-CD3 concentrations from 30-500 ng/mL. **Significant differences between populations (P < .005). (C) Numbers in left panels represent the percentage of cytokine producers among cells that had undergone ≥ 3 divisions. Histograms in right panel represent CFSE dilution by RTEs (shaded) and MN T cells (open), and numbers denote the percentage of cells that had undergone ≥ 3 divisions. Data are representative of 2 independent experiments with cells pooled from 3-4 mice per experiment and 30 ng/mL anti-CD3.
CD4+ RTEs are biased to Th2 effector responses in vitro
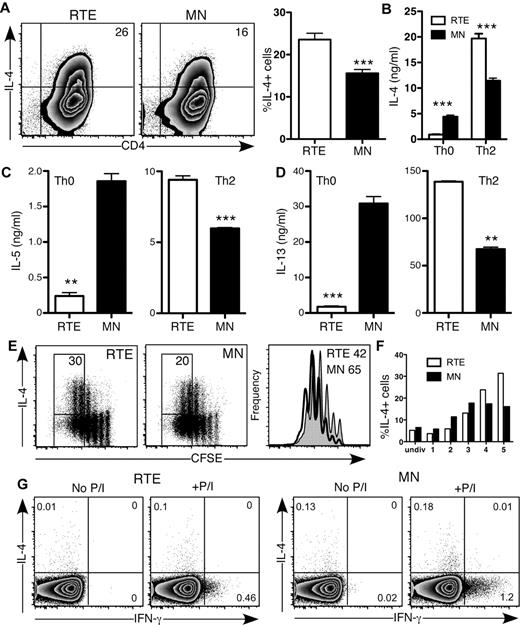
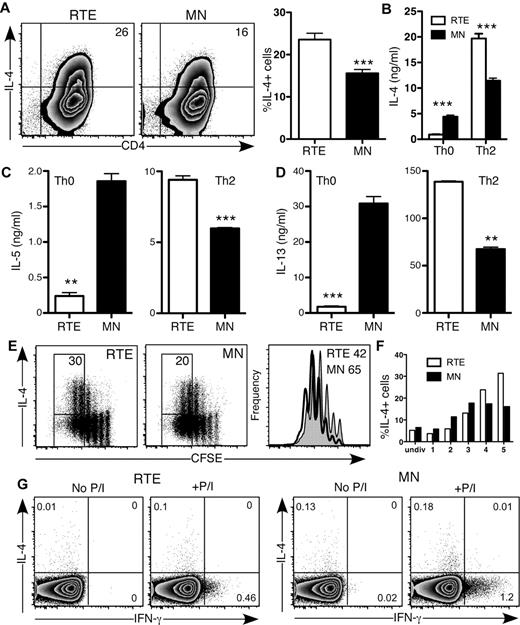
CD4+ RTE function varied from strikingly defective (Th0, Th1) to mildly diminished (Th17), which suggests that RTE function is not globally defective. In fact, when activated under Th2-polarizing conditions in vitro, a greater frequency of RTE- than MN-derived CD4+ T cells produced the Th2 signature cytokine IL-4 (Figure 4A-B). This result is in stark contrast to CD4+ RTEs activated under Th0 conditions, in which IL-4 production was dampened compared with that of MN-derived T cells (Figures 1B and 4B). Even more exaggerated differences were seen with the Th2 cytokines IL-5 and IL-13 (Figure 4C-D). In a Th2-polarizing environment, RTE-derived CD4+ T cells had mild proliferative defects (Figure 4E), and the frequency of IL-4 producers was somewhat lower in the population of RTE-derived cells that had undergone 1-3 divisions than in the MN-derived population. However, by the fourth and fifth divisions, a higher frequency of RTE-derived Th2 CD4+ T cells produced IL-4 (Figure 4E-F). Neonatal CD4+ T cells are biased to a Th2 response, as evidenced by their greater expression of IL-4 under Th0 conditions compared with their adult counterparts.3 Like neonatal cells, RTEs may be inherently biased toward a Th2 response. We measured IL-4 and IFN-γ production in CD4+ RTEs and MN T cells stimulated directly ex vivo with PMA and ionomycin (Figure 4G). Although IFN-γ production was lower in CD4+ RTEs than in similarly treated MN T cells, both populations produced negligible amounts of IL-4 and thus did not appear to be inherently Th2-biased. Taken together, these data demonstrate that a Th2-polarizing environment drives CD4+ RTEs to be “hyper” Th2 effectors.
CD4+ RTEs are biased toward the Th2 effector lineage in vitro. (A) CD4+ RTEs and MN T cells were differentiated under Th2 conditions for 5 days and then stained for IL-4. Numbers in quadrants of representative flow cytometry plots show the percentage of IL-4+ cells. In the right panel, compiled data are presented as mean ± SEM for 8 independent experiments with cells pooled from 3-4 mice per experiment and a range of anti-CD3 concentrations from 30-500 ng/mL. ***Significant difference between populations (P < .0005). (B-D) Supernatants from Th0- and Th2-differentiated CD4+ RTEs and MN T cells were assayed by ELISA for (B) IL-4, (C) IL-5, and (D) IL-13. Error bars represent SD for triplicate wells. Data are representative of ≥ 2 independent experiments with cells pooled from 2-4 mice per experiment. **P < .005, ***P < .0005. (E) CFSE-labeled CD4+ RTEs and MN T cells were differentiated under Th2 conditions for 3 days and stained for IL-4. Numbers represent the percentage of IL-4 producers among cells that had undergone ≥ 4 divisions. Histograms represent CFSE dilution by RTEs (shaded) and MN T cells (open), and numbers denote the percentage of cells that had undergone ≥ 4 divisions. (F) Graph represents the percentage of IL-4–producing cells in each division (undiv indicates undivided). Data are representative of 2 independent experiments with cells pooled from 3-4 mice per experiment and 30 ng/mL anti-CD3. (G) Purified CD4+ RTEs and MN T cells were stimulated directly ex vivo for 5 hours with or without PMA and ionomycin (P/I). Cells were stained for intracellular IL-4 and IFN-γ and gated as CD4+CD44lo. Numbers in quadrants represent the percentages of cytokine-positive cells.
CD4+ RTEs are biased toward the Th2 effector lineage in vitro. (A) CD4+ RTEs and MN T cells were differentiated under Th2 conditions for 5 days and then stained for IL-4. Numbers in quadrants of representative flow cytometry plots show the percentage of IL-4+ cells. In the right panel, compiled data are presented as mean ± SEM for 8 independent experiments with cells pooled from 3-4 mice per experiment and a range of anti-CD3 concentrations from 30-500 ng/mL. ***Significant difference between populations (P < .0005). (B-D) Supernatants from Th0- and Th2-differentiated CD4+ RTEs and MN T cells were assayed by ELISA for (B) IL-4, (C) IL-5, and (D) IL-13. Error bars represent SD for triplicate wells. Data are representative of ≥ 2 independent experiments with cells pooled from 2-4 mice per experiment. **P < .005, ***P < .0005. (E) CFSE-labeled CD4+ RTEs and MN T cells were differentiated under Th2 conditions for 3 days and stained for IL-4. Numbers represent the percentage of IL-4 producers among cells that had undergone ≥ 4 divisions. Histograms represent CFSE dilution by RTEs (shaded) and MN T cells (open), and numbers denote the percentage of cells that had undergone ≥ 4 divisions. (F) Graph represents the percentage of IL-4–producing cells in each division (undiv indicates undivided). Data are representative of 2 independent experiments with cells pooled from 3-4 mice per experiment and 30 ng/mL anti-CD3. (G) Purified CD4+ RTEs and MN T cells were stimulated directly ex vivo for 5 hours with or without PMA and ionomycin (P/I). Cells were stained for intracellular IL-4 and IFN-γ and gated as CD4+CD44lo. Numbers in quadrants represent the percentages of cytokine-positive cells.
CD4+ RTEs are characterized by distinct transcription factor and cytokine receptor expression patterns
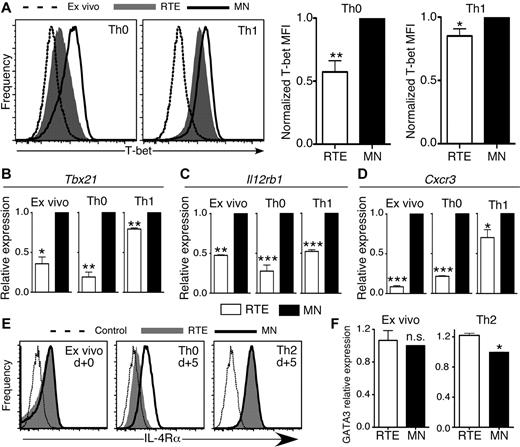
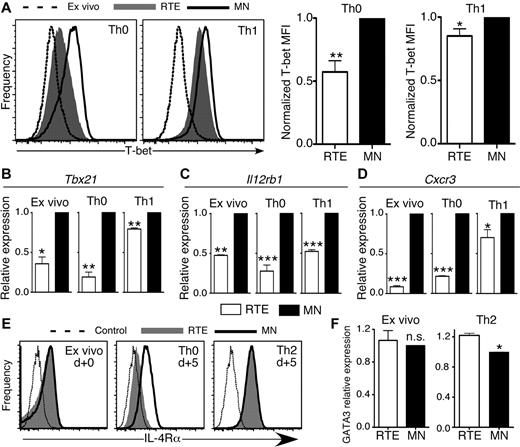
T-bet regulates IFN-γ expression and is a crucial transcription factor for CD4+ Th1 effector cell development.15 Significantly lower levels of T-bet protein and Tbx21 (T-box transcription factor 21) mRNA were present in RTE- than in MN-derived CD4+ T cells activated under both Th0 and Th1 conditions (Figure 5A-B). CD4+ RTEs analyzed directly ex vivo also had lower expression of Tbx21 mRNA than MN T cells. These results are in line with our IFN-γ secretion data (Figure 4G), which suggests that RTEs are inherently biased against Th1 differentiation.
CD4+ RTEs are characterized by distinct transcription factor and cytokine-receptor expression patterns. (A) CD4+ RTEs and MN T cells were differentiated under Th0 or Th1 conditions for 5 days and then stained for intracellular T-bet. Representative histograms show Th0 and Th1 CD4+ RTEs (shaded) or MN T cells (open) and MN T cells stained directly ex vivo (dashed line). MFI values were normalized by expressing RTE values as a percentage of the MN value, which was set to 1, and these compiled data are presented as mean ± SEM for 4 independent experiments with cells pooled from 3-4 mice per experiment and anti-CD3 concentrations ranging from 30-500 ng/mL. *P < .05, **P < .005. qRT-PCR for (B) Tbx21, (C) Il12rb1, and (D) Cxcr3 expression on ex vivo and Th0- or Th1-differentiated CD4+ RTEs and MN T cells. Data are presented as mean ± SD for 3 independent experiments with cells pooled from 2-4 mice per experiment for each target. *P < .05, **P < .005, ***P < .0005. (E) CD4+ RTEs and MN T cells were stained for IL-4Rα directly ex vivo or 5 days after stimulation under Th0 and Th2 conditions. Representative histograms show RTEs (shaded), MN T cells (solid line), and isotype control (dotted line). MFI of IL-4Rα for Th0 RTEs was 220 ± 77, and for Th0 MN T cells, it was 532 ± 109, and this difference was significant (P = .005). MFI of IL-4Rα for Th2 RTEs was 863 ± 69, and for Th2 MN T cells, it was 948 ± 92, and this difference was not significant (n.s.; P > .05). MFI data were compiled from 3 independent experiments with cells pooled from 2-3 mice per experiment. (F) qRT-PCR for GATA3 expression on purified ex vivo and 5 day Th2-differentiated CD4+ RTEs and MN T cells. Data are presented as mean ± SD for 3 independent experiments with cells pooled from 2-3 mice per experiment. *P < .05.
CD4+ RTEs are characterized by distinct transcription factor and cytokine-receptor expression patterns. (A) CD4+ RTEs and MN T cells were differentiated under Th0 or Th1 conditions for 5 days and then stained for intracellular T-bet. Representative histograms show Th0 and Th1 CD4+ RTEs (shaded) or MN T cells (open) and MN T cells stained directly ex vivo (dashed line). MFI values were normalized by expressing RTE values as a percentage of the MN value, which was set to 1, and these compiled data are presented as mean ± SEM for 4 independent experiments with cells pooled from 3-4 mice per experiment and anti-CD3 concentrations ranging from 30-500 ng/mL. *P < .05, **P < .005. qRT-PCR for (B) Tbx21, (C) Il12rb1, and (D) Cxcr3 expression on ex vivo and Th0- or Th1-differentiated CD4+ RTEs and MN T cells. Data are presented as mean ± SD for 3 independent experiments with cells pooled from 2-4 mice per experiment for each target. *P < .05, **P < .005, ***P < .0005. (E) CD4+ RTEs and MN T cells were stained for IL-4Rα directly ex vivo or 5 days after stimulation under Th0 and Th2 conditions. Representative histograms show RTEs (shaded), MN T cells (solid line), and isotype control (dotted line). MFI of IL-4Rα for Th0 RTEs was 220 ± 77, and for Th0 MN T cells, it was 532 ± 109, and this difference was significant (P = .005). MFI of IL-4Rα for Th2 RTEs was 863 ± 69, and for Th2 MN T cells, it was 948 ± 92, and this difference was not significant (n.s.; P > .05). MFI data were compiled from 3 independent experiments with cells pooled from 2-3 mice per experiment. (F) qRT-PCR for GATA3 expression on purified ex vivo and 5 day Th2-differentiated CD4+ RTEs and MN T cells. Data are presented as mean ± SD for 3 independent experiments with cells pooled from 2-3 mice per experiment. *P < .05.
T-bet expression and commitment to the Th1 effector lineage are regulated in part by signaling through the IL-12 receptor (IL-12R), which leads to activation of STAT4 and up-regulation of IFN-γ expression. IFN-γ signaling activates STAT1 and up-regulates T-bet expression, in turn initiating the program of Th1 differentiation.15 CD4+ RTE defects in both T-bet and IFN-γ expression suggest that upstream signaling may be impaired in these cells, a notion we tested by qRT-PCR analysis of Il12rb1 (IL-12R β1 subunit) mRNA expression. Directly ex vivo, and under both neutral Th0 and inflammatory Th1-polarizing conditions, CD4+ RTE-derived cells expressed lower levels of Il12rb1 than MN-derived T cells (Figure 5C).
Two key targets of the transcription factor T-bet are IFN-γ and the Th1-associated chemokine receptor CXCR3.19,20 Both ex vivo and activated RTE-derived CD4+ T cells expressed much lower levels of Cxcr3 mRNA (Figure 5D), which suggests that modestly reduced T-bet expression levels drive amplified downstream effects on RTE Th1 differentiation.
Differentiation to the Th2 lineage depends on signaling through the IL-4 receptor (IL-4R), which leads to phosphorylation and activation of the transcription factor STAT6.15 We therefore stained ex vivo and Th0- and Th2-polarized CD4+ RTE and MN T cells for IL-4Rα. Taken directly ex vivo, CD4+ RTE and MN T cells expressed similar levels of IL-4Rα (Figure 5E). After 5 days of stimulation, Th0 RTE-derived cells did not up-regulate IL-4Rα to the same extent as MN-derived T cells, whereas Th2-polarized RTEs did.
Interestingly, RTEs cultured overnight under Th2 conditions showed diminished STAT6 phosphorylation compared with MN T cells, but their levels were similar by day 4 (supplemental Figure 3). These data are consistent with our CFSE data showing that in the earlier rounds of division during Th2 differentiation, RTEs lagged behind their MN counterparts in IL-4 production, although they surpass them later (Figure 4F).
GATA-3 is the Th2-lineage–specific transcription factor that regulates expression of IL-5 and IL-13, and its expression is controlled by IL-4R/STAT6 signaling.21 We analyzed GATA-3 expression in Th2-polarized CD4+ RTEs and MN T cells by flow cytometry and qRT-PCR. Expression levels of GATA-3 in ex vivo CD4+ RTEs and MN T cells were similar at both the mRNA and protein levels but were significantly higher in Th2-polarized RTEs (Figure 5F and data not shown).
CD4+ RTEs remain flexible in their Th responses
Our work using well-defined in vitro polarization schemes demonstrates that RTEs do not mount a robust response, except in a Th2 environment. Under these experimental conditions, RTEs were cultured in the absence of MN T cells. Although this mimics the neonatal environment, to better understand the RTE Th response in the adult environment, we mixed RTEs and MN T cells at various ratios and cultured them under neutral and polarizing conditions (Table 2; supplemental Figure 4). Under Th0 conditions, RTEs maintained defective IFN-γ production even when they constituted only 20% of the population and were thus surrounded by MN T cells that expressed high levels of IFN-γ. When RTEs constituted only 20% or 50% of the T-cell population under Th1 conditions, their IFN-γ response was similar to that of the MN T cells that sharing the well. Under Th2 conditions, however, RTEs maintained their enhanced Th2 effector function even when they were in the minority. Collectively, these data suggest that neighboring CD4+ MN T cells can influence RTEs in their Th responses, but the Th2 bias of RTEs is cell-intrinsic.
CD4+ RTEs are biased to Th2 effector responses in vivo
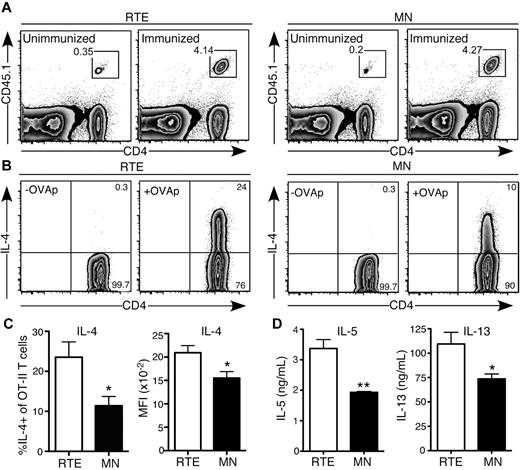
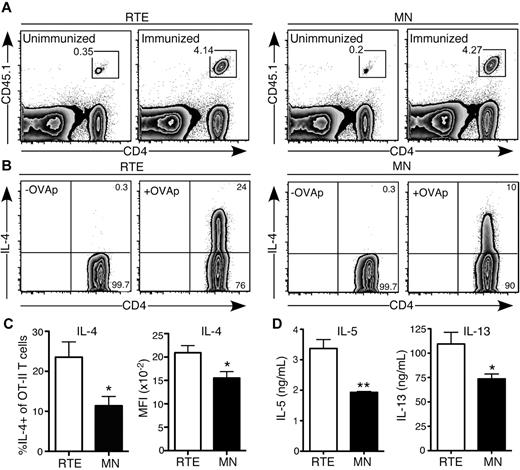
Our in vitro data demonstrate that when exposed to a highly polarizing Th2 environment, CD4+ RTEs are more likely than their MN counterparts to commit to this lineage. To determine whether this bias is relevant in the context of an in vivo immune response, we turned to an antigen-specific model, using papain as an adjuvant to drive a Th2 response.22 We transferred CD4+ OT-II TCR Tg RTEs and MN T cells into separate B6 hosts and immunized them with OVA and papain. This protocol generated a robust response by day 4, and accumulation of RTE-derived (1.4 × 10⁶ ± 0.18 × 10⁶) and MN-derived (1.3 × 10⁶ ± 0.17 × 10⁶) Vα2+Vβ5+CD4+ T cells in the draining LNs was not significantly different (P > .6; Figure 6A). These data recapitulated our in vitro results, which showed only a mild defect in proliferation by Th2-differentiated RTEs (Figure 4E). However, a greater frequency of RTE-derived cells produced IL-4, and on a per cell basis, they generated more of this cytokine (Figure 6B-C). In addition, production of IL-5 and IL-13 was higher in the RTE- than in the MN-derived population (Figure 6D). These data demonstrate that the Th2 bias of CD4+ RTEs is physiologically relevant in an acute model of allergy.
CD4+ RTEs are biased to Th2 effector responses in vivo. Purified OT-II TCR Tg CD4+CD45.1+ RTEs and MN T cells were transferred into B6 hosts and immunized subcutaneously 1 day later with OVA and papain. Cells from draining inguinal LNs were analyzed for cytokine production on day 4. (A) Representative flow cytometry plots show accumulation of CD4+ RTEs (left) and MN T cells (right) in unimmunized and immunized hosts. Gated cells are > 99% Vα2+Vβ5+. (B) Representative plot showing IL-4 production by transferred Vα2+Vβ5+ OT-II RTE (left) and MN (right) T cells after a 5-hour restimulation in the presence (+OVAp) or absence (-OVAp) of OVA323-339 peptide. Numbers represent percentage of cells in that gate. (C) Percentage of IL-4+ OT-II CD4+ T cells and MFI of IL-4+ cells. Compiled data are presented as mean ± SEM for 4 individually analyzed mice per group. *P < .05. (D) Transferred OT-II CD4+ RTEs and MN T cells were sort purified and restimulated with plate-bound anti-CD3 plus anti-CD28. Supernatants were harvested after 72 hours and assayed for IL-5 and IL-13 by ELISA. Data are presented as mean ± SD of triplicate wells. *P < .05, **P < .005.
CD4+ RTEs are biased to Th2 effector responses in vivo. Purified OT-II TCR Tg CD4+CD45.1+ RTEs and MN T cells were transferred into B6 hosts and immunized subcutaneously 1 day later with OVA and papain. Cells from draining inguinal LNs were analyzed for cytokine production on day 4. (A) Representative flow cytometry plots show accumulation of CD4+ RTEs (left) and MN T cells (right) in unimmunized and immunized hosts. Gated cells are > 99% Vα2+Vβ5+. (B) Representative plot showing IL-4 production by transferred Vα2+Vβ5+ OT-II RTE (left) and MN (right) T cells after a 5-hour restimulation in the presence (+OVAp) or absence (-OVAp) of OVA323-339 peptide. Numbers represent percentage of cells in that gate. (C) Percentage of IL-4+ OT-II CD4+ T cells and MFI of IL-4+ cells. Compiled data are presented as mean ± SEM for 4 individually analyzed mice per group. *P < .05. (D) Transferred OT-II CD4+ RTEs and MN T cells were sort purified and restimulated with plate-bound anti-CD3 plus anti-CD28. Supernatants were harvested after 72 hours and assayed for IL-5 and IL-13 by ELISA. Data are presented as mean ± SD of triplicate wells. *P < .05, **P < .005.
Our in vitro data on IFN-γ, T-bet, and GATA-3 expression by CD4+ RTEs suggested that this population is inherently biased against Th1 effector function and toward a Th2 response. To test this in vivo, we generated a mixed Th1/Th2 response by adoptively transferring polyclonal purified CD4+ RTEs and MN T cells into T cell–deficient TCRβ/δ−/− mice and immunizing them the next day with NP(23)-KLH emulsified in complete Freund adjuvant. We analyzed sera collected on days 14 and 21 for anti-NP IgG1 and IgG2a antibodies (Table 3; supplemental Figure 5). The ratio of IgG1, a Th2-associated isotype, to IgG2a, a Th1-associated isotype, was significantly higher in hosts that received CD4+ RTEs, although there was similar accumulation (P > .05) of donor RTEs (1.8 × 10⁶ ± 1.1 × 10⁶) and MN T cells (1.2 × 10⁶ ± 0.5 × 10⁶) in the draining LN on day 7. These data demonstrate that during a mixed Th immune response in vivo, CD4+ RTEs are indeed biased against a Th1 response, favoring a Th2 response.
CD4+ RTEs mediate enhanced eosinophilia in an acute model of airway inflammation
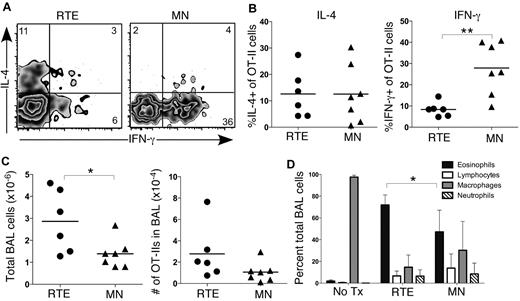
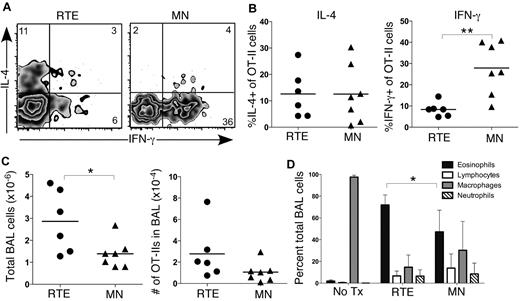
We next used an acute model of allergic airway inflammation to determine whether the Th bias in RTEs leads to enhanced Th2 pathology.23 This in vivo model mimics the pathology of asthma and generates significant disease in B6 mice, despite their inherent Th1 bias. We transferred OT-II TCR Tg RTEs and MN T cells into separate B6 hosts and administered intranasal TSLP and OVA every other day for 14 days. Analysis of transferred cells collected by BAL revealed similar accumulation of RTE- and MN-derived Vα2+Vβ5+CD4+ cells and similar levels of IL-4 production (Figure 7A-C). Interestingly, a significantly lower frequency of transferred RTE-derived cells than MN-derived cells produced IFN-γ (Figure 7B), and total cellularity in the BAL fluid was significantly higher in treated mice that received RTEs (Figure 7C). Eosinophils are a critical effector population in asthma, and a hallmark of airway inflammatory disease is eosinophilia in the BAL fluid.24 Mice that received RTEs exhibited significantly greater eosinophilia than those that received MN T cells (Figure 7D). Collectively, these data demonstrated a relevant physiologic consequence to the RTE Th1/Th2 bias, which was present even after a 2-week disease induction period.
CD4+ RTEs mediate enhanced Th2 pathology in an acute model of airway inflammation. Purified OT-II TCR Tg CD4+CD45.1+ RTEs and MN T cells were transferred into B6 hosts on day 0. Hosts were treated intranasally with TSLP and OVA every other day for 14 days. Analysis was performed on day 15. (A) Representative flow cytometry plots show IL-4 and IFN-γ production by transferred Vα2+Vβ5+ OT-II RTE and MN T cells isolated by BAL after a 5-hour restimulation in vitro in the presence of OVA323-339 peptide. Numbers represent percentage of cytokine-positive cells in that gate. (B) Graphs show percentage of IL-4+ (left panel) and IFN-γ+ (right panel) of transferred OT-II RTEs and MN T cells. Each symbol represents 1 individually analyzed mouse. (C) Total number of cells (left) and number of transferred OT-II cells (right) isolated by BAL of immunized hosts that received either CD4+ RTEs or MN T cells. Each symbol represents 1 individually analyzed mouse. (D) Differential cells counts from cytospins of BAL fluid. Data are mean ± SD for 2 independent experiments with 6-7 individually analyzed mice per group. *P < .05, **P < .005.
CD4+ RTEs mediate enhanced Th2 pathology in an acute model of airway inflammation. Purified OT-II TCR Tg CD4+CD45.1+ RTEs and MN T cells were transferred into B6 hosts on day 0. Hosts were treated intranasally with TSLP and OVA every other day for 14 days. Analysis was performed on day 15. (A) Representative flow cytometry plots show IL-4 and IFN-γ production by transferred Vα2+Vβ5+ OT-II RTE and MN T cells isolated by BAL after a 5-hour restimulation in vitro in the presence of OVA323-339 peptide. Numbers represent percentage of cytokine-positive cells in that gate. (B) Graphs show percentage of IL-4+ (left panel) and IFN-γ+ (right panel) of transferred OT-II RTEs and MN T cells. Each symbol represents 1 individually analyzed mouse. (C) Total number of cells (left) and number of transferred OT-II cells (right) isolated by BAL of immunized hosts that received either CD4+ RTEs or MN T cells. Each symbol represents 1 individually analyzed mouse. (D) Differential cells counts from cytospins of BAL fluid. Data are mean ± SD for 2 independent experiments with 6-7 individually analyzed mice per group. *P < .05, **P < .005.
Discussion
The distinct phenotype of CD4+ RTEs suggests that these transitional T cells exhibit differential functional capabilities compared with their more mature T-cell counterparts in the periphery. Indeed, we show here that RTEs exhibit a bias in Th differentiation, both in vitro and in vivo. The most striking defects in RTE responses were seen under neutral Th0 conditions, characterized by dramatically reduced proliferation and cytokine production, lower expression of key transcription factors and Th-associated receptors, and diminished activation of STAT proteins. These defects were not ameliorated in an environment in which cytokine-producing MN T cells were in the majority, which suggests that they are cell-intrinsic. In addition, differential cell survival in culture did not appear to play a role in the RTE functional defects that we observed. No cell count differences were noted, and analysis of apoptotic cells revealed that 3-day Th0-, Th1-, and Th2-differentiated RTEs may survive better than MN T cells (supplemental Figure 6). Thus, RTE cytokine defects are not simply the result of diminished cell viability.
Our data demonstrate that in a Th1 environment, RTEs maintain flexibility in their response. When CD4+ RTEs are the sole T-cell population (Table 3; Figure 2), reduced IFN-γ production drives diminished Th1 effector function; however, in the presence of a highly inflammatory mature T-cell response, RTEs are able to overcome these defects. In addition, RTEs promote antibody isotype switching (Table 3), which demonstrates that these cells possess distinct effector function and are not globally impaired. These data point to an inherent bias against Th1 effector function by CD4+ RTEs that is likely the result of lower T-bet and IL-12R expression levels. These data may also help explain conflicting reports on whether neonatal Th1 responses are defective.25 In certain situations, neonates develop effective Th1 function, and this may be due to a highly Th1-polarizing infection and/or the presence of MN T cells. These characteristics may benefit the host, allowing a full response by RTEs when inflammatory signals indicate an urgent need.
Our data are consistent with the Th2 bias previously noted for neonatal CD4+ T cells in the mouse, the majority of which are RTEs.25 A striking difference between CD4+ RTEs and neonatal cells, however, is the nature of the Th2 bias. Although neonatal CD4+ T cells produce higher levels of IL-4 after activation under neutral Th0 conditions,3,16 the same signals delivered to adult RTEs drive poor cytokine secretion. However, a Th2 environment drives RTE cytokine secretion in excess of that achieved by mature peripheral T cells. Our data suggest a scenario in which RTEs do not exhibit a Th2 bias during the initiation phase of Th differentiation. Rather, they resemble Th0-type effectors with a bias against the Th1 lineage. Higher levels of GATA-3 and inherently lower levels of T-bet in RTEs may lead to greater Th2 effector function and its associated pathology. Indeed, our in vivo data suggest that diminished IFN-γ production, and thus Th1 effector function, in germinal centers (Table 3) and at effector sites (Figure 7) may drive a Th2 response.
The Th2 response is even more dramatic when RTEs meet antigen and a Th2 stimulus in a lymphoreplete host. The present data (Table 2; Figure 6) clearly demonstrate that even when RTEs reside in an MN T cell–rich environment, they respond with enhanced Th2 function. During the short 4-day time frame of this in vivo allergy-induction model, the RTEs were likely still undergoing maturation, and it is thus not surprising that the Th2 bias is still intact. What is perhaps more surprising is the enhanced eosinophilia and BAL fluid cellularity in hosts that received RTEs (Figure 7) subjected to a 2-week time course for disease induction, a time frame during which RTEs have completed much of their maturation. These data are in line with work on CD8+ RTEs showing that the time of initial antigen encounter can influence cell fate decisions long after.10 It is unclear why decreased IFN-γ but no increased IL-4 production by RTEs leads to greater eosinophilia. Perhaps the issue is timing, given that cytokine production was measured on day 15, whereas eosinophilic influx may occur earlier. Enhanced Th2 cytokine production by RTEs at earlier time points may drive greater BAL fluid cellularity.
Why would RTEs exhibit distinct Th effector function? The Th2 bias may be influenced by repertoire shaping, given that the TCR-β chains expressed by CD4+ RTEs are skewed toward longer CDR3 regions than those of MN T cells.26 In line with these data, Boyton and colleagues27 have shown that relative to Th1 clones, Th2 clones have significantly longer TCR-α CDR3 loops. The Th2 bias may also be influenced by differences in TCR signaling between RTEs and MN T cells. Differentiation to the Th2 lineage is associated with a relatively weak TCR signal, and RTEs may exhibit distinct TCR signaling despite expressing higher surface levels of TCR than MN T cells.7,28 We are continuing to investigate the mechanistic basis for these differences.
The answer to this question may be part of a larger picture that involves protection of the host from immunopathology. A dampened response in the absence of inflammation may prevent inappropriate responses by RTEs to tissue-restricted self-antigens during the critical period of postthymic maturation. Indeed, CD4+ RTE functional and phenotypic maturation requires access to secondary lymphoid organs,9 and scanning these environments is important for the induction of T-cell tolerance to self-antigens expressed exclusively in the periphery in a noninflammatory context.29 A diminished RTE response may also protect neonates, whose T-cell population includes fewer Foxp3+ Tregs and whose RTEs enter an autoimmune-promoting lymphopenic environment.30 A Th2 bias that develops in the later stages of lineage commitment may inhibit a more inflammatory and potentially detrimental Th1 response to self-antigens by maturing RTEs. Clearly, taking a newly generated product of intrathymic development and transforming it into a responsive, but safe, component of the peripheral T-cell pool is a complicated process.
The online version of this article contains a data supplement.
The publication costs of this article were defrayed in part by page charge payment. Therefore, and solely to indicate this fact, this article is hereby marked “advertisement” in accordance with 18 USC section 1734.
Acknowledgments
The authors thank Rachel Niec, Drs M.M. Curtis, M. Headley, and S. Josefowicz for advice, and Drs A. Farr and M. Nussenzweig for reagents and mice.
This work was supported by National Institutes of Health grant R01 AI064318 (to P.J.F. with a supplement to D.W.H.) and a National Cancer Institute Basic and Cancer Immunology grant (to D.W.H.). The content is solely the responsibility of the authors and does not necessarily represent the official views of the National Institute of Allergy and Infectious Diseases or the National Institutes of Health.
National Institutes of Health
Authorship
Contribution: D.W.H. designed and performed experiments, collected and analyzed data, and wrote the manuscript; and P.J.F. designed and performed experiments, analyzed data, and wrote the manuscript.
Conflict-of-interest disclosure: The authors declare no competing financial interests.
Correspondence: Dr Pamela J. Fink, Department of Immunology, University of Washington, 1959 NE Pacific St, Campus Box 357650, Seattle, WA 98195; e-mail: pfink@u.washington.edu.

