Abstract
Common myeloid progenitors (CMPs) were first identified as progenitors that were restricted to myeloid and erythroid lineages. However, it was recently demonstrated that expression of both lymphoid- and myeloid-related genes could be detected in myeloid progenitors. Furthermore, these progenitors were able to give rise to T and B lymphocytes, in addition to myeloid cells. Yet, it was not known whether these progenitors were multipotent at the clonogenic level or there existed heterogeneity within these progenitors with different lineage potential. Here we report that previously defined CMPs possess T-lineage potential, and that this is exclusively found in the Flt3+CD150– subset of CMPs at the clonal level. In contrast, we did not detect B-lineage potential in CMP subsets. Therefore, these Flt3+CD150– myeloid progenitors were T/myeloid potent. Yet, Flt3+CD150– myeloid progenitors are not likely to efficiently traffic to the thymus and contribute to thymopoiesis under normal conditions because of the lack of CCR7 and CCR9 expression. Interestingly, both Flt3+CD150– and Flt3–CD150– myeloid progenitors are susceptible to Notch1-mediated T-cell acute lymphoblastic leukemia (T-ALL). Hence, gain-of-function Notch1 mutations occurring in developing myeloid progenitors, in addition to known T-lineage progenitors, could lead to T-ALL oncogenesis.
Introduction
All blood lineages ultimately arise from hematopoietic stem cells (HSCs). HSCs, along with downstream multipotent progenitors (MPPs) and lymphoid-primed MPPs (LMPPs), are present within a small pool of bone marrow (BM) cells with the surface phenotype of LSK (Lineage-marker− Sca1+ Kit+).1,2 Outside of LSK progenitors, a population of BM progenitors characterized as Lin–Sca1–Kit+CD34+FcγRlow was found to be able to give rise to myeloid or erythroid cells, but appeared to lack the ability to generate lymphoid cells in in vivo and in vitro assays.3 Thus it appeared these cells were restricted to myeloid/erythroid lineages. Because myeloid and erythroid potential was present at the clonogenic level within this population, these progenitors were termed common myeloid progenitors, or CMPs.3 Granulocyte/monocyte progenitors (GMPs) and megakaryocyte/erythrocyte progenitors (MEPs) were also identified. As GMPs and MEPs possessed a more restricted developmental potential than CMPs, it was postulated that GMPs and MEPs were downstream of CMPs and that CMPs gave rise to myeloid cells or erythroid cells via GMPs or MEPs, respectively.3
More recent work has suggested that a degree of lymphoid potential persists in myeloid progenitors. First, myeloid progenitors transduced with stabilized β-catenin were able to give rise to T and B lymphocytes.4 Using Ikaros-reporter mice,5 expression of both lymphoid- and myeloid-related genes was detected in Lin–Sca1–Kit+GFPIkaros+ BM cells, suggesting the existence of lymphoid-myeloid progenitors within the previously thought myeloid/erythroid-restricted progenitor compartment.6 It was further shown that some of these progenitors were able to give rise to T and B lymphocytes, in addition to myeloid cells, at the population level.6 However, it was not known whether individual cells within this population were multipotent at the clonal level. Alternatively, there might be heterogeneity within this population where subsets of progenitors possess different lineage potentials. Indeed, recent work has clearly established heterogeneity for myeloid and erythroid lineage potentials among CMPs. CMPs can be subdivided into CD150– (preGM) and CD150+ (preMegE) populations, with biased developmental potentials toward myeloid and erythroid lineages, respectively.7 As the lymphoid developmental potential was reported to exist in the conventional Lin−Sca1−Kit+ myeloid-erythroid compartment,6 we looked for lymphoid developmental potential in these conventional myeloid progenitors.
Here, we report T-lineage development from the traditionally defined CMP population. We find that CMPs when cocultured with OP9 stromal cells expressing Notch ligands, Delta-like 1 or Delta-like 4 (OP9DL1 or OP9DL4, respectively),8 could readily give rise to T-lineage cells, at a precursor frequency approximately 10-fold lower than multipotent LSK cells. Based on Flt3 expression, the CD150– CMP subset can be further subdivided into rare Flt3+CD150– preGMs and more abundant Flt3–CD150– preGMs. These 2 preGM subsets, together with the CD150+ preMegE subset of CMPs, were tested for T-lineage potential activity. We find that the T-lineage potential is specifically confined to Flt3+CD150– preGMs, of which a very high frequency (∼ 50%) are able to generate T-lineage progeny. However, Flt3+CD150– preGMs lack detectable B lymphoid potential but exhibit appreciable myeloid and T lymphoid potential at the clonogenic level. We find that Flt3+CD150– preGMs lack both CCR7 and CCR9 expression, 2 chemokine receptors implicated in thymic homing.9-11 Hence, they are not likely to contribute to thymopoiesis significantly under normal conditions. Finally, Flt3+CD150– preGMs, as well as Flt3−CD150− preGMs, are susceptible to Notch1-mediated T-cell acute lymphoblastic leukemia (T-ALL),12 raising the possibility that gain-of-function Notch1 mutations occurring in myeloid progenitors could result in T-ALL oncogenesis.
Methods
Mice
All experiments were performed in mice. C57BL/6 (CD45B6) and C57BL/6 Ly5.2 (CD45SJL) mice were purchased from the National Cancer Institute animal facility. NG-BAC mice were obtained from M Nussenzweig (Rockefeller University, New York, NY). Mice used for analysis were females of 4-10 weeks of age, unless otherwise indicated. Recipient mice were all 4-6 week-old females. Mice that received ICN1-transduced cells were closely monitored and promptly killed for analysis on showing signs of cachexia.12 All live animal experiments were performed according to protocols approved by the Office of Regulatory Affairs of the University of Pennsylvania in accordance with guidelines set forth by the National Institutes of Health.
Cell preparation, flow cytometry, and cell sorting
BM isolated from femurs, tibias, and humerus was treated with ACK lysis buffer (Lonza) to remove RBC and single-cell suspensions were made before staining with Ab. Cells were stained with optimal dilutions of Ab. Abs in the lineage mixture included α-B220 (RA3-6B2), α-CD19 (1D3), α-CD11b/Mac1 (M1/70), α-Gr1 (8C5), α-CD11c (HL3), α-NK1.1 (PK136), α-Ter119 (Ter119), α-CD3ϵ (145-2C11), α-CD8α (53-6.7), α-CD8β (53-5.8), α-TCRβ (H57), α-Thy1.2 (53-2.1), and α-γδTCR (GL3). Additional Abs used included α-CD45B6,(104) α-CD45SJL (A20), α-Sca1 (E13-161.7), α-Kit (2B8), α-Flt3 (A2F10.1), α-CD34 (RAM34), α-FcγRII/III,(93) α-CD150 (9D1), α-CD25 (PC61.5), and α-IL7Rα (A7R34). All Abs were directly conjugated to FITC, PE, PEcy5.5, PEcy7, APC, APCcy5.5 (or Alexa 700), APCcy7 (or APCeFluor780), Pacific Blue, or biotin and were purchased from eBioscience or BioLegend. Biotinylated Abs were revealed with Streptavidin PE-TexasRed (BD Pharmingen).
For flow cytometric analysis, Ab-stained cell suspensions were pretreated with 4′,6′-diamidino-2-phenylindole (DAPI) for dead-cell exclusion before being analyzed on the LSR-II (BD Biosciences). Doublets were excluded using forward side scatter-height versus forward side scatter-width and side scatter-height versus side scatter-width parameters. Data were analyzed using FlowJo Version 8.8.6 (TreeStar).
To obtain various highly purified myeloid progenitors, BM cells were stained as indicated in Figures 1A and 2A, and were double sorted on the FACSAria (BD Biosciences). HSCs were sorted as Flt3−CD150+ BM LSK cells (Lin−Sca1+Kit+). MPPs were obtained as Flt3+ LSK cells. Lymphoid-primed MPPs, LMPPs, were the Flt3high subset of MPPs. CMPs were obtained as Lin−Sca1−Kit+ FcγRII/IIIlowCD34+; GMPs as Lin−Sca1−Kit+FcγRII/IIIhiCD34+; and MEPs as Lin−Sca1−Kit+FcγRII/IIIlowCD34−. Within the CMP gate, Flt3+CD150− preGMs were obtained as Lin−Sca1−Kit+ FcγRII/IIIlowCD34+Flt3+CD150−; Flt3−CD150− preGMs as Lin−Sca1−Kit+ FcγRII/IIIlowCD34+Flt3−CD150−, and preMegEs as Lin−Sca1−Kit+ FcγRII/IIIlowCD34+Flt3−CD150+. DN3 cells were sorted as Lin−Kit−CD25+ thymocytes. Purity of sorted BM populations is shown in supplemental Figure 1 (available on the Blood Web site see the Supplemental Materials link at the top of the online article). MPPs are efficient T-cell progenitors in vitro, and were used as controls. For some experiments, however, the more refined LMPP subset was used as it is enriched for cells expressing CCR9 that is implicated in progenitor homing to the thymus.9
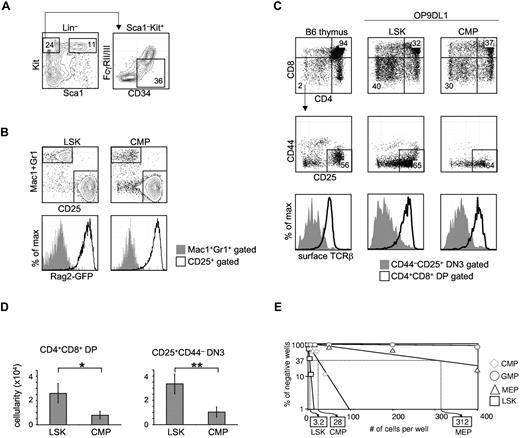
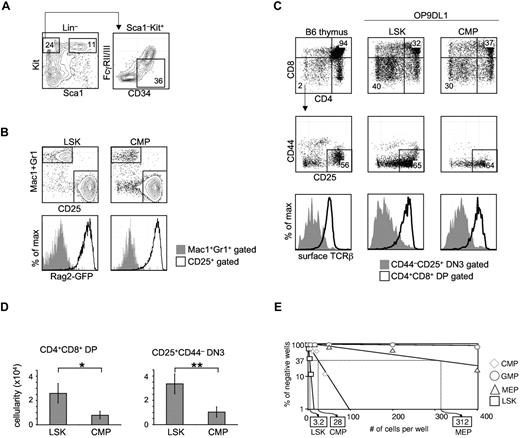
Total CMPs harbor in vitro T-lineage potential. (A) Traditional CMPs were identified and sorted by flow cytometry. BM from WT B6 mice was stained for Lin, Sca1, Kit, CD34, and FcγRII/III (CD16/32). CMPs were defined as Lin–Sca1–Kit+CD34+FcγRII/IIIlow.3 Multipotent LSK cells were sorted as Lin–Sca1+Kit+. (B) CMPs or LSK cells (300 cells) were sorted from the BM of NG-BAC mice, a Rag2-reporter strain, and cultured on OP9DL1 for 7 days, before flow cytometric analysis of Mac1/Gr1, CD25, and GFPRag2 expression. (C) FACS-sorted total CMPs (300 cells), along with LSK cells, from WT B6 BM were seeded onto OP9DL1 (or OP9DL4) stromal cells. The cocultures were passaged every 5-7 days. Live hematopoietic cells (DAPI–CD45+GFP– gated) deriving from LSK cells or CMPs on OP9DL1 after 28 days of coculture were assessed for T-lineage development based on CD4, CD8, CD25, CD44, and TCRβ expression. Normal B6 thymocytes were included as reference. Shown are representative results of at least 3 independent experiments. (D) Number of CD4+CD8+ DP and CD4–CD8–CD25+ DN3 cells obtained in experiments shown in panel C. *P = .04, **P = .01. Error bars denote SEM. P values were determined by Student t test. (E) CMPs, in addition to LSK cells, GMPs, and MEPs, were seeded on OP9DL4 at increasing numbers per well. LSK cells established a 1/3.2 T-lineage precursor frequency on OP9DL4, while the T-lineage precursor frequency from total CMPs registered at 1/28. No T-lineage precursor frequency could be determined for GMPs. Results shown are from 4 independent experiments.
Total CMPs harbor in vitro T-lineage potential. (A) Traditional CMPs were identified and sorted by flow cytometry. BM from WT B6 mice was stained for Lin, Sca1, Kit, CD34, and FcγRII/III (CD16/32). CMPs were defined as Lin–Sca1–Kit+CD34+FcγRII/IIIlow.3 Multipotent LSK cells were sorted as Lin–Sca1+Kit+. (B) CMPs or LSK cells (300 cells) were sorted from the BM of NG-BAC mice, a Rag2-reporter strain, and cultured on OP9DL1 for 7 days, before flow cytometric analysis of Mac1/Gr1, CD25, and GFPRag2 expression. (C) FACS-sorted total CMPs (300 cells), along with LSK cells, from WT B6 BM were seeded onto OP9DL1 (or OP9DL4) stromal cells. The cocultures were passaged every 5-7 days. Live hematopoietic cells (DAPI–CD45+GFP– gated) deriving from LSK cells or CMPs on OP9DL1 after 28 days of coculture were assessed for T-lineage development based on CD4, CD8, CD25, CD44, and TCRβ expression. Normal B6 thymocytes were included as reference. Shown are representative results of at least 3 independent experiments. (D) Number of CD4+CD8+ DP and CD4–CD8–CD25+ DN3 cells obtained in experiments shown in panel C. *P = .04, **P = .01. Error bars denote SEM. P values were determined by Student t test. (E) CMPs, in addition to LSK cells, GMPs, and MEPs, were seeded on OP9DL4 at increasing numbers per well. LSK cells established a 1/3.2 T-lineage precursor frequency on OP9DL4, while the T-lineage precursor frequency from total CMPs registered at 1/28. No T-lineage precursor frequency could be determined for GMPs. Results shown are from 4 independent experiments.
Intravenous and intrathymic transfers
Progenitors that were freshly sorted or from retroviral transduction culture were injected intravenously by the retro-orbital route into sublethally or lethally irradiated recipient mice (CD45SJL). Sublethal or lethal irradiation was carried out by exposing recipient mice to 500 rad or 900 rad of γ-irradiation, respectively, at least 4 hours before intravenous injections. In addition to donor cells, lethally irradiated recipient mice also received 2 × 10⁵ unfractionated BM cells (CD45SJL). For intrathymic transfer, freshly sorted BM progenitors (1000 cells) were injected intrathymically into sublethally irradiated (500 rad) anesthetized CD45SJL recipients.
Retroviral transduction of BM progenitors
Retroviral transduction of BM progenitors was done with Retronectin (Takara) according to manufacturer's instruction. Briefly, 40ug/mL of Retronectin was used to coat the tissue culture plate. To bind the virus onto Retronectin, the Retronectin-coated plate was added with retroviral supernatant and centrifuged for 2 hours at 32°C, 2000g. Various BM progenitors were sorted as described above, resuspended in the stimulation cocktail, and added onto retrovirus-bound plate. Transduced cells could be discerned within 24 hours by GFP expression. The stimulation cocktail was made by supplementing DMEM with Pen/Strep (1%), 15% FCS, 2mM l-glutamine, IL-3 (5 ng/mL), IL-6 (5 ng/mL), SCF (20 ng/mL), and Flt3-L (20 ng/mL). DMEM, Pen/Strep, and l-glutamine were purchased from Invitrogen and FCS from Hyclone. All cytokines were purchased from PeproTech.
OP9 cultures and single-cell cultures
OP9-GFP (OP9), OP9DL1, OP9DL4 cells were kindly provided by J. C. Zuniga-Pflucker (University of Toronto, ON) and used as described.8 Freshly sorted progenitors (300 cells) were seeded onto 12-well plates containing a confluent stromal monolayer in MEMα, supplemented with 20% FCS, IL-7 (1 ng/mL) and Flt3-L (5 ng/mL). MEMα was purchased from Invitrogen.
Single-cell culture was performed using the FACSAria to deposit single cells of Flt3+CD150– preGMs or MPPs onto OP9/OP9DL4 (mixed at 1:1 ratio) stromal cells and cultured for 10 days before FACS analysis. In addition to IL-7 and Flt3-L, cytokines, including IL-3, IL-6, SCF, G-CSF, M-CSF, and GM-CSF, were added to achieve a final concentration of 10 ng/mL for each. The survival rate for each progenitor population was determined in parallel to the single-cell assay. It was calculated by dividing the number of live cells remaining in identical in vitro cultures 24 hours after cell sorter-controlled deposition by the initial number of the progenitor cells that cell sorter had deposited in such cultures. Cloning efficiency in the single-cells assay for each progenitor was calculated by dividing the percentage of single-cell cultures that showed positive T lymphoid and/or myeloid development at the time of harvest by the survival rate.
Hematopoietic cells deriving from seeded progenitors were visualized as DAPI−GFP−CD45+. Cells in the myeloid lineage were Mac1+. Cells in B or T lineages could be distinguished by B220+CD19+ or CD25+Thy1+, respectively. Long-term culture of T lineage-potent progenitors on OP9DL1 or OP9DL4 would lead to generation of CD4+CD8+TCRβ+ DP cells.
Quantitative RT-PCR
RNA was purified with the RNEasy MicroKit (QIAGEN) and reverse transcribed to cDNA, using SuperScript II Kit (Invitrogen). Real-time PCR was performed with PCR Master Mix, using Taqman probes (Applied Biosystems) or oligonucleotide primers specific for indicated genes, and analyzed on ABI Prism 7900 system (Applied Biosystems). Relative transcript abundance was determined using the ΔΔCt method after normalization to housekeeping genes, such as 18S or HPRT1.
Histology study
Multiple organs, including lungs, spleens, livers, and bones, were harvested and fixed in 10% formalin (Sigma-Aldrich) and processed for H&E staining as previously described.12 The slides were visualized and recorded on a Leica DM5000B microscope (Leica) and captured with an Olympus DP72 camera and DP2-B5W computer software (Olympus).
Results
Total CMPs harbor in vitro T-lineage potential
CMPs were originally reported as progenitors outside of the LSK pool in BM with the surface phenotype of Lin–Sca1–Kit+CD34+FcγRlow (Figure 1A) that contain developmental potential for myeloid and erythroid lineage cells.3 To assess whether this population could give rise to lymphoid cells, CMPs and multipotent LSK cells were prospectively sorted from the BM of Rag2-reporter NG-BAC mice,13 and seeded onto OP9DL1 (and OP9DL4, data not shown). Both LSK cells and CMPs gave rise to 2 populations that could be discriminated by Mac1/Gr1 and CD25 expression. Whereas Mac1+Gr1+ cells remained GFP–, CD25+ cells derived from either LSK cells or CMPs were GFP+, indicating Rag2 expression in the CD25+GFP+ CMP-derived cells (Figure 1B). We next sought to determine whether CMPs could generate T lymphoid lineage cells expressing TCR by coculturing CMPs or LSK cells on OP9DL1 for 28 days. CMPs were able to give rise to both CD4–CD8–CD25+ double-negative 3 (DN3) and CD4+CD8+ double-positive (DP) cells, albeit in lower numbers than were obtained from culture with LSK cells (Figure 1C-D, *P = .04, **P = .01). As expected, we detected surface TCRβ on DP cells derived from CMPs (Figure 1C), indicating these cells were bona fide T-lineage cells. We next performed limiting dilution assays (LDA) to assess the T-lineage precursor frequency within each myeloid/erythroid progenitor population, as well as the multipotent LSK population. In this in vitro assay, total CMPs registered a T-lineage precursor frequency of 1/28, ∼ 10-fold lower than that from LSK cells, from which ∼ 1/3.2 cells gave rise to T-lineage progeny (Figure 1E). No T-lineage precursors could be detected within GMPs. The T-lineage precursor frequency found in the sorted MEP pool was 1/312, ∼ 100-fold lower than LSK cells. We could not exclude contamination with MPPs as an explanation for this very low frequency of T-cell progenitors and we did not further pursue it.
T-lineage potential is confined to the Flt3+CD150– preGM subset within CMPs
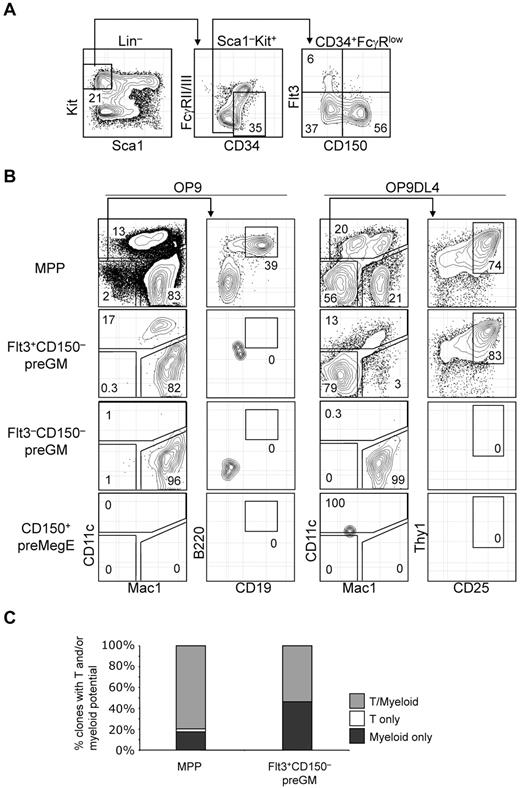
A recent report suggested that CMPs are heterogeneous and can be further subdivided based on CD150 expression, where CD150+ CMPs (preMegE) and CD150– CMPs (preGM) preferentially give rise to erythroid and myeloid lineages, respectively.7,14 We found that the CD150– preGM pool could be further subdivided into Flt3+CD150– and Flt3–CD150– preGMs. Flt3+CD150– preGMs constitute a small percentage (5%-15%) of the total CMP pool (Figure 2A). An Ikaros-reporter mouse strain has been used to discriminate committed erythroid progenitors,6 and we compared the Ikaros1 expression levels in Flt3+CD150– preGMs and Flt3–CD150– preGMs to other progenitors (supplemental Figure 2). Interestingly we found Ikaros1 expression in both Flt3+CD150– preGMs and Flt3–CD150– preGMs whereas MEPs lacked Ikaros1 expression (supplemental Figure 2).5 Thus, Flt3+CD150– preGMs may fall within the Lin–Sca1–Kit+GFPIkaros+ pool in the Ikaros-reporter strain.5,6
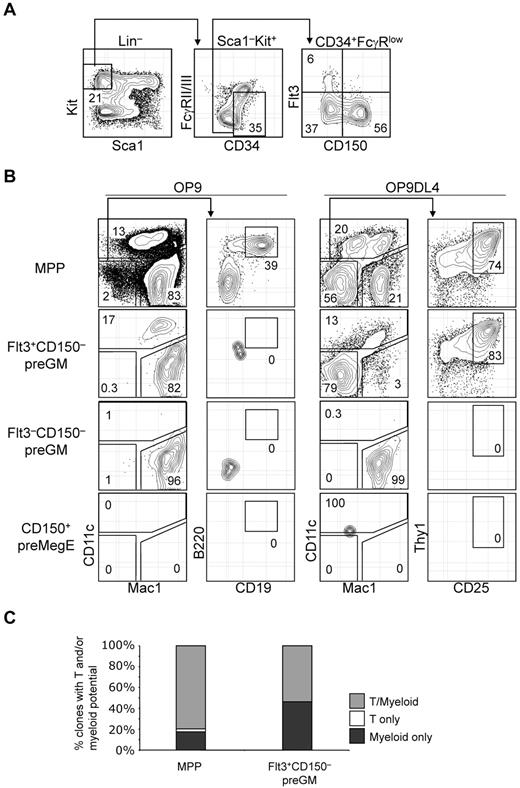
T-lineage potential is confined specifically in the Flt3+CD150– preGM subset of CMPs. (A) Previously described CMPs can be further subdivided into 3 populations based on additional Flt3 and CD150 expression. (B) Three subsets of CMPs, along with MPPs, were double FACS-sorted, seeded at equal number (300 cells per well), and cultured on OP9 or OP9DL4 for 10 days to assess the DC, myeloid, B, and T-lineage potentials. DC and myeloid lineages were identified based on CD11c and Mac1 expression, respectively, and both lineages could be readily detected from MPPs and Flt3+CD150– preGMs that were cocultured on OP9 or OP9DL4. B-lineage progeny was identified as Mac1–CD11c–CD19+B220+ cells, whereas T-lineage cells were Mac1–CD11c–CD25+Thy1+. Of 4 populations of progenitors tested here, only MPPs could generate B cells and T cells on OP9 and OP9DL4, respectively. No B-lineage precursor activity could be detected in Flt3+CD150– preGMs, although they could give rise to T cells on OP9DL4. Flt3–CD150– preGMs appeared myeloid restricted, as they only give rise to Mac1+ myeloid cells exclusively but no other lineages on OP9 and OP9DL4. CD150+ preMegEs did not give rise to lymphoid or myeloid cells. (C) More than half of Flt3+CD150– preGM progenitors are T/myeloid bi-potent. Single cells of Flt3+CD150– preGMs or MPPs were deposited by FACSAria sorter onto mixed OP9/OP9DL4 stromal cells and cultured in the presence of additional cytokines (see “OP9 cultures and single-cell cultures”) for 10 days before they were analyzed for myeloid (Mac1) or T-lineage (CD25 or Thy1) development. 147 clones of MPPs and 162 clones of Flt3+CD150– preGMs were analyzed with 88% and 85% cloning efficiency, respectively. Derivation of cloning efficiency for the single-cell assay is detailed in “Methods.” Results shown are from at least 3 independent experiments and single-cell culture results are from 2 independent experiments.
T-lineage potential is confined specifically in the Flt3+CD150– preGM subset of CMPs. (A) Previously described CMPs can be further subdivided into 3 populations based on additional Flt3 and CD150 expression. (B) Three subsets of CMPs, along with MPPs, were double FACS-sorted, seeded at equal number (300 cells per well), and cultured on OP9 or OP9DL4 for 10 days to assess the DC, myeloid, B, and T-lineage potentials. DC and myeloid lineages were identified based on CD11c and Mac1 expression, respectively, and both lineages could be readily detected from MPPs and Flt3+CD150– preGMs that were cocultured on OP9 or OP9DL4. B-lineage progeny was identified as Mac1–CD11c–CD19+B220+ cells, whereas T-lineage cells were Mac1–CD11c–CD25+Thy1+. Of 4 populations of progenitors tested here, only MPPs could generate B cells and T cells on OP9 and OP9DL4, respectively. No B-lineage precursor activity could be detected in Flt3+CD150– preGMs, although they could give rise to T cells on OP9DL4. Flt3–CD150– preGMs appeared myeloid restricted, as they only give rise to Mac1+ myeloid cells exclusively but no other lineages on OP9 and OP9DL4. CD150+ preMegEs did not give rise to lymphoid or myeloid cells. (C) More than half of Flt3+CD150– preGM progenitors are T/myeloid bi-potent. Single cells of Flt3+CD150– preGMs or MPPs were deposited by FACSAria sorter onto mixed OP9/OP9DL4 stromal cells and cultured in the presence of additional cytokines (see “OP9 cultures and single-cell cultures”) for 10 days before they were analyzed for myeloid (Mac1) or T-lineage (CD25 or Thy1) development. 147 clones of MPPs and 162 clones of Flt3+CD150– preGMs were analyzed with 88% and 85% cloning efficiency, respectively. Derivation of cloning efficiency for the single-cell assay is detailed in “Methods.” Results shown are from at least 3 independent experiments and single-cell culture results are from 2 independent experiments.
In vitro OP9 and OP9DL4 assays were performed to assess the T, B, myeloid, and DC lineage potential among Flt3+CD150– preGM, Flt3–CD150– preGM, and CD150+ preMegE cells. MPPs were able to give rise to DCs (CD11c+), myeloid (Mac1+), B lymphoid (CD19+B220+ on OP9), and T lymphoid (CD25+Thy1+ on OP9DL4) cells, consistent with the known multiple lineage potentials within this progenitor population (Figure 2B).15 In line with previous publications that the DC precursor activity is contained within Flt3-expessing CMPs,16 Flt3+CD150– preGMs were able to generate DCs, in addition to myeloid cells. T-lineage precursor activity, but not B lineage, was found in Flt3+CD150– preGMs, suggesting that, at the population level, Flt3+CD150− preGMs are T/myeloid bipotent progenitors. Although they lacked detectable surface IL-7Rα when initially isolated, Flt3+CD150– preGMs gave rise to T cells in an IL-7–dosage dependent manner and their progeny expressed IL-7Rα (supplemental Figure 3). The absence of B cell progeny indicates minimal, if any, contamination with MPPs in the sorted Flt3+CD150– preGM population. Flt3–CD150– preGMs were able to give rise to myeloid cells in both OP9 and OP9DL4 culture, but could not give rise to DC, T cells, or B cells, thus appearing to be truly myeloid-restricted. In addition, unlike MPPs and Flt3+CD150– preGMs, Flt3–CD150– preGMs failed to up-regulate a Notch1 target gene, Deltex1,17 when cultured on OP9DL4 (supplemental Figure 4). The failure of Flt3–CD150– preGMs to generate T cells on OP9DL4 was unlikely to be because of insufficient culture time, as at the time of analysis all Flt3–CD150– preGM-derived cells were Mac1+ (Figure 2B). Consistent with prior publications,7,14 no myeloid, DCs, or lymphoid precursor activity could be detected in CD150+ preMegE cells (Figure 2B). Flt3+CD150– preGMs generated more T cells on OP9DL4 than total unfractionated CMPs (supplemental Figure 5), further supporting the idea that the in vitro T-lineage potential of total CMPs derived entirely from the Flt3+CD150− preGM subset.
We next sought to determine whether the T and myeloid progeny originated from the same cells within Flt3+CD150– preGM progenitors. Single cells from Flt3+CD150– preGMs, as well as MPPs, were sorted and deposited on mixed OP9/OP9DL4 stromal cells and were cultured for 10 days before being analyzed for T and myeloid lineage development. We found that there were a small percentage of clones in MPPs that remained either T or myeloid restricted, but the majority of MPPs (∼ 80%) were T/myeloid bipotent. Approximately half of Flt3+CD150– preGMs (53.7%) were T/myeloid bipotent whereas the remaining half (46.3%) of Flt3+CD150– preGMs were myeloid-restricted, suggesting there might be further heterogeneity within this population (Figure 2C).
Flt3+CD150– preGMs are inefficient T-lineage progenitors
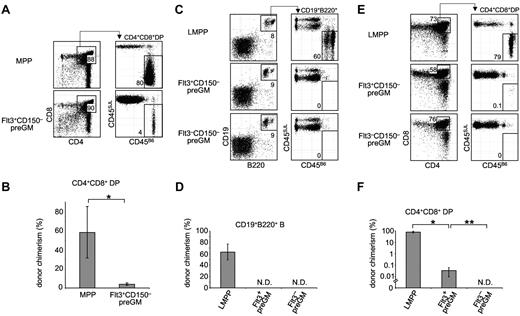
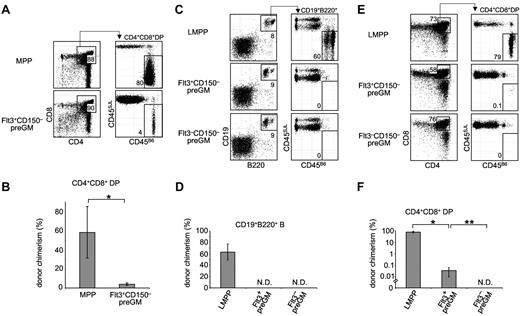
As Flt3+CD150– preGMs were able to generate T cells in vitro on OP9DL4 (and OP9DL1, data not shown), we next asked whether they were able to give rise to T cells in vivo. Thus, we performed intrathymic transfer of Flt3+CD150– preGMs to assess their capacity to generate T cells in the thymus, and compared their T cell potential to a known T-potent MPP population. Donor and host cells could be distinguished based on congenic CD45 alleles. 3 weeks after intrathymic transfer, MPP-derived donor cells (CD45B6) made up the majority of the DP thymocytes in recipients (Figure 3A-B). Although Flt3+CD150– preGM-derived donor cells could be detected, the chimerism in DP thymocytes was ∼ 14 -fold lower, compared with MPPs (P = .01). The T-cell potential of Flt3+CD150– preGMs did not greatly alter with age, as progenitors isolated from 3-week old mice or 28-week old mice demonstrated similar donor chimerism after intrathymic transfer (supplemental Figure 6). Flt3–CD150− preGMs failed to give rise to T cells after intrathymic transfer (data not shown).
Flt3+CD150– preGMs are T lineage-potent, but inefficient T progenitors. (A) Flt3+CD150– preGMs or MPPs were sorted from WT B6 BM (CD45B6) and intrathymically transferred at 1000 cells per mouse into sublethally irradiated congenic recipients (CD45SJL). Recipient thymi were analyzed 3 weeks after transfer for donor chimerism at the DP stage. n = 4. (B) Graphic representations of donor chimerism after intrathymic transfer of MPPs or Flt3+CD150– preGMs. *P = .01. (C) Flt3+CD150– preGM (1000 cells), Flt3–CD150– preGMs (10 000 cells), and LMPPs (1000 Flt3hi LSK cells) were sorted from WT B6 BM (CD45B6) and intravenously transferred into sublethally irradiated congenic recipients (CD45SJL). BM of recipient mice was analyzed on day 18 after transfer for donor chimerism in the B cell lineage (CD19+B220+). n = 4-5. (D) Donor chimerism in the B cell lineage after intravenous transfer of LMPPs, Flt3+CD150– preGMs, and Flt3–CD150– preGMs. N.D. indicates not detected. (E) Thymi of the same recipient mice that received intratransfer of LMPPs, Flt3+CD150– preGMs, and Flt3–CD150– preGMs were analyzed for donor chimerism at the DP stage on day 18 after transfer. (F) Donor chimerism at the DP stage after intravenous transfer of LMPPs, Flt3+CD150– preGMs, and Flt3–CD150– preGMs. N.D. indicates not detected. *P = 2 × 10⁻⁶ and **P = .01. P values were determined by Student t test. Error bars denote SEM. Results shown are from 2 independent experiments.
Flt3+CD150– preGMs are T lineage-potent, but inefficient T progenitors. (A) Flt3+CD150– preGMs or MPPs were sorted from WT B6 BM (CD45B6) and intrathymically transferred at 1000 cells per mouse into sublethally irradiated congenic recipients (CD45SJL). Recipient thymi were analyzed 3 weeks after transfer for donor chimerism at the DP stage. n = 4. (B) Graphic representations of donor chimerism after intrathymic transfer of MPPs or Flt3+CD150– preGMs. *P = .01. (C) Flt3+CD150– preGM (1000 cells), Flt3–CD150– preGMs (10 000 cells), and LMPPs (1000 Flt3hi LSK cells) were sorted from WT B6 BM (CD45B6) and intravenously transferred into sublethally irradiated congenic recipients (CD45SJL). BM of recipient mice was analyzed on day 18 after transfer for donor chimerism in the B cell lineage (CD19+B220+). n = 4-5. (D) Donor chimerism in the B cell lineage after intravenous transfer of LMPPs, Flt3+CD150– preGMs, and Flt3–CD150– preGMs. N.D. indicates not detected. (E) Thymi of the same recipient mice that received intratransfer of LMPPs, Flt3+CD150– preGMs, and Flt3–CD150– preGMs were analyzed for donor chimerism at the DP stage on day 18 after transfer. (F) Donor chimerism at the DP stage after intravenous transfer of LMPPs, Flt3+CD150– preGMs, and Flt3–CD150– preGMs. N.D. indicates not detected. *P = 2 × 10⁻⁶ and **P = .01. P values were determined by Student t test. Error bars denote SEM. Results shown are from 2 independent experiments.
As shown in Figure 3, Flt3+CD150– preGMs were able to generate up to 4% donor chimerism in the DP population after intrathymic transfer. Although this is lower than the degree of chimerism from MPPs, the T-cell potential of other lymphocyte progenitors such as CLPs is similarly considerably less than that of MPPs when assessed by direct intrathymic injection.9,18 In addition to the ability to generate T cells when placed in a T lineage–permissive environment, such as the thymus, efficient T-lineage progenitors must also possess the ability to migrate to the thymus.9-11 To address this requirement, Flt3+CD150– preGMs, along with Flt3–CD150– preGMs and LMPPs (lymphoid-primed MPPs), were transferred intravenously into sublethally irradiated recipients. LMPPs were included for comparison, as these are the Flt3-brightest subset of MPPs that are known to express lymphoid-related genes, such as Rag1 and Rag2.15,19 Furthermore, the LMPP progenitor pool contains cells that highly express CCR9, a chemokine receptor critically implicated in the homing of lymphoid progenitors to the thymus.9,20 After intravenous transfer into irradiated recipient mice, LMPPs gave rise to substantial numbers of B cells outside the thymus. Both Flt3+CD150– and Flt3–CD150– preGMs failed to generate any B cells in BM, consistent with the in vitro observation that both groups of progenitors lack detectable B-lineage potential (Figures 3C-D and 2B). When the recipient thymi were analyzed, high donor-chimerism was observed in recipient mice that received LMPPs, consistent with the known capacity of these progenitors to home to the thymus and reconstitute thymopoiesis.9,20 In contrast, intravenous transfer of the same number of Flt3+CD150– preGMs resulted in very low donor-chimerism at the CD4+CD8+ DP stage (Figure 3E-F, *P = 2 × 10⁻⁶). No donor-derived T cells were detected in recipient mice that received Flt3–CD150– preGMs even when we transferred 10 times as many of these progenitors as Flt3+CD150– preGMs (Figure 3E-F, **P = .01). The inability of Flt3+CD150– preGMs and Flt3–CD150– preGMs to reconstitute B and T lymphoid lineages after intravenous transfer is not because of their failure to engraft in the recipient mice. This is evidenced by the transient reconstitution in myeloid and DC lineages by Flt3+CD150– preGMs,16 and in the myeloid lineage by Flt3−CD150− preGMs,7 which was detected at earlier time points after intravenous transfer (supplemental Figure 7). Together, these data suggested that Flt3+CD150– preGMs lacked detectable B-lineage potential but possessed T-lineage potential. However, after intravenous transfer into irradiated mice they could not efficiently home to the thymus for T-lineage differentiation. Further, they did not appear to generate substantial numbers of downstream progeny with thymic homing ability, such as is seen when HSC or MPP are injected intravenously.9,21
Flt3+CD150– preGMs express genes important for T- and myeloid-lineage development
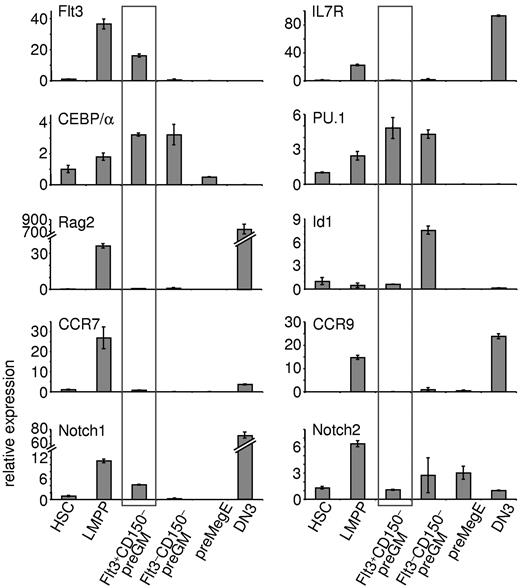
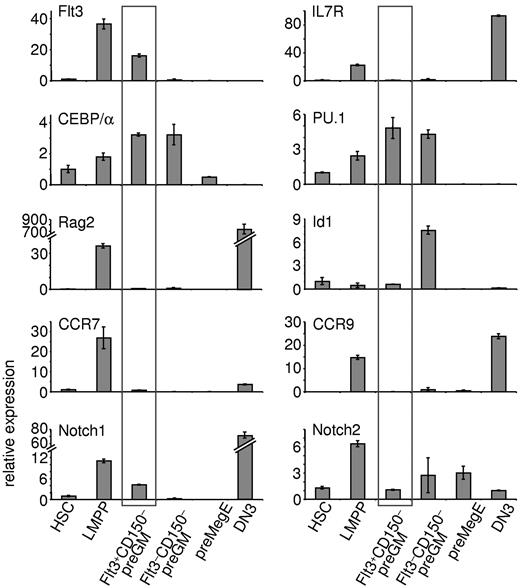
Real-time qPCR was performed to further characterize Flt3+CD150– preGMs (Figure 4). As expected, LMPPs express lymphoid-related genes, such as Flt3, IL7R, and Rag2. Flt3+CD150– preGMs lacked expression of IL7R and Rag2, but expressed increased levels of CEBP/α and PU.1 (Sfpi-1), 2 genes implicated in myeloid differentiation.22,23 Expression of Id1 is known to be up-regulated in GMPs24 ; consistently, we found up-regulated expression of Id1 in Flt3–CD150– preGMs. preGM cells have also been previously reported to express Notch17 ; we found Notch1 transcripts largely restricted to the Flt3+CD150– preGM subset. This is consistent with the observation that only Flt3+CD150– preGMs, but not Flt3–CD150– preGMs or preMegEs, were able to give rise to T cells on OP9DL4 (Figure 2B), as Notch1 signaling is essential for T-lineage development.7,25 Expression of Hes1, a known Notch1 target,26 was not detected in these 3 CMP subsets (data not shown) and similar expression profiles of Flt3, IL7Rα, Notch1, and PU.1 among these progenitors was observed when a different housekeeping gene was used (supplemental Figure 8).
Flt3+CD150– preGMs express genes important in T and myeloid lineage development. Three subsets of CMPs, along with HSCs, LMPPs, and DN3 cells, were purified from B6 BM and thymus. RNA from each population was reverse transcribed and used for real-time qPCR. Shown is the relative expression of indicated genes in each population after normalized to 18S RNA. HSCs were sorted as Flt3–CD150+ LSK cells and LMPPs as Flt3hiCD150– LSK cells from B6 BM. DN3 cells were sorted as Lin–Kit–CD25+ thymocytes. Error bars denote SEM. Results shown are from at least 3 independent experiments.
Flt3+CD150– preGMs express genes important in T and myeloid lineage development. Three subsets of CMPs, along with HSCs, LMPPs, and DN3 cells, were purified from B6 BM and thymus. RNA from each population was reverse transcribed and used for real-time qPCR. Shown is the relative expression of indicated genes in each population after normalized to 18S RNA. HSCs were sorted as Flt3–CD150+ LSK cells and LMPPs as Flt3hiCD150– LSK cells from B6 BM. DN3 cells were sorted as Lin–Kit–CD25+ thymocytes. Error bars denote SEM. Results shown are from at least 3 independent experiments.
Recently, CCR7, in addition to CCR9, was reported as a critical receptor expressed by BM progenitors that home to the thymus.10,11 In line with this observation, both CCR7 and CCR9 were found to be expressed in LMPPs. Flt3+CD150– preGMs, on the other hand, expressed very low or undetectable levels of CCR7 and CCR9, further suggesting that Flt3+CD150– preGMs, though T lineage-potent, are unlikely to substantially contribute to steady state thymopoiesis.
Flt3+CD150– preGMs and Flt3–CD150– preGMs are susceptible to Notch1-mediated T-ALL oncogenesis
Overexpression via retroviral transduction of the intracellular domain of Notch1 (ICN1) confers constitutively active Notch1 signaling and has been shown to be sufficient to cause extrathymic T-lineage development.27 Furthermore, mice that received ICN1-transduced BM cells developed T-ALL, making this ICN1 retrovirus an attractive model to study T-ALL oncogenesis.12
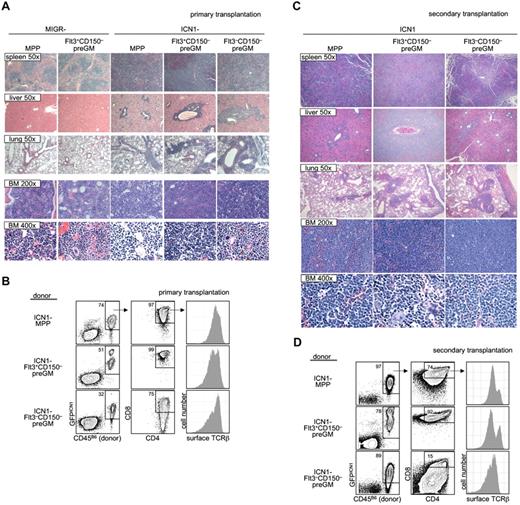
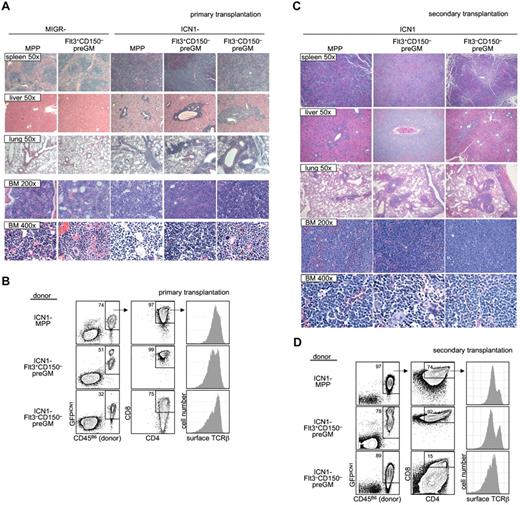
As it is suggested that T-ALL in humans arises from T lymphoid progenitors,28 we decided to investigate whether preGM myeloid progenitors were able to lead to T-ALL when given constitutively active Notch1 signaling. Both preGM populations (Flt3+CD150– preGMs and Flt3–CD150– preGMs), along with MPPs (CD45B6), were sorted and transduced with empty vector MIGR or ICN1 before being intravenously transferred into sublethally irradiated mice (CD45SJL). Mice receiving empty vector MIGR-transduced progenitors did not develop T-ALL, as expected. We found that mice that received ICN1-transduced MPPs and Flt3+CD150– preGMs showed symptoms and signs suggestive of T-ALL (body wasting and cachexia with peripheral WBC count > 15 × 106 per mL) within a similar time frame (supplemental Figure 9).12 Mice that received ICN1-transduced Flt3–CD150– preGMs also developed T-ALL. Histologic analysis of these mice demonstrated lymphocytic infiltration in the spleen, livers, and lungs of mice transplanted with ICN1-transduced MPPs, Flt3+CD150– preGMs, and Flt3–CD150– preGMs. Concomitantly, neutrophil development was markedly reduced in BM (Figure 5A). By flow cytometry, the majority of donor-derived cells in the BM of these mice were GFPICN1+ CD4+CD8+, and surface TCRβ+, consistent with the T-ALL presentation (Figure 5B).12,27,29 We performed secondary transplantation by intravenously transferring BM cells from these recipient mice into new sublethally irradiated hosts (CD45SJL). These secondary transplanted mice exhibited a more rapid onset of cachexia than the primary recipients (disease state shown within 3 weeks after transfer) and were thus killed for histologic and flow cytometry studies. Again, we found that multiple organs, including spleens, livers, and lungs, from these mice were infiltrated by lymphocytes. The histologic study again demonstrated minimal neutrophil development and the presence of cells with atypical morphology in the BM of secondary transplanted mice (Figure 5C). FACS analysis showed that the majority of cells in the BM were donor-derived and GFPICN1+. These donor-derived cells expressed CD4, CD8, and surface TCRβ (Figure 5D), thus demonstrating the diseased phenotypes observed in the primary recipients were transferable to new hosts.
Flt3+CD150– preGMs are susceptible to ICN1-medated T-ALL. Flt3+CD150–, Flt3–CD150– preGMs, and MPPs were sorted from WT B6 BM (CD45B6) and transduced with either control-MIGR or ICN1-MIGR retrovirus for 2 days. Live transduced GFP+ cells (5000) from each group of cells were intravenously transferred into sublethally irradiated recipients (CD45SJL). Recipient mice were assessed regularly for signs of cachexia. (A) Cachectic mice with peripheral WBC count > 5 × 10⁶/mL were promptly killed and various organs were harvested and prepared for histology study. Shown are representative H&E staining of spleen, liver, lung, and BM from mice that received empty MIGR-transduced MPPs and Flt3+CD150− and ICN1-transduced MPPs, Flt3+CD150−, and Flt3−CD150−. Magnification is as indicated. (B) BM cells (5 × 10⁵) from mice that received ICN1-transduced progenitors in panel A were intravenously transferred to sublethally irradiated secondary recipients (CD45SJL). Shown are representative flow cytometry analysis of primary BM cells used in transfer. (C) The secondary recipient mice were monitored for signs of cachexia. Cachectic mice were killed. Shown are representative H&E staining of spleen, liver, lung, and BM from secondary mice that received BM cells from panel B. Magnification is as indicated. (D) Flow cytometric analysis of BM cells from secondarily transplanted mice that received BM from panel B. Results shown are from 2 independent experiments. n = 4-5.
Flt3+CD150– preGMs are susceptible to ICN1-medated T-ALL. Flt3+CD150–, Flt3–CD150– preGMs, and MPPs were sorted from WT B6 BM (CD45B6) and transduced with either control-MIGR or ICN1-MIGR retrovirus for 2 days. Live transduced GFP+ cells (5000) from each group of cells were intravenously transferred into sublethally irradiated recipients (CD45SJL). Recipient mice were assessed regularly for signs of cachexia. (A) Cachectic mice with peripheral WBC count > 5 × 10⁶/mL were promptly killed and various organs were harvested and prepared for histology study. Shown are representative H&E staining of spleen, liver, lung, and BM from mice that received empty MIGR-transduced MPPs and Flt3+CD150− and ICN1-transduced MPPs, Flt3+CD150−, and Flt3−CD150−. Magnification is as indicated. (B) BM cells (5 × 10⁵) from mice that received ICN1-transduced progenitors in panel A were intravenously transferred to sublethally irradiated secondary recipients (CD45SJL). Shown are representative flow cytometry analysis of primary BM cells used in transfer. (C) The secondary recipient mice were monitored for signs of cachexia. Cachectic mice were killed. Shown are representative H&E staining of spleen, liver, lung, and BM from secondary mice that received BM cells from panel B. Magnification is as indicated. (D) Flow cytometric analysis of BM cells from secondarily transplanted mice that received BM from panel B. Results shown are from 2 independent experiments. n = 4-5.
Together, these results demonstrated that, similar to MPPs, Flt3+CD150– preGMs, when forced with constitutively active Notch1 signaling, could develop into T-ALL. Interestingly, Flt3–CD150– preGMs, a population of myeloid progenitors that lack detectable T-lymphoid developmental potential, could also cause T-ALL when transduced with ICN1.
Discussion
CMPs were initially identified as a group of progenitors residing within the Lin−Sca1−Kit+ BM cells that appeared to be restricted to the myeloerythroid lineage.3 Downstream of CMPs, GMPs and MEPs were described to be further restricted to the myeloid and erythroid lineages, respectively.3 However, with the creation of different reporter mouse strains and additional surface markers, refinement and revision have been made to this model.30 The Ikaros-reporter strain was used to demonstrate that expression both myeloid and lymphoid genes can be detected in the majority of the Ikaros-expressing myeloid progenitors (Lin−Sca1−Kit+GFPIkaros+). Furthermore, these progenitors harbor T, B, and myeloid precursor activity.6 However, it was not clear whether this BM population contains multipotent progenitors or there exists heterogeneity with subsets of progenitors possessing different lineage potential.
In this report, we were able to demonstrate the presence of T-lineage potential in myeloid progenitors of normal mice. In particular, the T-lineage potential was specifically found in the Flt3+CD150– preGM subset of CMPs, traditionally defined as Lin−Sca1−Kit+CD34+FcγRlow BM cells.3 Flt3+CD150– preGMs constitute a small portion of total CMPs (5%-15%), which might explain the apparent lack of T lymphoid potential when CMPs were first identified. However, if further purified from the total CMP pool, Flt3+CD150– preGMs were able to generate low, but detectable, number of T cells when placed in the thymus. We further showed that approximately half of these progenitors were T and myeloid potent at the clonal level. Our results confirm and extend the observation made with the Lin–Sca1–Kit+GFPIkaros+ myeloid progenitors, as the precursor frequency established by LDA in that report for B lineage was much lower than that for T and myeloid lineage.6
Cells with Flt3+CD150– preGM phenotype are present in blood31 (and data not shown) and so have access to the thymus. Yet, Flt3+CD150– preGMs expressed very low or undetectable CCR7 and CCR9; 2 chemokine receptors that are critical for BM progenitors to home to the thymus (Figure 4).9-11 Therefore, Flt3+CD150– preGMs do not likely contribute to thymopoiesis under normal physiologic conditions. Flt3+CD150– preGMs are another example of BM progenitors, similar to HSCs, that are T-potent but lack thymic homing molecule expression.9 In contrast, thymic homing molecules, such as CCR7 and CCR9, are expressed on CLPs and LMPPs, which allows these progenitors to traffic to the thymus and give rise to T cells.10,11 Therefore, while several BM progenitors are T potent, thymic homing appears to be the critical factor in determining whether its T-lineage potential will be realized physiologically in vivo.
Recently, most early thymic progenitors (ETPs), which are considered as the canonical T-lineage progenitors in the thymus, have been found to be T and myeloid potent at the clonogenic level.32,33 However, most ETPs are devoid of B potential.34-36 Thus, very similar to Flt3+CD150– preGMs, these ETPs represent a developmental stage that is equipped with T/myeloid potential but has lost B lymphoid potential. The mechanisms leading to the loss of B lymphoid potential in the thymus during T-lineage development and in the BM during myeloid development might be different and await further investigation.
As multipotent HSCs or MPPs differentiate to downstream progenitors, expression of transcription factors critical for certain lineages must be augmented while expression of other transcription factors must be attenuated or terminated. These 2 processes are very unlikely to happen simultaneously and abruptly. Thus the existence of progenitors with mixed lineage potentials is predicted.37-39 Indeed, it appears that many lymphoid progenitors still retain myeloid potential. For example, some cells within previously defined common lymphoid progenitors (CLPs)40 were found to possess myeloid potential.41-44 In addition, as mentioned above, myeloid potential could be readily revealed in ETPs.32,33,36 It was recently found that human lymphoid progenitors also harbored myeloid and DC potentials,45 and GMPs isolated from human cord blood also contained substantial T-lineage potential.45 In this report we were able to use additional surface markers to further refine a small subset of adult BM myeloid progenitors in normal B6 mice that contain T lymphoid potential. In agreement with this myeloid/T lymphoid bipotency, gene expression profiling of Flt3+CD150– preGMs revealed expression of genes involved in both myeloid and T lymphoid lineages (Figure 4).
T-ALL represents ∼ 15% and 25% of newly diagnosed acute lymphoblastic leukemia cases in children and adults, respectively.28 The role of Notch1 in T cell leukemia has been under intense investigation, because gain-of-function mutations of Notch1 have been reported in the majority of T-ALL patients.28,46 Forced constitutively active Notch1 signaling via retroviral transduction of MIGR-ICN1 in BM progenitors has been shown to consistently lead to T-ALL oncogenesis.12,27 The identities of cell types which transform into T-ALL cells have not been investigated. It has been suggested that T-ALL arose from T-lineage progenitors,28 including MPPs and/or CLPs. While this is supported by the observation that intravenous transfer of MPPs transduced with MIGR-ICN1 retrovirus resulted in T-ALL in recipient mice (Figure 5), we demonstrated here that MIGR-ICN1 transduced Flt3+CD150– preGMs could also generate T-ALL in vivo. Furthermore, other myeloid progenitors, such as Flt3–CD150– preGMs that lack detectable T-lineage potential were also susceptible to ICN1-induced T-ALL transformation. Hence susceptibility to Notch-mediated oncogenesis extends to progenitor populations that are not traditional T cell progenitors, and raises the possibility that T-ALL oncogenesis could also arise from mutations of Notch1 in conventional myeloid progenitors. It is interesting that while no T lymphoid potential was detected in Flt3–CD150– preGMs, these myeloid progenitors could still be responsive to forced Notch1 signaling. These results suggest that loss of T lymphoid potential in Flt3–CD150– preGMs could be attributed in part to down-regulation of Notch1 expression (Figure 4). However, additional mechanisms are possible and remain to be investigated.
It is known that after puberty the human thymus undergoes involution, which is accompanied by the steady decrease of thymic output of T lymphocytes.47,48 Many efforts have been made to boost thymopoiesis or to develop therapeutic interventions to generate T cells in vitro from BM progenitors.49,50 This report showed a very refined myeloid progenitor population in mouse BM that lacks B lymphoid potential but could readily generate bona fide T cells after transfer to a T-cell biased environment, such as OP9DL coculture or intrathymic transplantation. Our finding therefore provides an additional source of BM progenitors outside the traditional lymphoid progenitor pool that also possesses T-lineage potential and might be used to generate T cells ex vivo.
The online version of this article contains a data supplement.
The publication costs of this article were defrayed in part by page charge payment. Therefore, and solely to indicate this fact, this article is hereby marked “advertisement” in accordance with 18 USC section 1734.
Acknowledgments
The authors thank Stephanie Cross, Amar Majmundar, and Vijay Dondetic for their thoughtful critiques of the paper.
This work was supported by National Institute of Health grants RC1HL099758 and AJ059621 (A.B.), R01AI047833 (W.S.P.), T32-CA009140 (B.N.W.), and (A.W.S.C.), and by Australian National Health and Medical Research Project grant #559004 (D.I.).
National Institutes of Health
Authorship
Contribution: A.W.S.C. performed most of the experimental work with contributions from A.C., L.X., B.N.W., and O.S.; A.W.S.C., A.C., D.I., and A.B. together planned the project; A.W.S.C., A.S., G.W., W.S.P, D.I., and A.B. analyzed data; and A.W.S.C., D.I., and A.B. prepared the paper.
Conflict-of-interest disclosure: The authors declare no competing financial interests.
Correspondence: Dr David Izon, Haematology and Leukaemia Division, St Vincent's Institute, Fitzroy, Victoria 3065, Australia; e-mail: dizon@svi.edu.au; or Dr Avinash Bhandoola, Department of Pathology and Laboratory Medicine, 264/266 John Morgan Bldg, 37th and Hamilton Walk, University of Pennsylvania School of Medicine, Philadelphia, PA 19104; e-mail: bhandooa@mail.med.upenn.edu.

