Abstract
Natural killer (NK) cells help protect the host against viral infections and tumors. NKG2D is a vital activating receptor, also expressed on subsets of T cells, whose ligands are up-regulated by cells in stress. Ligation of NKG2D leads to phosphorylation of the associated DAP10 adaptor protein, thereby activating immune cells. Understanding how the expression of NKG2D-DAP10 is regulated has implications for immunotherapy. We show that IL-2 and TGF-β1 oppositely regulate NKG2D-DAP10 expression by NK cells. IL-2 stimulation increases NKG2D surface expression despite a decrease in NKG2D mRNA levels. Stimulation with IL-2 results in a small increase of DAP10 mRNA and a large up-regulation of DAP10 protein synthesis, indicating that IL-2–mediated effects are mostly posttranscriptional. Newly synthesized DAP10 undergoes glycosylation that is required for DAP10 association with NKG2D and stabilization of NKG2D expression. TGF-β1 has an opposite and dominant effect to IL-2. TGF-β1 treatment decreases DAP10, as its presence inhibits the association of RNA polymerase II with the DAP10 promoter, but not NKG2D mRNA levels. This leads to the down-regulation of DAP10 expression and, as a consequence, NKG2D protein as well. Finally, we show that other γc cytokines act similarly to IL-2 in up-regulating DAP10 expression and NKG2D-DAP10 surface expression.
Introduction
Natural killer (NK) cells are cytotoxic and cytokine-secreting lymphocytes that play a vital role in the immune response by helping protect the host against tumors and viral infections. NK cell functions are regulated by a large panel of germline-encoded inhibitory and activating receptors and their response to potential target cells is determined by the balance of inhibitory and activating signals that emanate from these receptors. All else being equal, signals from inhibitory receptors that recognize self-MHC class I molecules tend to over-ride activation signals and thereby protect healthy cells from NK cell aggression.
Several NK cell–activating receptors are thought to recognize induced-self ligands, that is, ligands that are up-regulated when cells transition from normal to cancerous, although few of these ligands have actually been identified.1 An important exception to this is the type II transmembrane-anchored C-type lectin-like receptor, NKG2D, that in humans recognizes MICA and -B, and several UL16-binding proteins.2,3 In humans, essentially all NK and CD8+ T cells and subsets of γδ and CD4+ T cells express NKG2D.1 NKG2D has no signaling motif in its short cytoplasmic tail, but associates with DAP10.1,4 The complex is expressed on the cell surface as an NKG2D dimer in association with 4 DAP10 subunits.5 The only known signaling motif in the cytoplasmic tail of DAP10 is a YINM motif, which when phosphorylated promotes recruitment of PI3K and the Grb2-Vav1-SOS1 complex.6,7 Little or no NKG2D surface expression appears to occur without coexpression of DAP10.8,9
NKG2D ligands tend to be up-regulated on stressed and/or rapidly proliferating cells, which includes tumor- and pathogen- infected cells.1 In vivo tumor transfer studies in mice showed that NKG2D expression on NK cells can mediate tumor clearance10 and animals treated with NKG2D-blocking Ab11 or lacking NKG2D have been shown to have defective tumor surveillance.12 On the other hand, expression of soluble NKG2D ligands by human tumors has been shown to promote tumor-immune evasion, and ectopic expression of NKG2D by some human tumors has been demonstrated to deliver activation signals.13 There is also ample evidence that NKG2D plays a critical role in regulating many types of viral infections.1 In the case of T cells, NKG2D costimulation can be harmful to the host in that it has been implicated in the pathogenesis of several autoimmune diseases. These include celiac disease,14 Crohn disease,15 rheumatoid arthritis16 and diabetes,17 presumably because the tissue inflammation associated with these diseases leads to the up-regulation of NKG2D ligands.15
Because the function of NKG2D-DAP10 is relevant both positively and negatively in many disease circumstances, understanding how its expression is regulated is not only of general biologic interest, but has clinical relevance. Development, survival, proliferation, and effector functions of NK cells are dependent on cytokines of the common γ chain (γc) family (namely IL-2, IL-7, IL-15, and IL-21).18-20 Of particular relevance is IL-2, not only because it mediates and potentiates NK-cell functions and interactions between NK and other immune cells (eg, T lymphocytes and DCs), as well as contributing to the homeostasis of mature NK cells,19,21 but IL-2 has been shown to greatly enhance the proliferation of NK cells both in vitro and in vivo.21,22 Consequently, NK cells cultured in vitro for immunotherapeutic infusion are expanded with IL-2.23-25 IL-2 has been reported to up-regulate NKG2D surface expression on primary NK cells,23,24,26 and IL-2–mediated induction of NKG2D expression on cultured NK cells correlates with enhanced NK-cell cytotoxicity.27 Another cytokine important for NK-cell activity is TGF-β1. Contrary to effects of IL-2, TGF-β1 can decrease the cell-surface expression of NKG2D28 ; indeed, TGF-β1 secreted by tumors appears to be one mechanism by which tumor cells evade NKG2D-DAP10–mediated cytotoxicity.29 However, exactly how IL-2 and TGF-β1 act to regulate NKG2D surface expression is poorly defined.
In this study, we investigated how IL-2 and TGF-β1 act to regulate NKG2D-DAP10 expression on primary human NK cells. We found that IL-2–mediated up-regulation of NKG2D surface expression correlated with marked increases in DAP10 and NKG2D protein expression without equivalent changes in transcript levels. We show that other γc cytokines (IL-7 and IL-15) act similarly to IL-2 in up-regulating NKG2D-DAP10 expression. TGF-β1 dominantly suppresses NKG2D-DAP10 surface expression, at least partially by interfering with DAP10 transcription. Finally, we show that NKG2D does not associate with newly synthesized DAP10, but that at least partial glycosylation is required. Our results highlight the complexity behind the regulation of the expression of the human NKG2D-DAP10 receptor.
Methods
Isolation and culture of human NK cells
Primary NK cells were isolated using EasySep NK cell isolation kits (StemCell Technologies) and were > 95% pure as assessed by staining for CD3 and CD56. Primary and human 293T cells were cultured in IMDM (Invitrogen) with 2mM GlutaMax and 10% human AB serum (NK cells) or FBS (293T cells). For cytokine stimulations, cells were stimulated with human IL-2 (500 or 1000 U/mL; amounts commonly used to culture primary NK cells30 ), IL-7 (Peprotech; 10 ng/mL), IL-15 (Peprotech; 10 ng/mL, to overcome the requirement for trans-presentation20 ), and/or 5 ng/mL TGF-β1 (R&D Systems) for 1 or 3 days. NKL cells were cultured in RPMI 1640 (Invitrogen) supplemented with 10% FBS and 100 U/mL of IL-2. For the IL-2 depletion experiments, NKL cells were washed 3 times with PBS and cultured 3 days in the absence of IL-2. For experiments involving inhibition of protein synthesis, primary NK cells were cultured in medium with or without IL-2 for 1 or 3 days and then treated with either vehicle (DMSO) or cycloheximide (CHX, Sigma-Aldrich; NK cells: 10 μg/mL, NKL: 50 μg/mL). For inhibition of O-glycosylation, NKL cells were treated with 5mM benzyl-α-GalNAC (Calbiochem) or vehicle (DMSO) for 1 or 2 days.
RNA isolation and quantitative real-time PCR
Total RNA was isolated using the Ambion RNAquous-4PCR kit. Complementary DNA was synthesized using a Qscript cDNA synthesis kit (Quanta Biosciences). Oligonucleotide primers for amplifying the human NKG2D and DAP10 were described previously26,31 and the primers for amplification of 18S rRNA and actin were purchased from QIAGEN and Sigma-Aldrich. Quantitative RT-PCR was performed using Roche Lightcycler 480 and analyzed using Lightcycler Version 1.5.0.39 software.
Flow cytometry
The NKG2D cell-surface expression was assessed by staining with PE-conjugated NKG2D antibody (R&D Systems, 149810) for 30 minutes on ice, followed by washing with PBS containing 0.05% FBS. PE-conjugated IgG κ (eBiosciences) mAb was used to monitor background staining levels. Data acquisition was performed on a FACSort cytometer and analysis was done using FlowJo Version 7.6.1 software.
Western blot analysis
Cells (2 × 10⁶) were lysed in ice-cold lysis buffer (50mM Tris-Cl pH7.4, 150mM NaCl, 2mM EDTA, 0.5% Triton-X-100 including protease inhibitor cocktail). For NKG2D Western blotting, lysates were precipitated with 10% TCA for 1 hour on ice and washed 3 times with acetone, then resuspended with NuPAGE LDS sample buffer (Invitrogen). For NKL cells, the cell lysates were incubated overnight at 4°C with either anti-NKG2D (clone 5C6, Santa Cruz Biotechnology) or control (cIgG, Abcam) antibody, followed by incubation with protein G beads. The beads were washed 4 times with lysis buffer and the proteins eluted with NuPAGE LDS sample buffer. Cell lysates or precipitates were separated by 4%-12% gradient NuPAGE (Invitrogen) or 10%-20% gradient PAGEr Gold Gels (Lonza). After transfer to PVDF membranes (Invitrogen), blots were incubated overnight (4°C) with anti-DAP10 (N-17, C-20, H-2 from Santa Cruz Biotechnology) or anti-NKG2D (ab36136 from Abcam; clone 3.1.1.1 from Millipore), followed by incubation with HRP-conjugated secondary antibody. The blots were developed using SuperSignal West Dura Extended Duration Substrate (Pierce Biotechnology). Sample loading was monitored by reprobing with anti–β-actin antibody (Sigma-Aldrich). The protein bands were quantified using Image J software (Version 1.44o). The integrated density of each band was measured using the gel analysis function of ImageJ, normalized to β-actin, and compared with the untreated sample (value = 1).
ChIP
ChIP experiments were performed using the EZ-ChIP assay kit (Millipore). Cross-linked chromatin was sheared by sonication to yield fragments with the average size range of 0.2-1 kb. Immunoprecipitation reactions were performed with 5 μg of anti-RNA Pol II (Milllipore) or 5 μg of control mouse IgG (SantaCruz Biotechnology). Enrichment of the DAP10 promoter in immunoprecipitated samples was assessed by real-time PCR. Details of the primer pairs and reaction conditions used to amplify the promoter region are found in supplemental Methods (available on the Blood Web site; see the Supplemental Materials link at the top of the online article).
Plasmid DNA constructs and transfection of 293T cells
A plasmid with an NKG2D cDNA32 was obtained from Daniel Davis (Imperial College of London, London, United Kingdom). DAP10 cDNA was cloned from NKL into pCR3.1-TOPO (Invitrogen). The fragment was subcloned into pFLAG-CMV10 using EcoRI and XbaI restriction sites to generate pFLAG-DAP10. 293T cells were transfected with 1.0 μg of NKG2D or DAP10 cDNA using Fugene HD (Roche Diagnostics). For cotransfection of NKG2D with DAP10, 1.0 μg of NKG2D plasmid was tranfected into 293T cells together with either 0.3 or 1.0 μg of DAP10 plasmid (plus empty vector to bring the total amount to 2 μg).
Statistical analysis
Statistical analysis was performed using the 2-tailed, paired Student t test and ANOVA (*P < .05; **P < .01; ***P < .005).
Results
IL-2 and TGF-β1 differentially regulate NKG2D surface expression
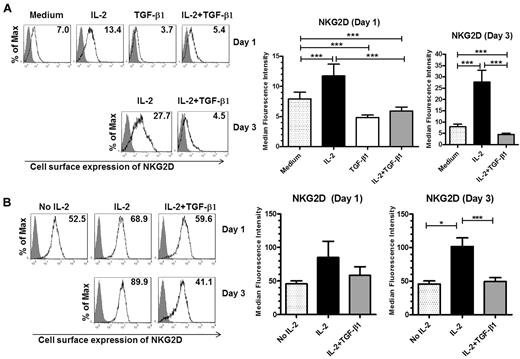
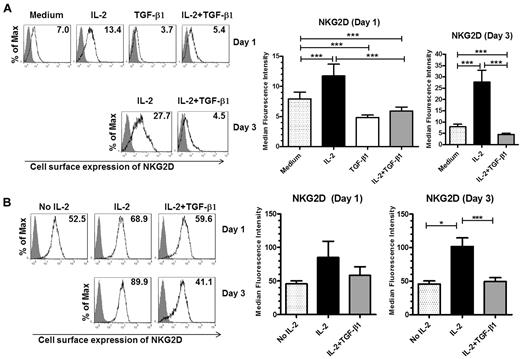
Although changes in the cell-surface level of the NKG2D receptor mediated by IL-2 and TGF-β1 on NK cells have been reported before,30,33 how this occurs has yet to be explained. To begin to address this question, we first compared the effects of IL-2 and TGF-β1 on NKG2D expression by primary human NK cells. We cultured ex vivo isolated human NK cells in the presence of either IL-2, TGF-β1, or IL-2 plus TGF-β1 for one or 3 days and monitored cell-surface expression of NKG2D by flow cytometry. When compared with the untreated cells, 1 day of IL-2 stimulation resulted in an ∼ 1.5-fold increase of NKG2D expression on the surface of NK cells and after 3 days the increase was 3- to 4-fold (Figure 1A). In contrast, 1-day treatment of NK cells with TGF-β1 reduced the cell-surface expression of NKG2D by 1.6-fold, when compared with untreated cells (Figure 1A right panel).
Opposing effects of IL-2 and TGF-β1 on NKG2D cell-surface expression. (A) NKG2D cell-surface expression in primary human NK cells. Cells were left untreated (medium) or were stimulated with IL-2, TGF-β1, or IL-2, and TGF-β1 for either 1 or 3 days and the surface expression of NKG2D was analyzed by flow cytometry. Gray-filled histograms represent isotype control staining while black line histograms show staining with anti-NKG2D antibody from a representative experiment (left panel). Summary of the data from 22 donors is shown on the right (note: primary NK cells are not viable if maintained for 3 days in medium plus TGF-β1 alone). (B) NKG2D cell-surface expression by NKL cells. NKL cells were cultured without IL-2 for 3 days, then stimulated as described in panel A and NKG2D expression was analyzed by flow cytometry. The left panel shows a representative experiment; gray-filled histograms represent isotype control staining, black line histograms show staining with anti-NKG2D antibody. Summary of the cell-surface expression of NKG2D on day 1 and day 3, after treatment with IL-2, TGF-β1, or IL-2 plus TGF-β1, is shown on the right; the data are from 5 independent experiments. The numeric values in the histograms indicate the median fluorescence intensity of NKG2D cell surface expression. Graphs in panels A and B represent the average values of median fluorescence intensity ± SEM. Asterisks indicate statistical significance (paired Student t test; *P < .05; **P < .01; ***P < .005).
Opposing effects of IL-2 and TGF-β1 on NKG2D cell-surface expression. (A) NKG2D cell-surface expression in primary human NK cells. Cells were left untreated (medium) or were stimulated with IL-2, TGF-β1, or IL-2, and TGF-β1 for either 1 or 3 days and the surface expression of NKG2D was analyzed by flow cytometry. Gray-filled histograms represent isotype control staining while black line histograms show staining with anti-NKG2D antibody from a representative experiment (left panel). Summary of the data from 22 donors is shown on the right (note: primary NK cells are not viable if maintained for 3 days in medium plus TGF-β1 alone). (B) NKG2D cell-surface expression by NKL cells. NKL cells were cultured without IL-2 for 3 days, then stimulated as described in panel A and NKG2D expression was analyzed by flow cytometry. The left panel shows a representative experiment; gray-filled histograms represent isotype control staining, black line histograms show staining with anti-NKG2D antibody. Summary of the cell-surface expression of NKG2D on day 1 and day 3, after treatment with IL-2, TGF-β1, or IL-2 plus TGF-β1, is shown on the right; the data are from 5 independent experiments. The numeric values in the histograms indicate the median fluorescence intensity of NKG2D cell surface expression. Graphs in panels A and B represent the average values of median fluorescence intensity ± SEM. Asterisks indicate statistical significance (paired Student t test; *P < .05; **P < .01; ***P < .005).
Moreover, when the cells were cultured with IL-2 and TGF-β1, TGF-β1 decreased the IL-2–mediated up-regulation of the cell-surface levels of NKG2D to values below that observed for the untreated cells. One day of treatment with IL-2 and TGF-β1 caused a 2-fold decrease of NKG2D cell-surface expression when compared with NK cells treated with IL-2 alone. The presence of TGF-β1 in the culture for 3 days resulted in an almost 6-fold decrease of NKG2D expression level (Figure 1A right panel).
We obtained similar results using a tumor NK cell line, NKL. One day of IL-2 stimulation resulted in an ∼ 2-fold increase of NKG2D expression on the surface of NKL cells and after 3 days the increase was > 2-fold. The presence of TGF-β1 for 1 day resulted in an almost 1.5-fold decrease of NKG2D levels compared with IL-2–stimulated cells (Figure 1B right panel). Confirmation of the results found in primary NK cells with the NKL cell line validates their use as a model when warranted to study the regulation of human NKG2D expression.
Thus, our results demonstrate that while IL-2 has a stimulatory effect on NKG2D cell-surface expression in human NK cells, TGF-β1 not only decreases NKG2D expression, but also has a dominant effect over IL-2, under the conditions used.
Transcriptional and translational regulation of the NKG2D-DAP10 receptor complex by IL-2 and TGF-β1
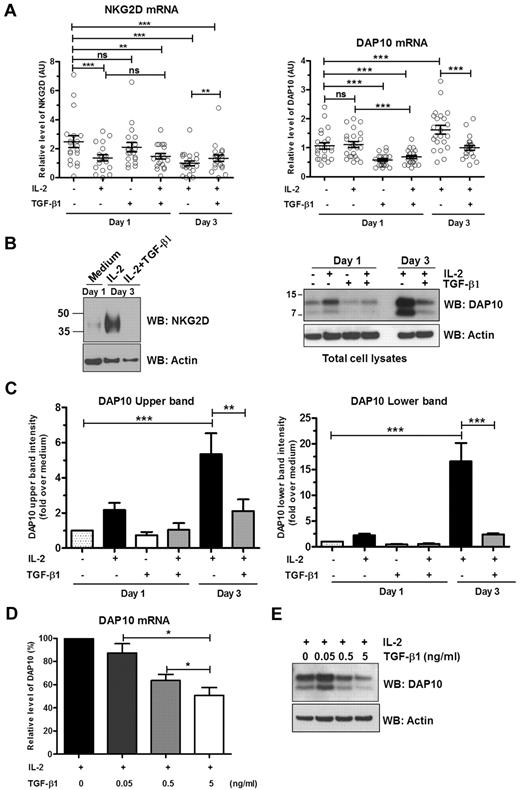
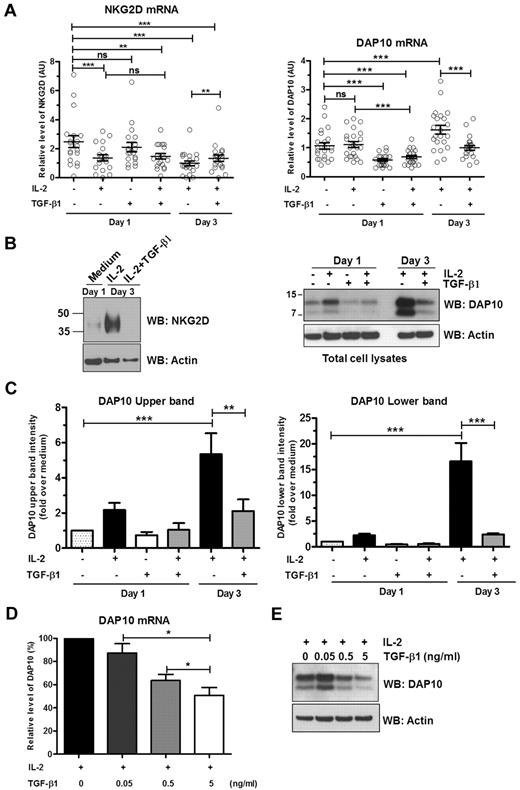
To better define the effects IL-2 and TGF-β1 exert on NKG2D surface expression by NK cells, we examined the mRNA and protein levels of NKG2D and DAP10. IL-2 stimulation had moderate effects on the levels of NKG2D and DAP10 mRNA. When compared with nonstimulated cells, IL-2 treatment for 1 or 3 days caused an ∼ 2-fold decrease of NKG2D mRNA (Figure 2A left panel). IL-2 did not cause any change in DAP10 mRNA levels within the first 24 hours; stimulation of NK cells with IL-2 for 3 days caused a 1.6-fold increase in the level of DAP10 mRNA (Figure 2A right panel). On the other hand, examination of protein levels showed that IL-2 stimulation markedly increased NKG2D protein expression after 3 days of stimulation (Figure 2B left panel). In the case of DAP10, we observed 2 distinct protein bands (Figure 2B right panel), a higher molecular weight band around 10 kDa, and a lower one at ∼ 7 kDa, as previously described by Wu et al.34 One-day stimulation with IL-2 revealed that IL-2 induced an ∼ 2-fold increase of DAP10 top and bottom bands (Figure 2C). Three-day stimulation with IL-2 resulted in an even more pronounced effect (Figure 2B); the expression of the upper band of DAP10 increased 5-fold and the expression of the lower band was amplified 17-fold (Figure 2C). (The molecular relationship of these 2 DAP10 proteins to each other and NKG2D is addressed in the next section.)
Transcriptional and translational regulation of NKG2D and DAP10 by IL-2 and TGF-β1. Ex vivo isolated human NK cells were left untreated or were stimulated with IL-2, TGF-β1, or both IL-2 and TGF-β1 for either 1 or 3 days. (A) NKG2D (left panel) and DAP10 (right panel) transcripts were analyzed by qRT-PCR with specific primer sets and normalized to 18S rRNA. Scatter plots show mean values ± SEM. Each symbol represents a donor. Statistical significance was tested by paired Student t test and indicated by asterisks (*P < .05; **P < .01; ***P < .005). (B) Total cell lysates of primary NK cells were immunoblotted with anti-NKG2D (left panel) or anti-DAP10 (right panel) antibodies. (With commercially available antibodies, we are not able to detect NKG2D in the lysates of primary NK cells unless we concentrate the protein by some means, in this case TCA precipitation. The resultant high concentration of protein loaded on the gels leads to some distortion of the protein bands.) Actin was used as a loading control. The results are representative of 3 independent experiments with different donors. (C) The intensities of the upper band (left panel) and lower band (right panel) of DAP10 protein were quantified by densitometric analysis. Band intensities were normalized to actin and calibrated to values from untreated cells (value = 1). Data are shown as mean ± SEM from 3 different donors. Statistical significance is indicated by asterisks (*P < .05; ANOVA). (D) Ex vivo isolated human NK cells were stimulated for 3 days with either IL-2 alone or IL-2 with increasing amounts of TGF-β1. DAP10 transcripts were analyzed by qRT-PCR and normalized to 18S rRNA. Data from separate experiments with 7 different donors are presented as the percentage of DAP10 mRNA level in cells treated only with IL-2. Error bars represent SEM, statistical significance is indicated by asterisks (*P < .05; paired Student t test). (E) DAP10 protein levels in total cell lysates from ex vivo isolated human NK cells treated as in panel D were assessed by Western blot. A representative result of 3 different donors is shown. Actin was used as a loading control.
Transcriptional and translational regulation of NKG2D and DAP10 by IL-2 and TGF-β1. Ex vivo isolated human NK cells were left untreated or were stimulated with IL-2, TGF-β1, or both IL-2 and TGF-β1 for either 1 or 3 days. (A) NKG2D (left panel) and DAP10 (right panel) transcripts were analyzed by qRT-PCR with specific primer sets and normalized to 18S rRNA. Scatter plots show mean values ± SEM. Each symbol represents a donor. Statistical significance was tested by paired Student t test and indicated by asterisks (*P < .05; **P < .01; ***P < .005). (B) Total cell lysates of primary NK cells were immunoblotted with anti-NKG2D (left panel) or anti-DAP10 (right panel) antibodies. (With commercially available antibodies, we are not able to detect NKG2D in the lysates of primary NK cells unless we concentrate the protein by some means, in this case TCA precipitation. The resultant high concentration of protein loaded on the gels leads to some distortion of the protein bands.) Actin was used as a loading control. The results are representative of 3 independent experiments with different donors. (C) The intensities of the upper band (left panel) and lower band (right panel) of DAP10 protein were quantified by densitometric analysis. Band intensities were normalized to actin and calibrated to values from untreated cells (value = 1). Data are shown as mean ± SEM from 3 different donors. Statistical significance is indicated by asterisks (*P < .05; ANOVA). (D) Ex vivo isolated human NK cells were stimulated for 3 days with either IL-2 alone or IL-2 with increasing amounts of TGF-β1. DAP10 transcripts were analyzed by qRT-PCR and normalized to 18S rRNA. Data from separate experiments with 7 different donors are presented as the percentage of DAP10 mRNA level in cells treated only with IL-2. Error bars represent SEM, statistical significance is indicated by asterisks (*P < .05; paired Student t test). (E) DAP10 protein levels in total cell lysates from ex vivo isolated human NK cells treated as in panel D were assessed by Western blot. A representative result of 3 different donors is shown. Actin was used as a loading control.
Exposure of cells to TGF-β1 for 1 day did not result in significant change of NKG2D mRNA levels (Figure 2A left panel). The decrease of NKG2D mRNA levels compared with medium alone observed when treatment with TGF-β1 is combined with IL-2 for 3 days is most likely caused by the presence of IL-2 rather than TGF-β1, as the decrease of NKG2D mRNA both in 1 and 3 days is the same as with IL-2 alone. In fact, at day 3, when combined with IL-2, TGF-β1 treatment resulted in small but significant increase of NKG2D transcripts compared with IL-2 treatment alone (Figure 2A left panel). Surprisingly though, the presence of TGF-β1 completely suppressed the marked IL-2–induced up-regulation of NKG2D protein expression (Figure 2B left panel).
In contrast to NKG2D, TGF-β1 had a more pronounced effect on DAP10 mRNA levels. TGF-β1 alone or in combination with IL-2 was able to decrease DAP10 mRNA (1.6- to 2-fold) 1 day after exposure. Furthermore, incubation of NK cells with IL-2 and TGF-β1 for 3 days reversed the stimulatory effect of IL-2 alone on DAP10 transcription, and DAP10 mRNA levels were reduced to the level observed in the nonstimulated cells (Figure 2A right panel). Treatment of NK cells with TGF-β1 alone for 1 day reduced DAP10 protein expression levels to below that present in medium alone (Figure 2B right panel, and C). Moreover, TGF-β1 had dominant effect over IL-2 and cells treated with TGF-β1 and IL-2 for 1 day failed to increase DAP10 protein (Figure 2B-C). After 3 days in culture in the presence of both cytokines, TGF-β1 inhibited IL-2–mediated up-regulation of expression of the DAP10 upper band by ∼ 3-fold and lower band by ∼ 7-fold (Figure 2C). The effect of TGF-β1 on IL-2–induced DAP10 mRNA and protein expression was dose-dependent (Figure 2D-E). Similarly to primary NK cells, stimulation of NKL cells with IL-2 increased DAP10 protein expression (supplemental Figure 1). TGF-β1 had a dominant effect; at 1 day, TGF-β1 treatment neutralized the ability of IL-2 to up-regulate DAP10 protein expression and treatment of cells with TGF-β1 plus IL-2 for 2 days resulted in a marked reduction of DAP10 protein relative to medium alone.
TGF-β1 decreased the mRNA level of DAP10, indicating that TGF-β1–mediated effects occur at least partially at the transcriptional level. To investigate this, we performed ChIP assays. RNA pol II–associated DNA was immunoprecipitated from ex vivo isolated primary NK cells that were left untreated or treated with IL-2 for 1 or 3 days in the presence or absence of TGF-β1. After 3 days of IL-2 treatment, association of RNA pol II with the DAP10 promoter had a tendency to increase (3.6-fold for primer pair 1 and 4.6-fold for primer pair 2) when compared with unstimulated cells. Importantly, this association was significantly reduced (12-fold using primer pair 1 or 23-fold with primer pair 2) in the presence of TGF-β1 (Figure 3A). We obtained the same results using NKL cells, where the treatment of IL-2–cultured NKL cells with TGF-β1 decreased association of RNA pol II with the DAP10 promoter 8- to 13-fold, when compared with NKL cells with IL-2 alone (Figure 3B).
TGF-β1 blocks DAP10 transcription. ChIP assays. Primary human NK cells (A) or NKL cells (B) were left untreated ( ), treated with IL-2 (■), or treated with IL-2 plus TGF-β1 (
 ) for 3 days (primary cells) or 36 hours (NKL cells). Cells were fixed, sonicated, and immunoprecipitated with an anti-RNA pol II antibody or IgG isotype control. The amount of DAP10 DNA immunoprecipitated in each experiment was assessed by quantitative PCR using 2 different promoter-specific primer sets and calculated relative to a standard curve generated with serial dilutions of human genomic DNA. All reactions were done in triplicate and the average value of triplicate was used for calculating the relative levels of each mRNA species. Relative quantification of the target genes was made with the 2nd derivative maximum method using the Roche Lightcycler software and calculating the fold change over the 18S rRNA or actin level. Results are expressed as the mean of RNA pol II fold enrichment over isotype control antibody, normalized to values from untreated cells. For primary NK cells, a representative result from 3 separate experiments with different donors is shown. For NKL cells, n = 2, error bar represents SEM.
TGF-β1 blocks DAP10 transcription. ChIP assays. Primary human NK cells (A) or NKL cells (B) were left untreated ( ), treated with IL-2 (■), or treated with IL-2 plus TGF-β1 (
 ) for 3 days (primary cells) or 36 hours (NKL cells). Cells were fixed, sonicated, and immunoprecipitated with an anti-RNA pol II antibody or IgG isotype control. The amount of DAP10 DNA immunoprecipitated in each experiment was assessed by quantitative PCR using 2 different promoter-specific primer sets and calculated relative to a standard curve generated with serial dilutions of human genomic DNA. All reactions were done in triplicate and the average value of triplicate was used for calculating the relative levels of each mRNA species. Relative quantification of the target genes was made with the 2nd derivative maximum method using the Roche Lightcycler software and calculating the fold change over the 18S rRNA or actin level. Results are expressed as the mean of RNA pol II fold enrichment over isotype control antibody, normalized to values from untreated cells. For primary NK cells, a representative result from 3 separate experiments with different donors is shown. For NKL cells, n = 2, error bar represents SEM.
In summary, IL-2 induced robust stimulation of both NKG2D and DAP10 protein expression by day 3 of exposure, which agreed with the marked up-regulation of NKG2D surface expression. Notably, NKG2D transcript levels actually declined, indicating that the up-regulation of NKG2D surface expression must be because of effects other than the regulation of NKG2D gene expression alone. Contrary to NKG2D, DAP10 mRNA levels showed a moderate increase by day 3 of IL-2 stimulation. TGF-β1 reversed the effect of IL-2; however, it did not affect NKG2D mRNA but suppressed DAP10 gene expression, suggesting that control of DAP10 gene expression and subsequent DAP10 protein availability are the elements that regulate the expression of NKG2D-DAP10 complex.
Glycosylated form of DAP10 protein associates with NKG2D
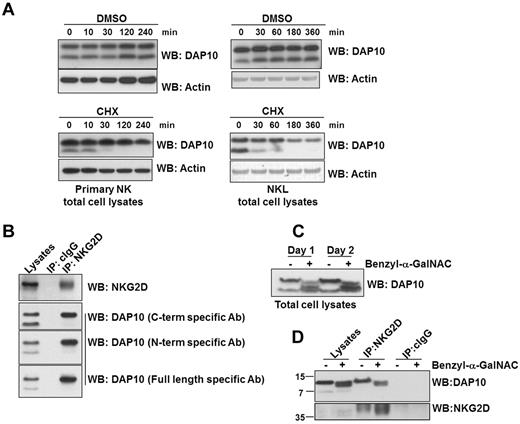
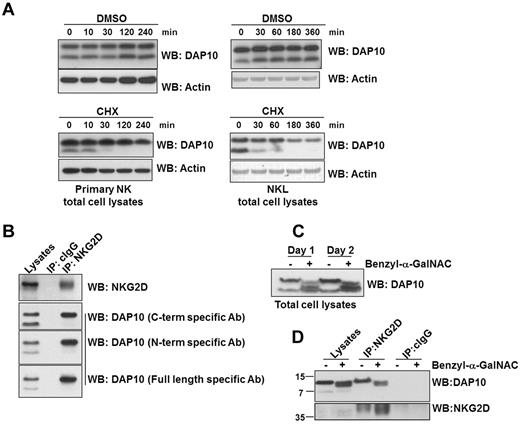
Two distinct molecular sizes of DAP10 protein were up-regulated in NK cells by IL-2 stimulation (Figure 2B). The molecular size of the smaller form of DAP10 (∼ 7 kDa) is in line with the predicted size of the unmodified DAP10 polypeptide chain and thus likely represents newly synthesized, immature protein. To verify this, we cultured primary NK cells or NKL cells with IL-2 for 3 days and then blocked protein translation with cycloheximide (CHX). Next, we analyzed the pattern of protein expression with time by Western blotting (Figure 4A). DMSO (vehicle)–treated cells continuously express the larger and smaller forms of DAP10 up to 4 hours after treatment (Figure 4A); however, in the CHX-treated cells, there is a rapid disappearance of the smaller form of DAP10, suggesting that the smaller form is very unstable and dependent on active protein synthesis. On the contrary, the amount of the larger molecular weight form of DAP10 remains essentially constant, even though translation was blocked. This indicated that the larger form of DAP10 could be stabilized, possibly by replenishment from the smaller molecular weight form by posttranslational modification and/or interaction with NKG2D. To investigate these possibilities, we immunoprecipitated NKG2D from NKL cells. We found that only the higher molecular weight form of DAP10 associated with NKG2D (Figure 4B). We tested multiple anti–peptide-specific DAP10 antibodies that recognized both forms of DAP10 and confirmed with each of these antibodies that only the larger form of DAP10 interacted with NKG2D.
DAP10 stability, glycosylation and association with NKG2D in human NK cells. (A) Primary NK cells were cultured with IL-2 for 3 days, followed by treatment with the translation inhibitor, cycloheximide (CHX) or DMSO (vehicle) for the indicated times. DAP10 protein levels from the total cell lysates were visualized by immunoblotting and protein loading was verified by blotting with anti-actin antibody. (B) NKG2D was immunoprecipitated from NKL cell lysates. The immunoprecipitated proteins were subsequently immunoblotted with anti-NKG2D and anti-DAP10 antibodies as indicated. Isotype specific IgG (cIgG) immunoprecipitation was used as a negative control. (C) NKL cells were treated with an O-glycosylation inhibitor (benzyl-α-GalNAC) for either 1 or 2 days. The total cell lysates were resolved on a 10%-20% gradient gel, followed by anti-DAP10 immunoblotting. (D) NKL cells were treated with benzyl-α-GalNAC for 2 days and NKG2D was immunoprecipitated from the total cell lysates. The immunoprecipitated proteins were immunoblotted with anti-DAP10 and anti-NKG2D antibodies. Isotype specific IgG (cIgG) immunoprecipitation was used as a control.
DAP10 stability, glycosylation and association with NKG2D in human NK cells. (A) Primary NK cells were cultured with IL-2 for 3 days, followed by treatment with the translation inhibitor, cycloheximide (CHX) or DMSO (vehicle) for the indicated times. DAP10 protein levels from the total cell lysates were visualized by immunoblotting and protein loading was verified by blotting with anti-actin antibody. (B) NKG2D was immunoprecipitated from NKL cell lysates. The immunoprecipitated proteins were subsequently immunoblotted with anti-NKG2D and anti-DAP10 antibodies as indicated. Isotype specific IgG (cIgG) immunoprecipitation was used as a negative control. (C) NKL cells were treated with an O-glycosylation inhibitor (benzyl-α-GalNAC) for either 1 or 2 days. The total cell lysates were resolved on a 10%-20% gradient gel, followed by anti-DAP10 immunoblotting. (D) NKL cells were treated with benzyl-α-GalNAC for 2 days and NKG2D was immunoprecipitated from the total cell lysates. The immunoprecipitated proteins were immunoblotted with anti-DAP10 and anti-NKG2D antibodies. Isotype specific IgG (cIgG) immunoprecipitation was used as a control.
Although the occurrence of these 2 predominant molecular size forms of DAP10 in cell lysates has been described,5,34 little is known about their relationship to each other or to NKG2D. The analysis of the human DAP10 sequence using NetOGlyc 3.1 Server revealed 4 potential O-glycosylation and no N-glycosylation sites. To examine human DAP10 O-glycosylation, we used the chemical inhibitor, benzyl-α-GalNAC. Treatment of NK cells with benzyl-α-GalNAC eliminated the high molecular weight form of DAP10 and resulted in the appearance of intermediate sized forms, most likely representing different stages of DAP10 glycosylation (Figure 4C). (Such treatment does not eliminate the chain initiation N-acetyl amino sugars.) Notably, while the unglycosylated form of DAP10 could not interact with NKG2D, the intermediate forms were still able to bind to NKG2D (Figure 4D), indicating that only partial glycosylation of DAP10 is required for DAP10-NKG2D interaction. Collectively, these results show that newly synthesized DAP10 protein undergoes glycosylation and the addition of O-linked glycans is required for the association of DAP10 with NKG2D (Figure 4B) and contributes to greater stability of DAP10 (Figure 4A).
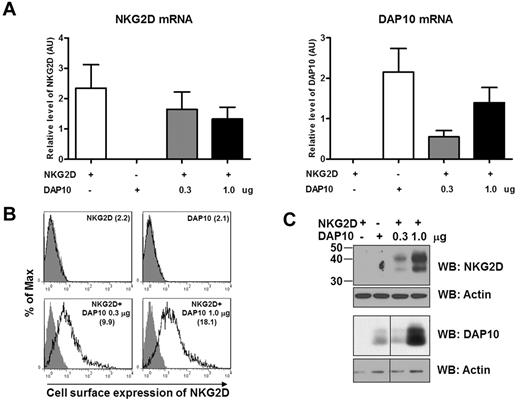
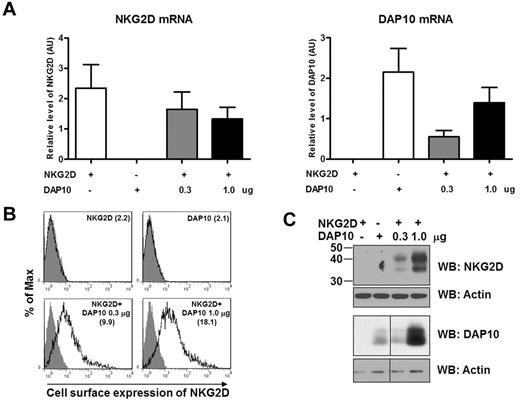
To verify that DAP10 controls NKG2D cell surface expression, we next transfected NKG2D- and DAP10-negative 293T cells with DAP10 or NKG2D alone, or with both NKG2D and DAP10. We used a constant amount of NKG2D cDNA (1.0 μg) and high and low amounts of DAP10 cDNA (0.3 and 1.0 μg). As a result, we generated transfectants that had the same levels of NKG2D mRNA and 2 different levels of DAP10 mRNA (Figure 5A). Analysis of either the cell surface or the total NKG2D protein level revealed that NKG2D expression was clearly dependent on the presence of DAP10 (Figure 5B-C). NKG2D appeared on the cell surface of 293T cells only when DAP10 was present and the amount of NKG2D, including the cell-surface expression, correlated with the increasing amount of DAP10 expression. Remarkably, NKG2D expression was not detectable without DAP10 (Figure 5B-C), even though the transcripts for NKG2D were abundant (Figure 5A), suggesting that NKG2D undergoes rapid degradation without DAP10. Of note is the fact that simultaneous transfection of NKG2D and DAP10 resulted in a more robust expression of the glycosylated form of DAP10 (Figure 5C), indicating that interaction between DAP10 and NKG2D might also favor an increase in DAP10 stability (see Figure 4A).
DAP10 expression levels regulate the amount of NKG2D surface expression. Cells (293T) were transfected with either NKG2D (1.0 μg), DAP10 (1.0 μg), or 1.0 μg NKG2D and an increasing amount of DAP10 (0.3, 1.0 μg) cDNA. Forty-eight hours after transfection, the cells were analyzed for mRNA and protein levels of NKG2D and DAP10. (A) The NKG2D (left panel) and DAP10 (right panel) transcripts were analyzed by qRT-PCR with specific primer sets and normalized to actin RNA, and are presented in arbitrary units. Data shown are from 2 separate experiments. (B) The expression of NKG2D on the cell surface of 293T cells after transfection was analyzed by flow cytometry. The value of median fluorescence intensity of NKG2D is indicated in parentheses in each graph. Gray filled histograms represent isotype controls. Data are representative of 2 separate experiments. (C) NKG2D and DAP10 protein levels from total cell lysates of 293T transfectants were analyzed by Western blotting. Anti-actin immunoblotting was used as a loading control. The result shown is representative of 2 independent experiments.
DAP10 expression levels regulate the amount of NKG2D surface expression. Cells (293T) were transfected with either NKG2D (1.0 μg), DAP10 (1.0 μg), or 1.0 μg NKG2D and an increasing amount of DAP10 (0.3, 1.0 μg) cDNA. Forty-eight hours after transfection, the cells were analyzed for mRNA and protein levels of NKG2D and DAP10. (A) The NKG2D (left panel) and DAP10 (right panel) transcripts were analyzed by qRT-PCR with specific primer sets and normalized to actin RNA, and are presented in arbitrary units. Data shown are from 2 separate experiments. (B) The expression of NKG2D on the cell surface of 293T cells after transfection was analyzed by flow cytometry. The value of median fluorescence intensity of NKG2D is indicated in parentheses in each graph. Gray filled histograms represent isotype controls. Data are representative of 2 separate experiments. (C) NKG2D and DAP10 protein levels from total cell lysates of 293T transfectants were analyzed by Western blotting. Anti-actin immunoblotting was used as a loading control. The result shown is representative of 2 independent experiments.
The γc cytokines share their ability to regulate the expression of the NKG2D-DAP10 receptor complex
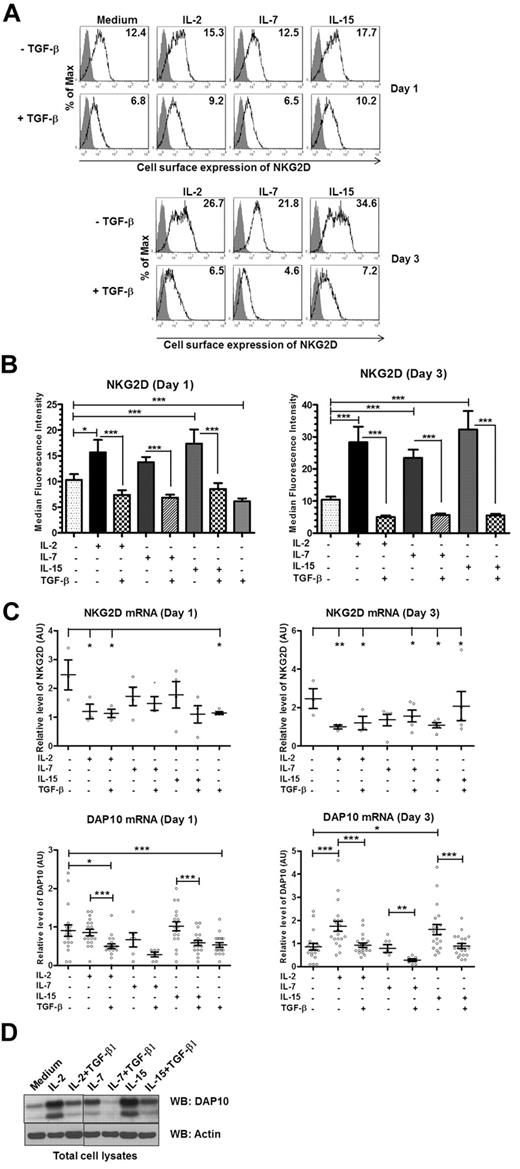
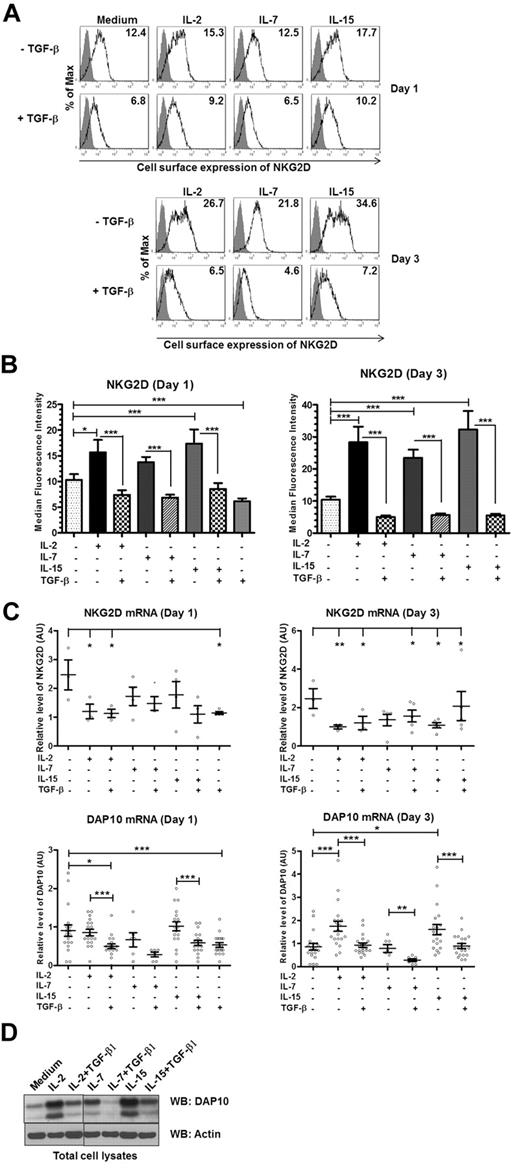
IL-2 is a member of the γc family of cytokines.35 Therefore, we tested whether other members of the γc family of cytokines regulated NKG2D-DAP10 similarly to IL-2. NK cells were cultured in the presence of the various cytokines for 1 or 3 days. Like IL-2, other γc cytokines shared the ability to up-regulate NKG2D cell surface expression to a similar extent and TGF-β1 dominantly down-regulated NKG2D expression (Figure 6A-B). Importantly, whereas IL-2 and IL-15 decreased NKG2D mRNA levels after 3 days of coculture, they increased DAP10 mRNA levels (∼ 2-fold; day 3; Figure 6C). IL-7 had no effect on mRNA levels; however, all of the cytokines up-regulated DAP10 protein expression, with IL-2 and IL-15 being most effective (Figure 6D). To determine whether the difference in the ability of the tested cytokines to up-regulate DAP10 and NKG2D surface expression correlates with different amounts of the corresponding cytokine receptors, we examined NK cells for receptor level expression. While IL-2Rβ, which can be shared by both IL-2 and IL-15, was very abundant, the receptor for IL-7 (IL-7Rα) was expressed only by a subset of NK cells (A.G.K., unpublished results, March 2011).19,35,36 The presence of TGF-β1 reversed the up-regulation of DAP10 mRNA and protein expression in case of all the γc cytokines tested (Figure 6). Therefore, our results show that the investigated γc family cytokines share the ability to up-regulate the expression of DAP10, which, in turn, promotes NKG2D cell-surface expression.
The γc chain cytokines share their ability to regulate the expression of the NKG2D-DAP10 receptor complex. Ex vivo isolated human NK cells were left untreated (medium) or were stimulated with IL-2, IL-7, IL-15, TGF-β1, or combinations as indicated for either 1 or 3 days. (A) Gray-filled histograms represent isotype control staining while black line histograms show staining with anti-NKG2D antibody from a representative experiment. Values in each histogram correspond to the median fluorescence intensity of NKG2D cell-surface staining. (B) Summary of the cell-surface expression of NKG2D on day 1 and day 3, following the indicated treatments. Bar graphs represent the average values of median fluorescence intensity from at least 5 donors; error bars represent SEM. Asterisks indicate the statistical significance (*P < .05; **P < .01; ***P < .005 paired Student t test). (C) NKG2D (top panel) and DAP10 (bottom panel) transcripts were analyzed by qRT-PCR with primer sets specific for each transcript of interest. mRNA expression levels, normalized to 18S rRNA, are presented in arbitrary units. Scatter plots show values for individual donors with mean ± SEM. Each symbol represents a donor. Statistical significance was tested by ANOVA for NKG2D and paired Student t test for DAP10 and indicated by asterisks (*P < .05; **P < .01; ***P < .005). (D) Total cell lysates of primary NK cells, left untreated or stimulated as indicated for 3 days, were immunoblotted with anti-DAP10 antibody. Actin was used as a loading control. The result shown is representative of 4 separate experiments with different donors.
The γc chain cytokines share their ability to regulate the expression of the NKG2D-DAP10 receptor complex. Ex vivo isolated human NK cells were left untreated (medium) or were stimulated with IL-2, IL-7, IL-15, TGF-β1, or combinations as indicated for either 1 or 3 days. (A) Gray-filled histograms represent isotype control staining while black line histograms show staining with anti-NKG2D antibody from a representative experiment. Values in each histogram correspond to the median fluorescence intensity of NKG2D cell-surface staining. (B) Summary of the cell-surface expression of NKG2D on day 1 and day 3, following the indicated treatments. Bar graphs represent the average values of median fluorescence intensity from at least 5 donors; error bars represent SEM. Asterisks indicate the statistical significance (*P < .05; **P < .01; ***P < .005 paired Student t test). (C) NKG2D (top panel) and DAP10 (bottom panel) transcripts were analyzed by qRT-PCR with primer sets specific for each transcript of interest. mRNA expression levels, normalized to 18S rRNA, are presented in arbitrary units. Scatter plots show values for individual donors with mean ± SEM. Each symbol represents a donor. Statistical significance was tested by ANOVA for NKG2D and paired Student t test for DAP10 and indicated by asterisks (*P < .05; **P < .01; ***P < .005). (D) Total cell lysates of primary NK cells, left untreated or stimulated as indicated for 3 days, were immunoblotted with anti-DAP10 antibody. Actin was used as a loading control. The result shown is representative of 4 separate experiments with different donors.
Discussion
NKG2D is of special importance within the spectrum of NK cell-activating receptors, playing a vital role in controlling tumor development, as well as certain viral infections.1,10-12 On the other hand, by virtue of its expression on T cells, it can exacerbate autoimmune responses by costimulating TCR signaling.14-17,37 Thus, manipulating NKG2D expression has potential clinical application. Here we show that the γc cytokines up-regulate NKG2D surface expression, whereas TGF-β1 dominantly suppresses NKG2D expression, and that regulation of DAP10 expression and the availability of glycosylated DAP10 protein are key to NKG2D-DAP10 surface expression.
In agreement with others,23-25 we find that IL-2 stimulation of primary NK cells leads to a 3- to 4-fold up-regulation of surface NKG2D expression by day 3 (Figure 1A). At the same time, there is an ∼ 5-fold increase in the larger molecular size (“mature”) DAP10 (Figure 2C), the form that associates with NKG2D (Figure 4B), and a remarkable ∼ 16-fold increase in the smaller molecular size (“immature”) form of DAP10. The fact that there is only a modest increase in DAP10 transcript levels (1.5-fold) by day 3 strongly suggests that IL-2 is dramatically increasing the rate of DAP10 translation. This is not unheard of, as activation of the IL-2 receptor in NK cells results in translational regulation of telomerase38 and Ets1.39 Plus, others have observed that NKG2D and DAP10 transcript levels do not necessarily reflect NKG2D-DAP10 surface expression levels.13,40 On the other hand, if anything, IL-2 moderately down-regulates NKG2D transcription (Figure 2A) and, while more NKG2D is detected in NK cells after IL-2 stimulation (Figure 2B), there is a good chance that this is not due to increased synthesis of NKG2D itself, but to the elevated levels of DAP10. In the absence of DAP10, NKG2D is apparently rapidly degraded (Figure 5C). The proper pairing of the receptor and its adaptor could serve to stabilize and/or protect the receptor from degradation. It has been demonstrated that, in the absence of the surrogate light chain, the heavy chain of the pre-BCR binds BiP in the endoplasmic reticulum (ER) and is degraded.41 The α chain of TCR is also rapidly degraded in the ER, unless the CD3 δ chain is present.42 Often, receptors that pair with adaptors are not expressed in the absence of their partner as their transmembrane charges should be neutralized to stabilize the pairing. For example, the cell- surface expression of CD16 depends on the presence of a signaling molecule, FcRγ or CD3ζ43 and Ly49H surface expression requires either DAP10 or DAP12.44,45 It is generally believed that NKG2D surface expression requires an adaptor molecule.9,10 With transfected cells, some surface expression of NKG2D has been observed in the apparent absence of DAP10.2,34 In our case, using over-expression in the DAP10- and NKG2D-negative 293T cell line, we found that the association between DAP10 and NKG2D is required for the cell-surface expression of NKG2D. Despite the presence of abundant transcripts in cells fully capable of expressing NKG2D (Figure 5A), no NKG2D protein is detectable in the absence of DAP10; on the other hand, DAP10 protein levels appear not to be affected by the absence of NKG2D (Figure 5C). This strongly suggests that NKG2D undergoes rapid degradation if not properly paired with DAP10 and leads us to conclude that IL-2 enhances NKG2D surface expression largely by increasing the availability of DAP10 necessary for the protection from degradation and transport of NKG2D to the cell surface.
Importantly, we have identified for the first time, as far as we know, that only the glycosylated form of DAP10 is able to interact with NKG2D (Figure 4B). After stimulation with IL-2 the newly synthesized DAP10 becomes very abundant, but no association of the ∼ 7 kDa form with NKG2D is detected (Figure 4B). Our data imply that NKG2D and DAP10 chain association does not occur immediately posttranslationally, but requires posttranslational modification, at least of DAP10, for association to occur. One explanation would be that such modifications induce conformational changes in DAP10 before binding to NKG2D can occur. The fact that NKG2D is able to associate with incompletely glycosylated forms of DAP10 generated by treatment with benzyl-α-GalNAC (Figure 4D) indicates that only the presence of sugar moieties is necessary to induce such conformational changes. In this regard, glycosylation of the MHC class I heavy chain influences its conformational change that is required for proper assembly of heavy chain with β2-microglobulin.46 Moreover, similarly to what we observe for NKG2D and DAP10, the association of HLA-B heavy chain with β2-microglobulin is observed even if the oligosaccharide chain is truncated. Another explanation could be that DAP10 is unavailable, eg because of compartmentalization within the ER, for interaction with NKG2D until it is at least partially glycosylated. In addition, we cannot exclude the possibility that the association of the ∼ 7 kDa chain with NKG2D could be of very low affinity and dissociate during lysis of the cells or immunoprecipitation.
Our data support and substantially enhance previous observations that TGF-β1 suppresses NKG2D surface expression. TGF-β1 is a cytokine that is known to suppress the immune response by down-regulating the expression of numerous target genes.47 Among these broad effects, TGF-β1 is known to down-regulate NKG2D expression.28 Importantly, we find that the reduced NKG2D expression on TGF-β1 stimulation is not reflected in a reduction of NKG2D transcripts, but does correlate well with a significant reduction of DAP10 transcript levels and resultant DAP10 protein level (Figure 2) that is, in turn, required for NKG2D expression (Figure 5). TGF-β1 stimulation suppresses DAP10 transcription by reduction of recruitment of RNA pol II to the DAP10 promoter (Figure 3). The precise mechanism by which TGF-β1 reduces DAP10 gene transcription has not been determined yet and further studies are required.
IL-2 is a member of the γc cytokine family. Other members of this family, particularly IL-15,48 have been shown to maintain and sustain NK cells and to markedly affect their maturation and function.49 Consequently, we examined the effect of other γc cytokines on human NKG2D-DAP10 expression. We found that IL-7 and IL-15 can up-regulate NKG2D surface expression in a similar manner to IL-2 (Figure 6A-B). As with IL-2 stimulation, this up-regulation in NKG2D surface expression by these cytokines correlates with a dramatic up-regulation in DAP10 protein synthesis. We see the greatest effect of DAP10 up-regulation with IL-2 and IL-15. Freshly isolated NK cells express high amount of IL-2Rβ that can be used by both IL-2 and IL-15 (A.G.K., unpublished results, March 2011),35 whereas the highly specific IL-15Rα and IL-2Rα chains appear predominantly on the surface of NK cells after stimulation (A.G.K., unpublished results, March 2011).19,36 IL-7Rα is expressed on the CD56bright subset of NK cells,50 and the cytokine receptor is expressed at lower level than that of IL-2 or IL-15 receptors (A.G.K., unpublished results, March 2011). Thus the differences we observe in the strength of the cytokine effect likely reflect the fact that there are different levels of the cytokine receptors expressed by NK cells.
In summary, our results demonstrate that, after stimulation with γc chain cytokines, the NKG2D-DAP10 receptor pair expression is up-regulated, while TGF-β1 has an opposite effect. We show for the first time that the effects of cytokines are mediated by change of DAP10 synthesis rather than NKG2D. Because DAP10 expression and pairing with NKG2D is required for the activating receptor protection, regulation of DAP10 levels provides a mechanism that controls NKG2D expression and allows for more NKG2D to reach the cell surface. Accordingly, IL-2–mediated induction of DAP10 expression promotes high levels of NKG2D on the cell surface, whereas suppression of DAP10 expression by TGF-β1 prevents DAP10 expression and, subsequently, leads to down-regulation of NKG2D in human NK cells. Thus, our study provides an important insight into mechanisms controlling expression of NKG2D, an activating receptor important for anti-viral and anti-tumor activities of NK cells.
The online version of this article contains a data supplement.
The publication costs of this article were defrayed in part by page charge payment. Therefore, and solely to indicate this fact, this article is hereby marked “advertisement” in accordance with 18 USC section 1734.
Acknowledgments
The authors thank Giovanna Peruzzi, Yousuke Murakami, and Linjie Tian for critical reading of the manuscript.
National Institutes of Health
Authorship
Contribution: Y.P.P., S-C.C., P.K., A.G-K., and J.W. performed the experiments; Y.P.P., J.W., F.B., K.K., and J.E.C. analyzed the results; K.K., J.E.C., Y.P.P., and F.B. designed the research; and J.E.C., K.K., Y.P.P., and J.W. wrote the paper.
Conflict-of-interest disclosure: The authors declare no competing financial interests.
Correspondence: John E. Coligan, 12441 Parklawn Dr, Twinbrook II, Rm 205, Rockville, MD 20852; e-mail: jcoligan@niaid.nih.gov.




 ), treated with IL-2 (■), or treated with IL-2 plus TGF-β1 (
 ) for 3 days (primary cells) or 36 hours (NKL cells). Cells were fixed, sonicated, and immunoprecipitated with an anti-RNA pol II antibody or IgG isotype control. The amount of DAP10 DNA immunoprecipitated in each experiment was assessed by quantitative PCR using 2 different promoter-specific primer sets and calculated relative to a standard curve generated with serial dilutions of human genomic DNA. All reactions were done in triplicate and the average value of triplicate was used for calculating the relative levels of each mRNA species. Relative quantification of the target genes was made with the 2nd derivative maximum method using the Roche Lightcycler software and calculating the fold change over the 18S rRNA or actin level. Results are expressed as the mean of RNA pol II fold enrichment over isotype control antibody, normalized to values from untreated cells. For primary NK cells, a representative result from 3 separate experiments with different donors is shown. For NKL cells, n = 2, error bar represents SEM.