Abstract
Cytogenetic abnormalities (CAs) such as t(4;14), t(14;16) or del(17p), and nonhyperdiploidy are associated with poor prognosis in multiple myeloma. We evaluated the influence of CAs by FISH and DNA ploidy by flow cytometry on response and survival in 232 elderly, newly diagnosed multiple myeloma patients receiving an induction with weekly bortezomib followed by maintenance therapy with bortezomib-based combinations. Response was similar in the high-risk and standard-risk CA groups, both after induction (21% vs 27% complete responses [CRs]) and maintenance (39% vs 45% CR). However, high-risk patients showed shorter progression-free survival (PFS) than standard-risk patients, both from the first (24 vs 33 months; P = .04) and second randomization (17 vs 27 months; P = .01). This also translated into shorter overall survival (OS) for high-risk patients (3-year OS: 55% vs 77%; P = .001). This adverse prognosis applied to either t(4;14) or del(17p). Concerning DNA ploidy, hyperdiploid patients showed longer OS than nonhyperdiploid patients (77% vs 63% at 3 years; P = .04), and this was more evident in patients treated with bortezomib, thalidomide, and prednisone (77% vs 53% at 3 years; P = .02). The present schema does not overcome the negative prognosis of high-risk CAs and nonhyperdiploidy. This trial was registered with www.ClinicalTrials.gov as NCT00443235.
Introduction
Novel insights into the biology of myeloma cells have led to the identification of relevant prognostic factors. Cytogenetic abnormalities (CAs) are among the most important of these; the presence of t(4;14) and del(17p) identifies a group of high-risk patients with poor outcome.1-3 The introduction of novel agents in the treatment armamentarium of multiple myeloma (MM) has prompted the investigation of their potential to overcome the adverse prognosis of these high-risk CAs. However, so far, the field is more in darkness than in light and remains highly controversial. In the setting of young patients who are candidates for autologous stem cell transplantation, induction therapies including novel agents, such as bortezomib plus dexamethasone (VD), bortezomib, Adriamycin plus dexamethasone (PAD), or bortezomib plus thalidomide and dexamethasone (VTD), are superior to conventional regimens such as vincristine plus Adriamycin and dexamethasone (VAD), thalidomide plus Adriamycin and dexamethasone (TAD), or thalidomide plus dexamethasone (TD).4-8 The overall and complete response (CR) rates achieved by high-risk patients treated with these novel regimens are similar to those of the standard-risk CA subgroup. However, when we focus on progression-free (PFS) and overall survival (OS), the picture is not so clear. Some trials5,6 have reported the possibility of overcoming the adverse prognosis of high-risk CA, but this has not been reproduced by other studies, particularly for del(17p) deletion.9
In the nontransplantation setting, the VISTA trial showed that the combination of bortezomib plus melphalan and prednisone (VMP) gave a similar response rate and survival for standard-risk and high-risk CA patient subgroups, although the latter cohort was underrepresented, with only 26 cases.10,11 In agreement with this finding, a recent Italian trial comparing VMP and VMP plus thalidomide (VMPT) plus maintenance with bortezomib plus thalidomide (VT) reported comparable PFS for patients with and without cytogenetic abnormalities in both treatment arms.12
DNA ploidy is another important prognostic parameter. Several studies have shown that nonhyperdiploid cases have a worse prognosis than hyperdiploid ones, regardless of the method of assessment used: conventional cytogenetics,13 copy number variation,14 gene-expression profiling,15 or multiparametric flow cytometry.16-18 Flow cytometry enables simultaneous staining for PC identification and DNA content, providing rapid and objective information on the existence of clonal quantitative abnormalities in the total DNA content,19 although the frequency of hypodiploid cases is usually underestimated because single or balanced chromosomal losses cannot be detected by multiparametric flow cytometry.20
Given this background, we investigated the influence of high-risk CA and DNA ploidy assessed by FISH and flow cytometry, respectively, in a series of elderly MM patients included in the GEM05MAS65 trial, who were treated with 6 weekly bortezomib-based induction cycles followed by maintenance therapy. Our results show that the bortezomib-based scheme used here does not overcome the negative prognosis of high-risk CA and that nonhyperdiploid cases have a worse outcome than hyperdiploid patients, particularly with the bortezomib, thalidomide plus prednisone (VTP) combination.
Methods
The Spanish GEM05MAS65 trial included 260 patients 65 years of age and older with newly diagnosed, untreated, symptomatic, measurable MM. The institutional review board or independent ethics committee at each participating center approved the study. All patients provided written informed consent before screening in accordance with the Declaration of Helsinki. The trial is registered at www.ClinicalTrials.gov as NCT00443235. Data were monitored by an external contract research organization and centrally assessed.
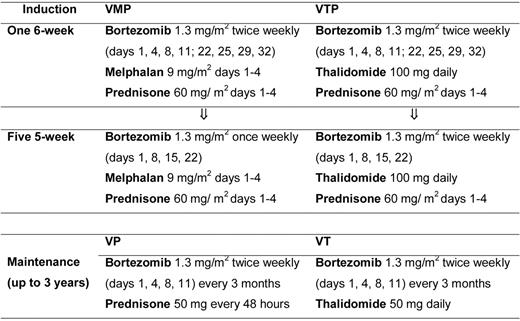
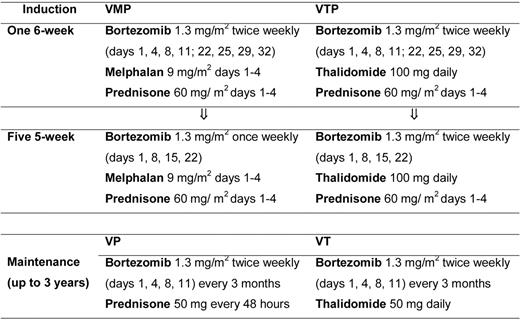
Patients were randomized to receive induction with VMP or VTP. VMP induction therapy consisted of 6 cycles: 1 cycle of IV bortezomib given twice per week for 6 weeks (1.3 mg/m2 on days 1, 4, 8, 11, 22, 25, 29, and 32), plus oral melphalan 9 mg/m2 and prednisone 60 mg/m2 on days 1-4, followed by 5 cycles of bortezomib once per week for 5 weeks (1.3 mg/m2 on days 1, 8, 15, and 22) plus the same doses of MP. VTP induction therapy consisted of the same schedule of bortezomib and prednisone plus oral, continuous thalidomide at a dose of 100 mg per day instead of melphalan. Patients completing the 6 induction cycles were then randomly assigned to maintenance therapy with bortezomib plus prednisone (VP) or VT. Maintenance consisted of 1 conventional cycle of bortezomib (1.3 mg/m2 on days 1, 4, 8, and 11) every 3 months, plus either oral prednisone 50 mg every other day or oral thalidomide 50 mg/d for up to 3 years (Figure 1).
FISH studies
DNA content analysis
Total DNA content was determined by flow cytometry, as described previously, using propidium iodide and specific antigens markers (CD38 and CD138). Aneuploid DNA cases were considered to be hypodiploid when the DNA index was < 0.95, hyperdiploid when the DNA index ranged from 1.06-1.74, and tetraploid/near-tetraploid once the DNA index was > 1.74. All remaining cases were considered to be diploid.22
Statistical analysis
The prognostic impact of the high-risk CA, including t(4;14), t(14;16), and/or del(17p), was analyzed by comparing the outcomes in terms of overall response rate (ORR), CR rate, PFS, and OS of patients with standard-risk versus high-risk CA. Disease response was assessed according to the European Group for Blood and Marrow Transplantation criteria,23 including both standard CR, immunofixation-negative CR (IF− CR), and immunofixation-positive near-complete response (IF+ nCR). PFS was measured as the time from randomization to disease progression or death from any cause, and OS as the time from randomization to death from any cause.
The χ2 and Fisher exact tests were used, as appropriate, to compare ORR, CR, and nCR between both standard- and high-risk subgroups, and time-to-event data were estimated by the Kaplan-Meier method, significance being determined with a 2-sided long-rank test. Cox proportional hazards regression models were derived to estimate hazard ratios (HRs) and 95% confidence intervals (CIs). All statistical analyses were done with SPSS Version 15.0 software.
Results
Overall efficacy
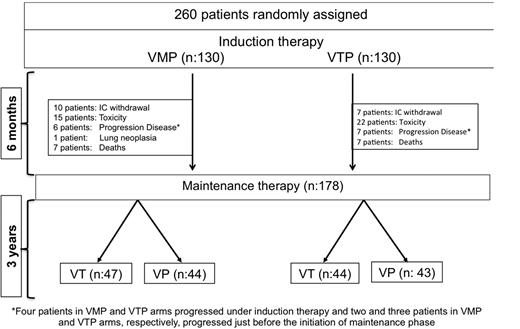
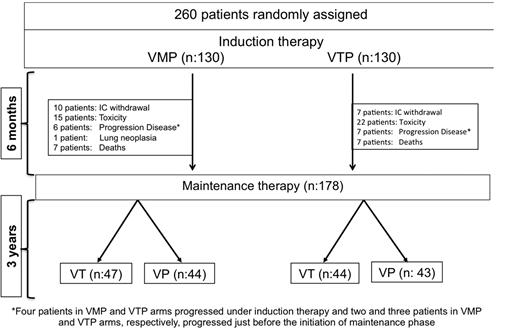
Figure 2 shows the patient distribution at the time of this analysis. Of the 260 patients included in the trial, VMP and VTP as induction regimens yielded similar response rates (80% and 81%, respectively), including 20% and 27% IF− CR rates, respectively (P = .2; mean CR rate for the whole population, 24%). In the 178 patients who were evaluable for response during maintenance therapy and after a median follow-up of 22 months (interquartile range [IQR] = 17-29) from the initiation of maintenance, the IF− CR rate was 42%, with no differences between VT and VP.
Trial profile. Four patients in each of the VMP and VTP arms progressed under induction therapy, and 2 patients in VMP group and 3 in VTP group progressed just before to start the maintenance phase.
Trial profile. Four patients in each of the VMP and VTP arms progressed under induction therapy, and 2 patients in VMP group and 3 in VTP group progressed just before to start the maintenance phase.
With a median follow-up of 32 months (IQR = 25-38) from first randomization, the median PFS for all patients was 31 months (95% CI = 27-36) with a 3-year OS of 70% (95% CI = 64-76) and no significant differences between induction and maintenance regimens.24
Impact of cytogenetic abnormalities
FISH analysis was possible in 232 of 260 patients (89%) in the trial. Forty-four of these 232 patients qualified as high-risk (19%); 17 of them (7%) had t(4;14) ± del(13q), 21 patients (9%) had del(17p) ± del(13q), in 3 cases (1%) t(4;14) and del(17p) coexisted, and 3 additional patients (1%) had t(14;16). Only 1 patient had t(4;14) as a single CA. The remaining 188 patients (81%) were considered as standard-risk based on the absence of these FISH abnormalities (110 cases) or the presence of either single del(13q) (52 cases) or t(11;14) (26 cases).
The baseline characteristics of standard- and high-risk CA patient subgroups are shown in Table 1. No significant differences were observed between them, except for a slightly higher median B2M value in the high-risk subgroup (5.2 vs 3.8 mg/L) and a higher percentage of patients in stage III (43% vs 30% for high- and standard-risk patients, respectively). The distribution according to treatment arm was identical in both risk subgroups: 49%/51% received VMP/VTP as induction therapy in the standard-risk group versus 50%/50% in the high-risk group, respectively. For maintenance, the distribution was also superimposed: 51%/49% in the standard-risk group and 54%/46% in the high-risk group received VT and VP, respectively.
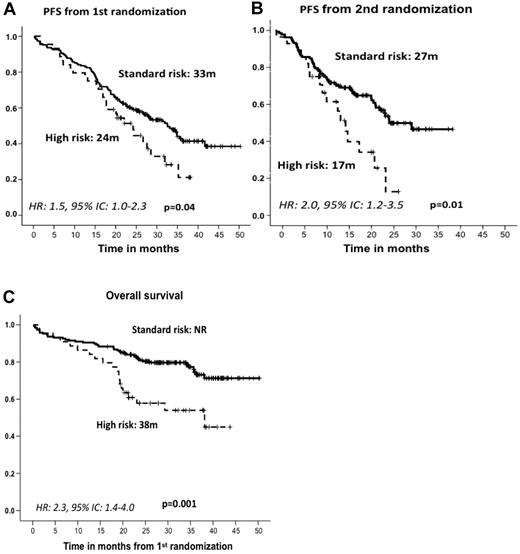
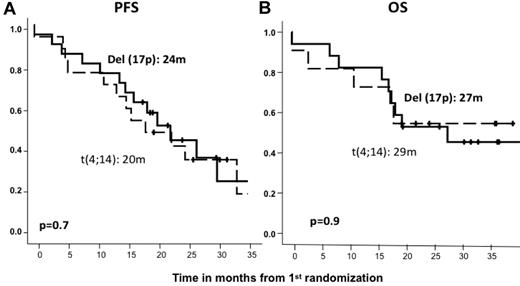
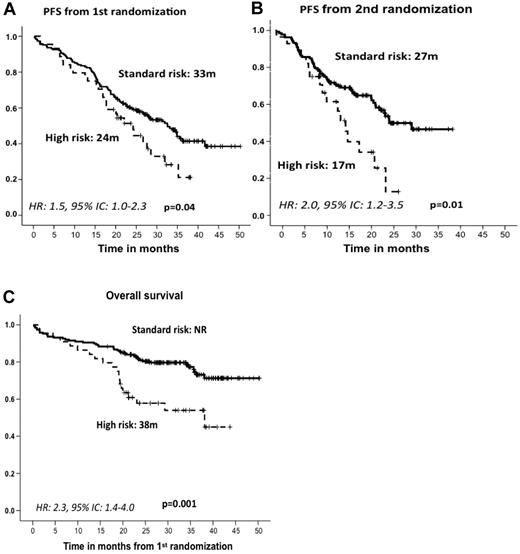
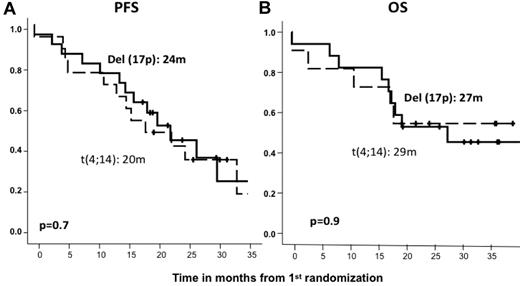
After induction therapy, the response rate was similar in the standard- and high-risk patient subgroups; the ORRs (≥ partial response) were 82% and 79%, including 27% and 21% CR rates, respectively (Table 2). The type of induction regimen (VMP or VTP) did not influence the response rate in either standard- or high-risk CA patients (data not shown). After maintenance therapy, similar response rates were observed for standard- and high-risk CA patients (45% and 40% CRs, respectively; Table 2), with no significant differences associated with the maintenance treatment arm (VT or VP). However, with respect to PFS since first randomization and after a median follow-up of 32 months (IQR = 25-38), the high-risk CA cohort showed a significantly shorter PFS than did standard-risk patients (24 months vs 33 months, P = .04; HR = 1.5; 95% CI = 1.0-2.3; Figure 3A). A similar relationship was detected when PFS was measured from the second randomization to the beginning of maintenance therapy: 17 months versus 27 months for high- and standard-risk CA patients, respectively (P = .01; HR = 2.0; 95% CI = 1.2-3.5; Figure 3B). These results translated into a significantly shorter OS for high-risk CA patients (median, 38 months) than for the standard-risk subgroup (median not reached, 73% at 3 years; P = .001; HR = 2.3; 95% CI = 1.4-4.0; Figure 3C). In addition, we investigated the influence of the induction and/or maintenance treatment arm in the outcome (PFS and OS) of high-risk CA patients. No differences were observed either with respect to the induction (VMP/VTP) or to the maintenance (VT/VP) arms. Finally, a poor outcome in terms of PFS and OS for high-risk CA patients was observed regardless of the type of cytogenetic abnormality, and when we evaluated the influences of t(4;14) and del(17p) separately, no differences were observed between these 2 abnormalities (Figure 4).
Outcome according to cytogenetic abnormalities. PFS from first (A) and second (B) randomization and OS (C) by type of cytogenetic abnormality. NR indicates not reached.
Outcome according to cytogenetic abnormalities. PFS from first (A) and second (B) randomization and OS (C) by type of cytogenetic abnormality. NR indicates not reached.
Outcome according to the type of high-risk cytogenetic abnormality. PFS (A) and OS (B) from first randomization by type of cytogenetic abnormality.
Outcome according to the type of high-risk cytogenetic abnormality. PFS (A) and OS (B) from first randomization by type of cytogenetic abnormality.
Impact of DNA ploidy
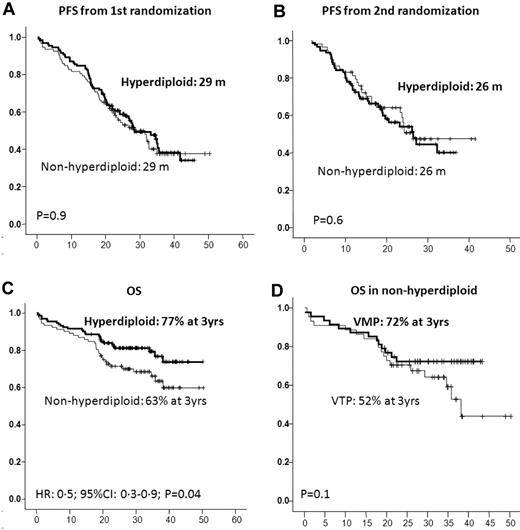
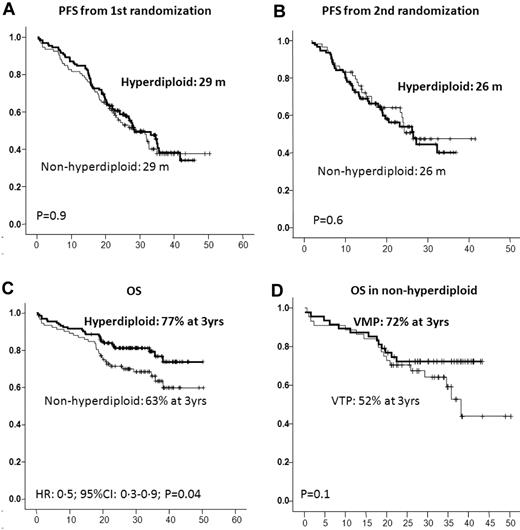
Of the 224 of 260 patients included in the trial who were evaluated for DNA ploidy, 132 (59%) showed a DNA index between 1.06 and 1.74, and were accordingly considered to be hyperdiploid, whereas the remaining 92 cases (41%) had a DNA index ≤ 1.05 and were defined as nonhyperdiploid. The groups did not differ with respect to their baseline characteristics and were also well balanced for induction and maintenance treatment arms (Table 3). Similar ORRs were observed in hyperdiploid and nonhyperdiploid patients (83% and 78%, respectively), including a 23% and 25% IF− CR rate after induction, respectively, and a 43% and 41% IF− CR rate after maintenance, respectively (Table 4). Once again, neither induction nor maintenance treatment arm allocation influenced these efficacy results. The PFS from the first and second randomization was almost identical in both groups of patients (P = .9 and 0.6, respectively; Figure 5); however, nonhyperdiploid patients had a significantly shorter OS than hyperdiploid cases (3-year OS: 63% vs 77%, P = .04). Interestingly, the negative influence of nonhyperdiploidy was more evident in the group of patients receiving VTP as induction than in those treated with VMP, with a trend toward shorter OS for VTP vs VMP (3-year OS: 52% vs 72%, P = .1); in fact, nonhyperdiploid patients receiving VMP as induction had a 3-year OS of 72%, a figure similar to that of the hyperdiploid cohort (Figure 5).
Outcome according to the DNA ploidy. PFS and OS from first (A) and second (B) randomization by level of DNA ploidy; OS by level of DNA ploidy (C); and OS in nonhyperdiploid patients by induction scheme (D).
Outcome according to the DNA ploidy. PFS and OS from first (A) and second (B) randomization by level of DNA ploidy; OS by level of DNA ploidy (C); and OS in nonhyperdiploid patients by induction scheme (D).
Finally, multivariate Cox regression analysis of PFS and OS according to the International Staging System stage (I vs II and III), B2-microglobulin (≤ 4 vs > 4), standard- versus high-risk CA, and nonhyperdiploidy versus hyperdiploidy showed that the presence of high-risk CA was the only variable that retained independent prognostic value for both PFS (P = .02; HR = 1.7; 95% CI = 1.0-2.5) and OS (P = .001; HR = 2.5; 95% CI = 1.4-4.4).
Discussion
We have reported previously that soft-induction, bortezomib-based regimens that use a less intensive dose of bortezomib (weekly instead of biweekly) over 6 cycles, followed by maintenance, are highly effective and have a favorable toxicity profile in elderly, untreated MM patients.24 However, unfortunately, the present study shows that this treatment scheme is not able to overcome the poor prognosis of high-risk CA and nonhyperdiploidy.
The capacity of novel agents to overcome the poor outcome of high-risk CA remains controversial. Data from transplantation-candidate patients indicate that thalidomide plus dexamethasone alone does not overcome this adverse prognosis.25 Lenalidomide induces a high response rate, but the PFS is short in this setting.26,27 In contrast, in some studies, the use of bortezomib has shown similar survival for patients in the high- and standard-risk CA subgroups, probably with the exception of those with del(17p).6,7,9 Unfortunately, information is even scarcer in elderly patients. In our study, although ORR (including CR), were almost identical in both risk subgroups, this did not translate into the time-to-event data, because the high-risk CA subgroup had significantly shorter PFS and OS than did standard-risk patients. Furthermore, this poor outcome was observed regardless of the induction and maintenance treatment to which the patients were assigned. In the VISTA trial, the response rate and survival were similar for standard- and high-risk patients, although the latter cohort was rather small (26 cases).10,11 It should be noted that these 2 trials, although both based on bortezomib treatment, had a different design in terms of dose intensity and treatment duration. The GIMEMA group has also evaluated the weekly administration of bortezomib in a recent trial comparing 9 cycles of VMP without maintenance with 9 cycles of VMPT followed by maintenance with VT.12 In that study, no differences in survival have so far been observed between standard- and high-risk patients.12 It is worth noting that although the patients in the GIMEMA trial received a weekly schedule, the number of induction cycles was 9, as in the VISTA trial, instead of the 6 cycles given in our trial. Therefore, it is possible that modified VMP schemes, even with weekly administration, could overcome the poor prognosis of high-risk CA, although this might require a “minimal” dose intensity and cumulative dose of bortezomib.
With regard to the prognostic influence of the individual CA, data derived from young patients treated with novel agents plus autologous stem cell transplantation continue to show that del(17p) is a strong prognostic factor,6,7,9,25,26 with the only possible exception being data reported by the Arkansas group in the Total Therapy 3 program.28 In contrast, the adverse prognosis of t(4;14) is not so evident in young patients receiving bortezomib-based combinations.6,9 The VISTA and GIMEMA trials discussed above do not separately report on the outcome of elderly patients carrying t(4;14) or del(17p); in the present study, we have evaluated the influence of these 2 CAs, noting a poor outcome in both.
Although the prognostic significance of the nonhyperdiploid state was initially reported by karyotype analysis,13 other techniques for assessing it, such as copy number variation and the gene-expression profile, have also reproduced an association between nonhyperdiploid and poor outcome, especially for the hypodiploid cases.14,15 Furthermore, several groups, including ours, have shown that flow cytometric analysis of DNA content provides similar prognostic information.16-19 In our study, using multiparametric flow cytometry to evaluate DNA content, PFS was almost identical in hyperdiploid and nonhyperdiploid patients. This indicates that our current treatment approach may be able to overcome, at least partially, the adverse prognosis of nonhyperdiploid cases. However, OS was found to be significantly shorter for nonhyperdiploid patients, the outcome being especially poor in the group of patients receiving VTP as induction (3-year OS: 52%) compared with those receiving VMP (3-year OS: 72%). In fact, this latter group had a similar OS to that observed in hyperdiploid patients (77% at 3 years). This result suggests that the DNA damage induced by the alkylating agent used in the VMP combination may have a favorable effect for nonhyperdiploid patients.
Finally, it should be noted that the survival curves for the standard- and high-risk CA groups, as well as hyperdiploid and nonhyperdiploid groups, were similar during the first 20 months, separating thereafter, suggesting a possible effect of the salvage therapy. Nevertheless, our data do not support such a possibility. Sixty percent of our patients received salvage with lenalidomide-dexamethasone, 25% with chemotherapy, and 15% with bortezomib-based combinations. Overall, 67% of patients achieved ≥ partial response with rescue treatment without significant differences in response rate and OS (from the moment of disease progression) according to the type of salvage therapy used.
In summary, the present schema, based on 6 months of weekly bortezomib induction followed by maintenance with bortezomib every 3 months, is not able to overcome the adverse prognosis of high-risk CA in elderly MM patients. This pattern applied to patients with t(4;14) or del(17p) and was independent of the induction and maintenance treatment arm. Our data also showed that nonhyperdiploid cases displayed a worse outcome than did hyperdiploid patients, particularly those receiving VTP induction treatment. These results suggest that continuous efforts are still required to overcome the dismal prognosis of high-risk MM patients.
The publication costs of this article were defrayed in part by page charge payment. Therefore, and solely to indicate this fact, this article is hereby marked “advertisement” in accordance with 18 USC section 1734.
Acknowledgments
The authors thank Arturo Touchard for providing data management support.
This study was funded and sponsored by Pethema (Spanish Program for the Treatment of Hematologic Diseases, Madrid, Spain) and was coordinated by the Spanish Myeloma Group (PETHEMA/Gem). Cytogenetic and DNA ploidy studies were supported by a grant from Fondo de Investigación Sanitaria (FIS; 06/1354). This study was partially supported by the FIS Intrasalud Project (PS2009/01 897) and by grants from Red Temática Cooperativa en Cáncer (RTICC; RD06/0020/0005/0006/0031).
Authorship
Contribution: M.-V.M., J.-J.L., J.B., and J.F.S.M. served as the principal investigators and were involved in the original idea and design of the study; M.-V.M. and J.F.S.M. wrote the protocol and report and analyzed and interpreted the data; N.C.G., M.-L.M.R., B.P., M.-A.M., M.F., and M.-B.V. performed the cytogenetic and DNA-ploidy studies; and M.-V.M., A.O., J.M.-L., A.-I.T., E.B., A.M., J.D.-M., F.d.A., L.P., J.-M.H., A.S., J.B., F.-J.P., J-M.R., M.-L.M.-M., and R.G.-S. contributed patients.
Conflict of interest disclosure: M.-V.M. has served on speakers' bureaus for Millennium, Celgene, and Ortho-Biotech; N.G., B.P., A.O., J.-M.H., F.A., L.P., R.G.-S., and J.-J.L. have received honoraria from Ortho-Biotech and Celgene; J.B. has received honoraria from and is on advisory boards for Ortho-Biotech and Celgene; and J.F.S.M. has served on speakers' bureaus and advisory boards for Millennium, Ortho-Biotech, and Celgene. The remaining authors declare no competing financial interests.
Correspondence: María-Victoria Mateos, MD, PhD, Hema-tology Department, Hospital Universitario de Salamanca, Paseo San Vicente, 58-182, 37007 Salamanca, Spain; e-mail: mvmateos@usal.es.

